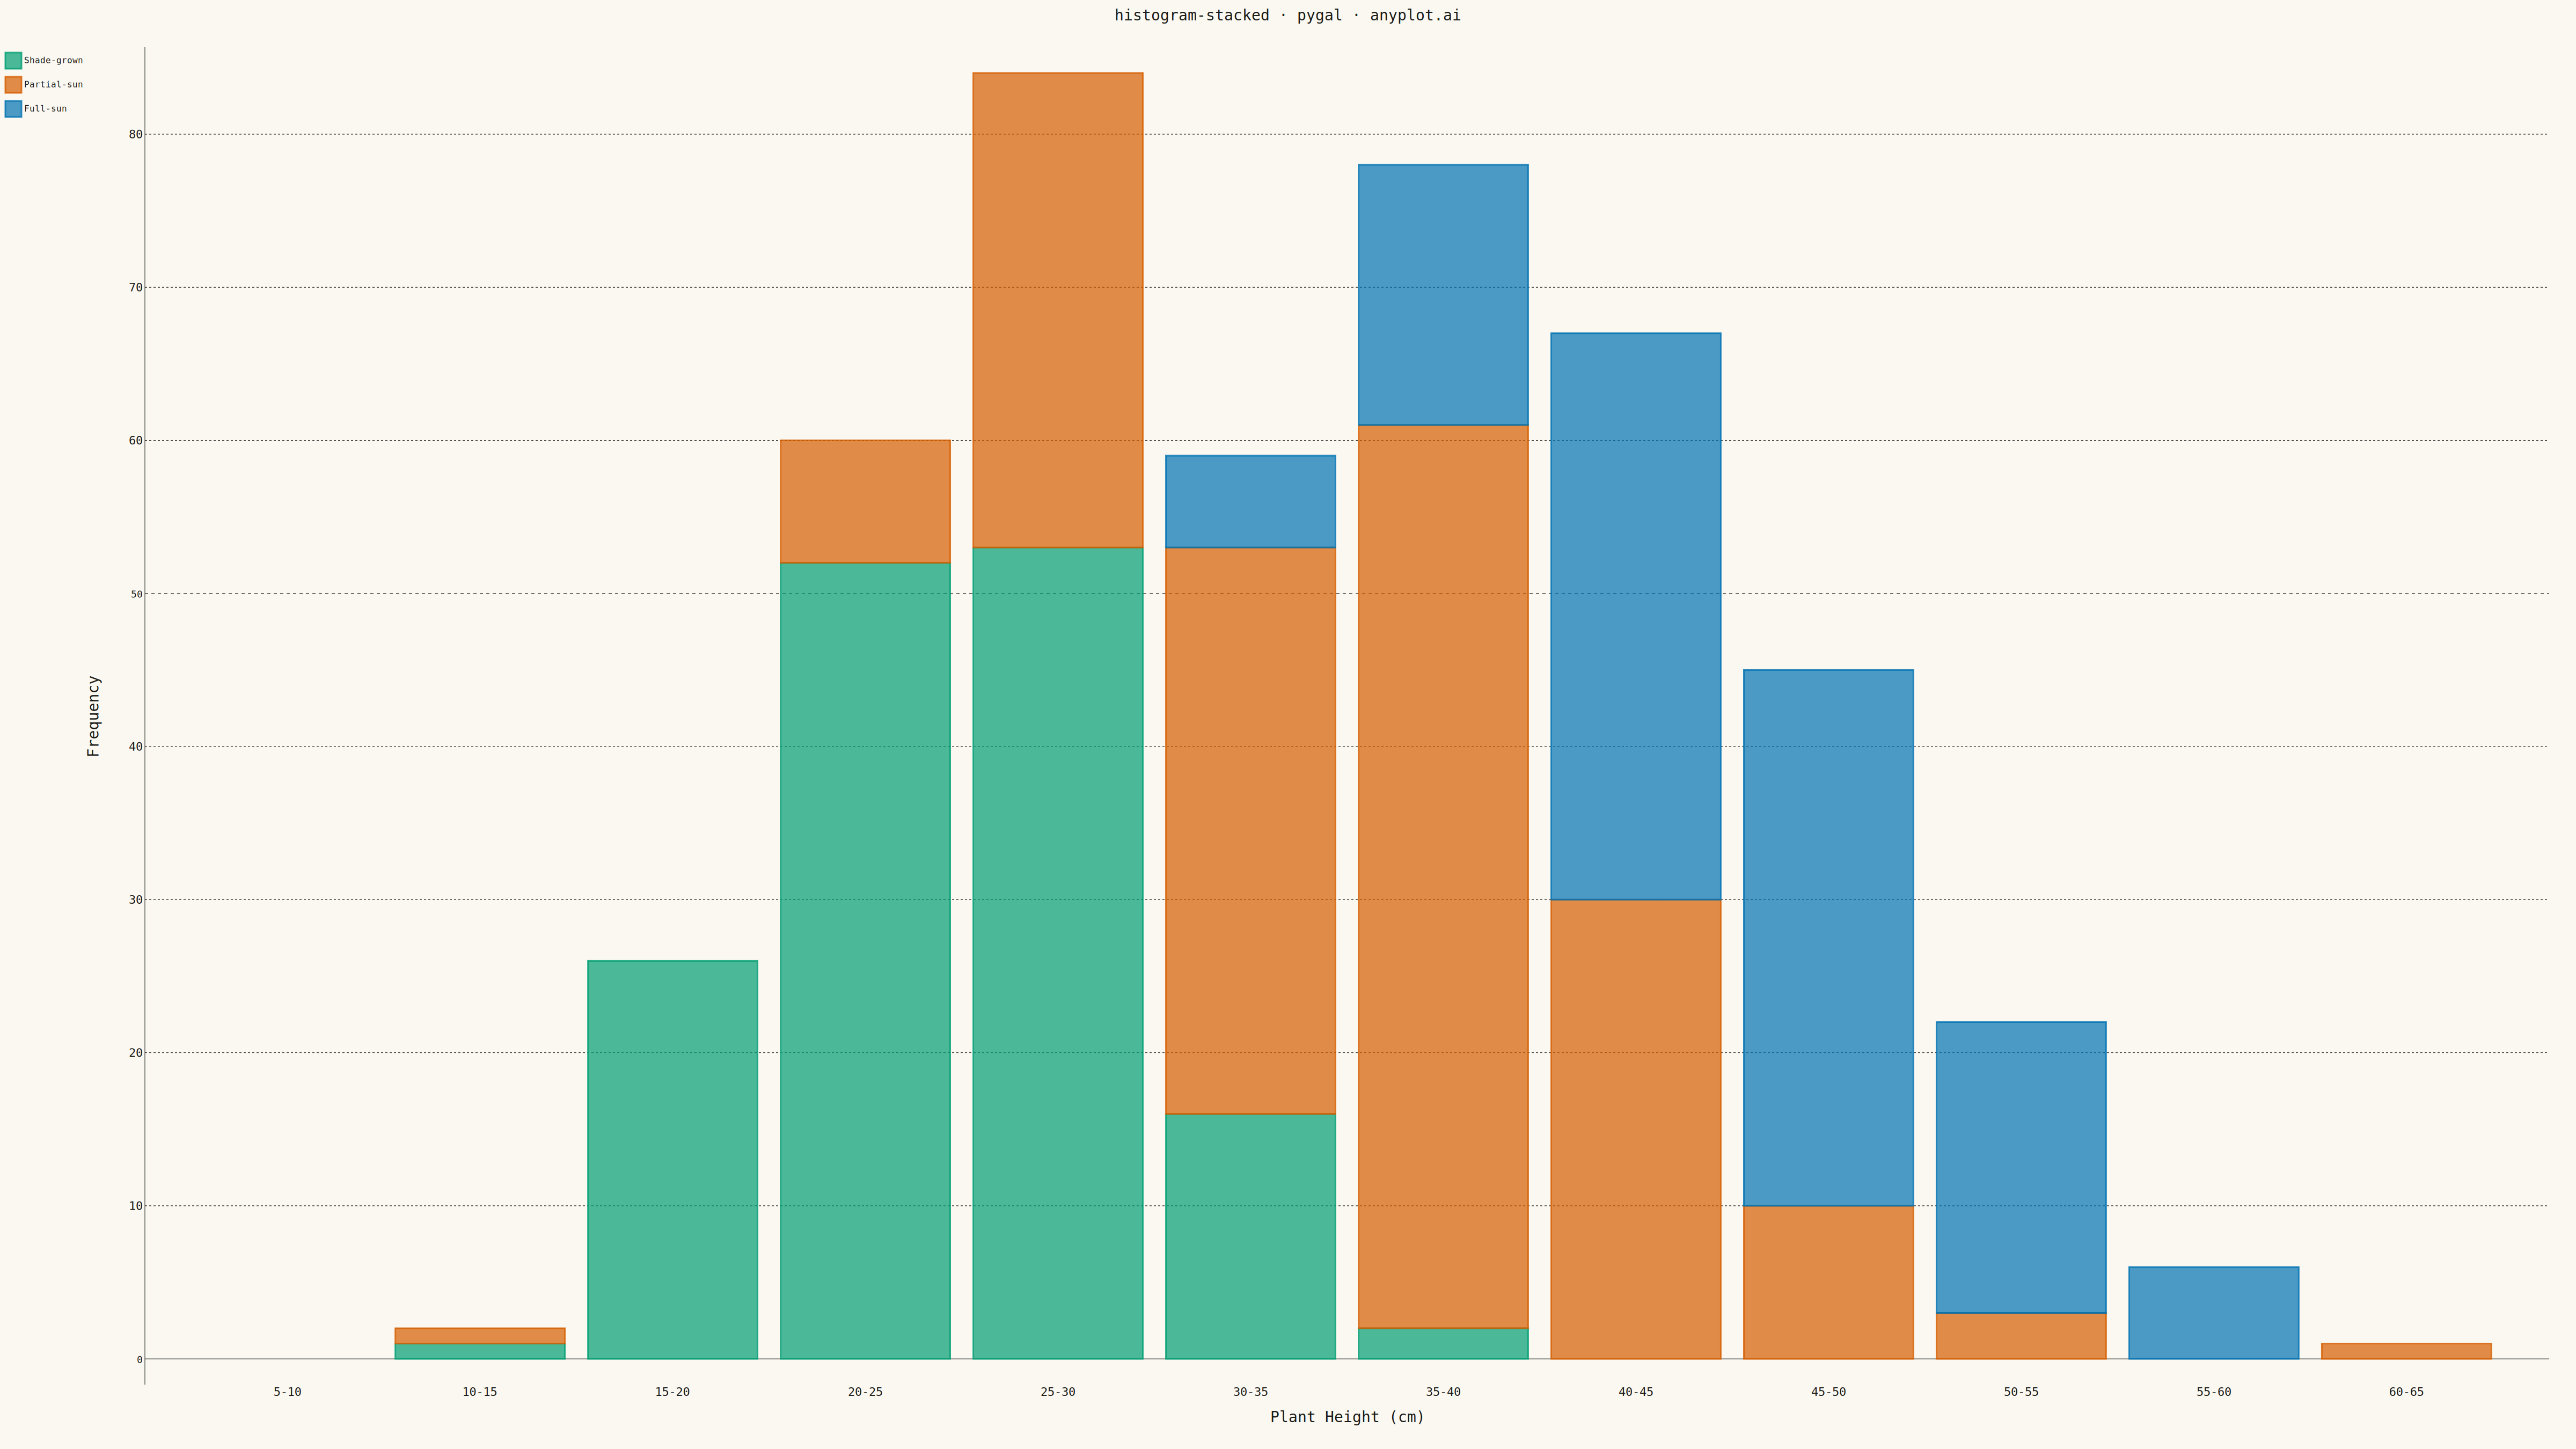
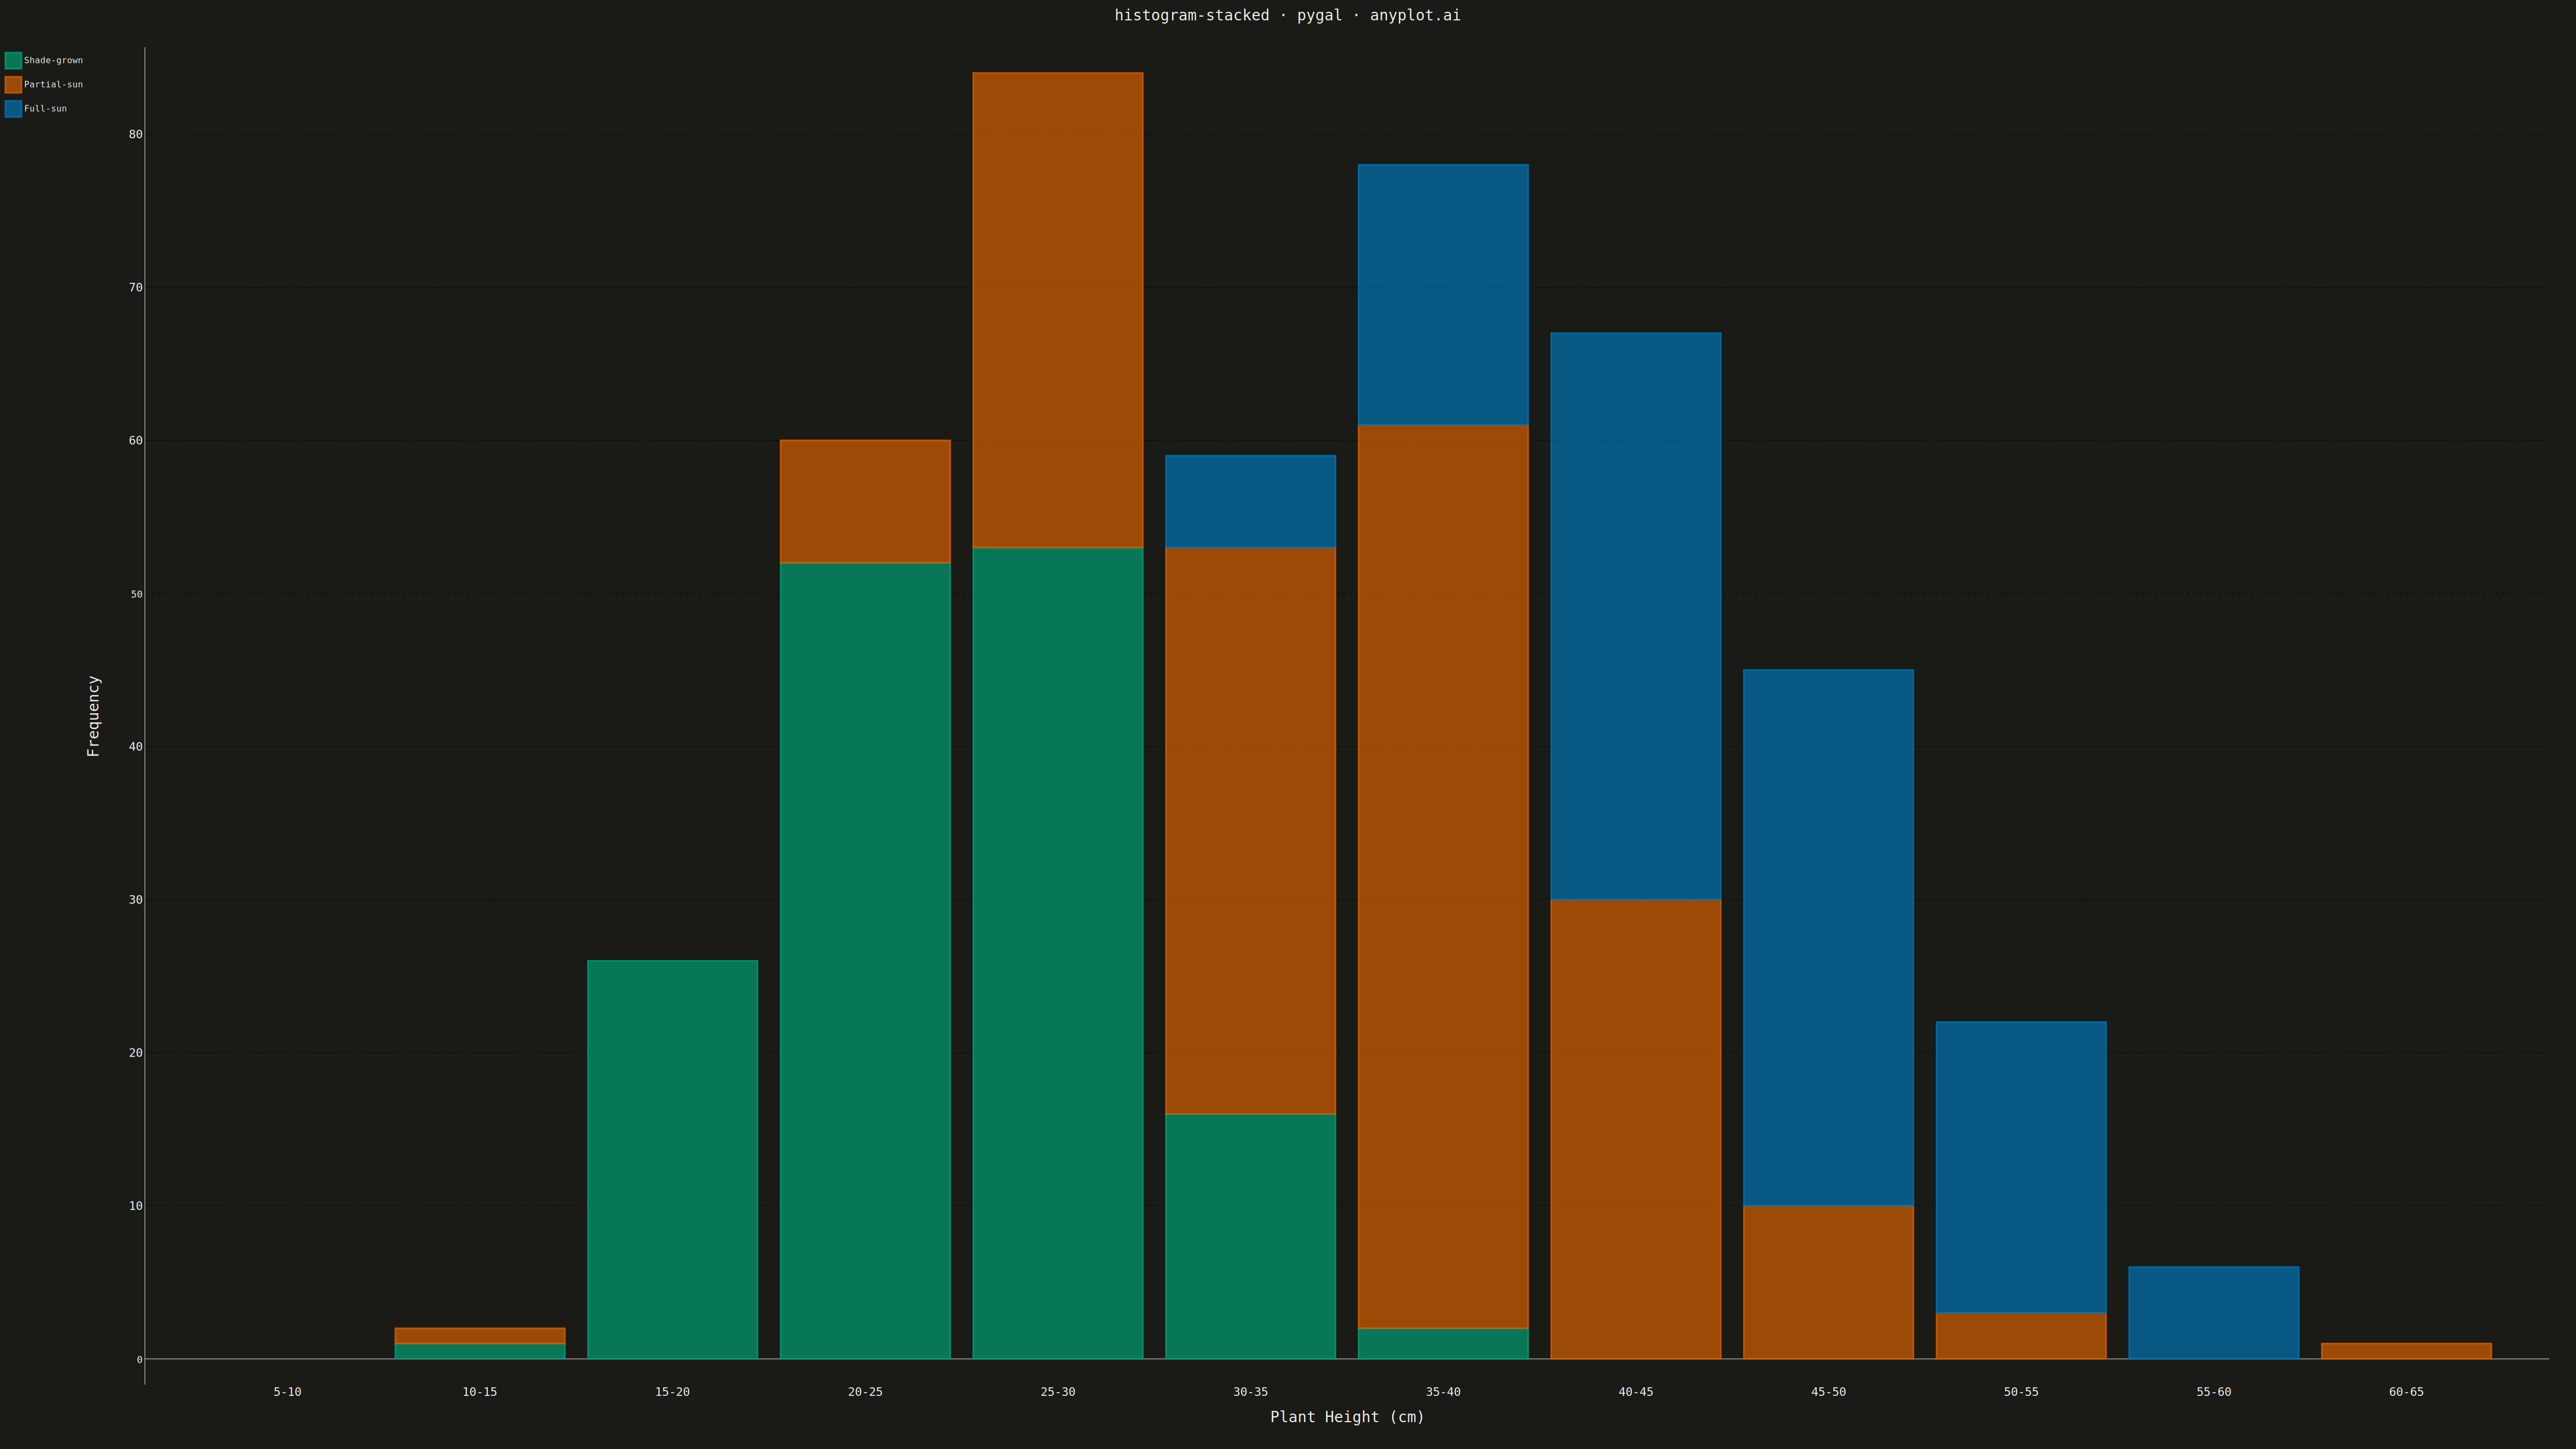
A histogram showing multiple groups stacked on top of each other within each bin. The total bar height represents the combined frequency, while colored segments show individual group contributions.
""" anyplot.ai
histogram-stacked: Stacked Histogram
Library: pygal 3.1.0 | Python 3.13.13
Quality: 73/100 | Updated: 2026-05-12
"""

import numpy as np
import pygal
from pygal.style import Style


# Data - Three groups with different distributions (plant growth measurements in cm)
np.random.seed(42)
group_a = np.random.normal(25, 5, 150)  # Shade-grown plants
group_b = np.random.normal(35, 7, 180)  # Partial-sun plants
group_c = np.random.normal(45, 6, 120)  # Full-sun plants

# Define bin edges
bin_edges = np.linspace(5, 65, 13)  # 12 bins from 5 to 65 cm

# Compute histogram counts for each group
counts_a, _ = np.histogram(group_a, bins=bin_edges)
counts_b, _ = np.histogram(group_b, bins=bin_edges)
counts_c, _ = np.histogram(group_c, bins=bin_edges)

# Create bin labels (center of each bin)
bin_labels = [f"{int(bin_edges[i])}-{int(bin_edges[i + 1])}" for i in range(len(bin_edges) - 1)]

# Custom style for pyplots.ai
custom_style = Style(
    background="white",
    plot_background="white",
    foreground="#333333",
    foreground_strong="#333333",
    foreground_subtle="#666666",
    colors=("#306998", "#FFD43B", "#4CAF50"),  # Python Blue, Yellow, Green
    title_font_size=60,
    label_font_size=36,
    major_label_font_size=32,
    legend_font_size=36,
    value_font_size=28,
    tooltip_font_size=28,
    stroke_width=2,
)

# Create stacked bar chart (pygal Bar with stacked data simulates stacked histogram)
chart = pygal.StackedBar(
    width=4800,
    height=2700,
    style=custom_style,
    title="histogram-stacked \u00b7 pygal \u00b7 pyplots.ai",
    x_title="Plant Height (cm)",
    y_title="Frequency",
    show_y_guides=True,
    show_x_guides=False,
    legend_at_bottom=False,
    legend_box_size=30,
    margin=50,
    spacing=10,
    truncate_legend=-1,
)

# Set x-axis labels
chart.x_labels = bin_labels

# Add stacked data
chart.add("Shade-grown", counts_a.tolist())
chart.add("Partial-sun", counts_b.tolist())
chart.add("Full-sun", counts_c.tolist())

# Save outputs
chart.render_to_png("plot.png")
chart.render_to_file("plot.html")
Runnable source as JSON, for any HTTP client: https://api.anyplot.ai/specs/histogram-stacked/pygal/code. Any spec id and library id listed in llms-full.txt fit the same URL shape; every URL below is complete and callable.
{
  "spec_id": "histogram-stacked",
  "language": "python",
  "library": "pygal",
  "page": "https://anyplot.ai/histogram-stacked/python/pygal",
  "hub": "https://anyplot.ai/histogram-stacked",
  "code_json": "https://api.anyplot.ai/specs/histogram-stacked/pygal/code",
  "spec_json": "https://api.anyplot.ai/specs/histogram-stacked",
  "render_light_png": "https://storage.googleapis.com/anyplot-images/plots/histogram-stacked/python/pygal/plot-light.png",
  "render_dark_png": "https://storage.googleapis.com/anyplot-images/plots/histogram-stacked/python/pygal/plot-dark.png",
  "interactive_light_html": "https://storage.googleapis.com/anyplot-images/plots/histogram-stacked/python/pygal/plot-light.html",
  "interactive_dark_html": "https://storage.googleapis.com/anyplot-images/plots/histogram-stacked/python/pygal/plot-dark.html",
  "quality_score": 73.0,
  "license": "MIT",
  "guide": "https://anyplot.ai/llms.txt"
}
Part of Stacked Histogram on anyplot.ai.