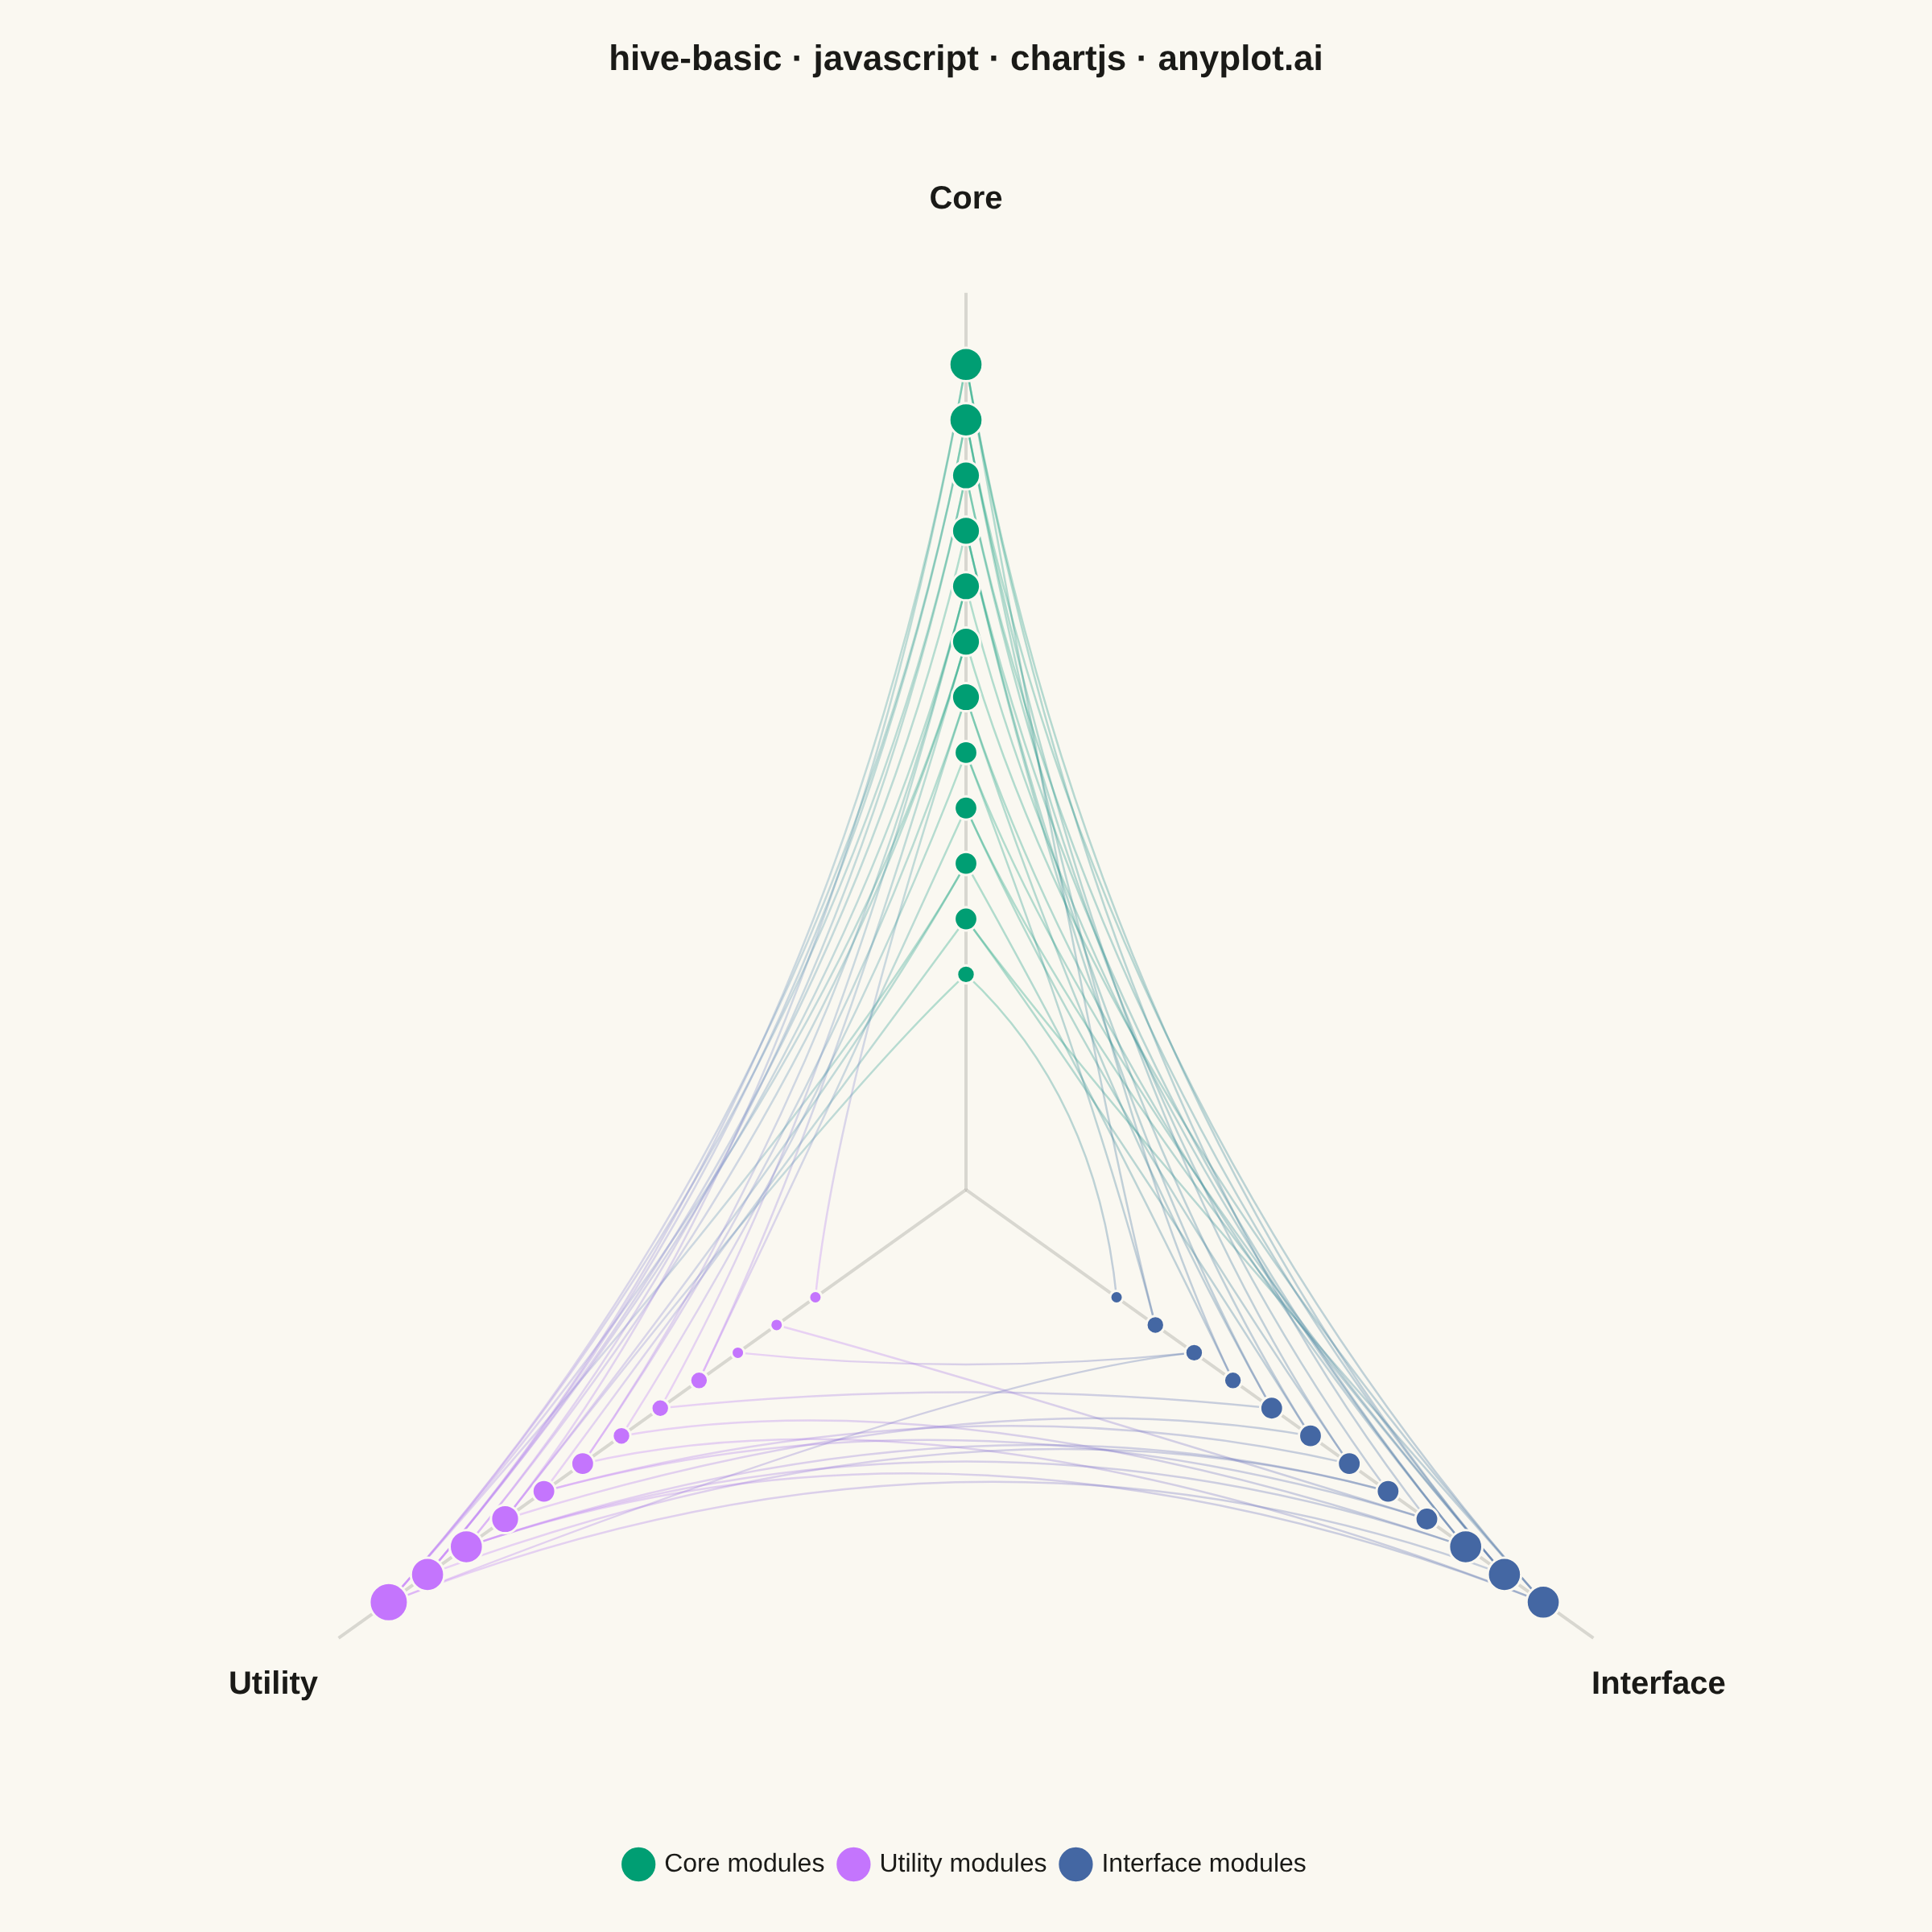
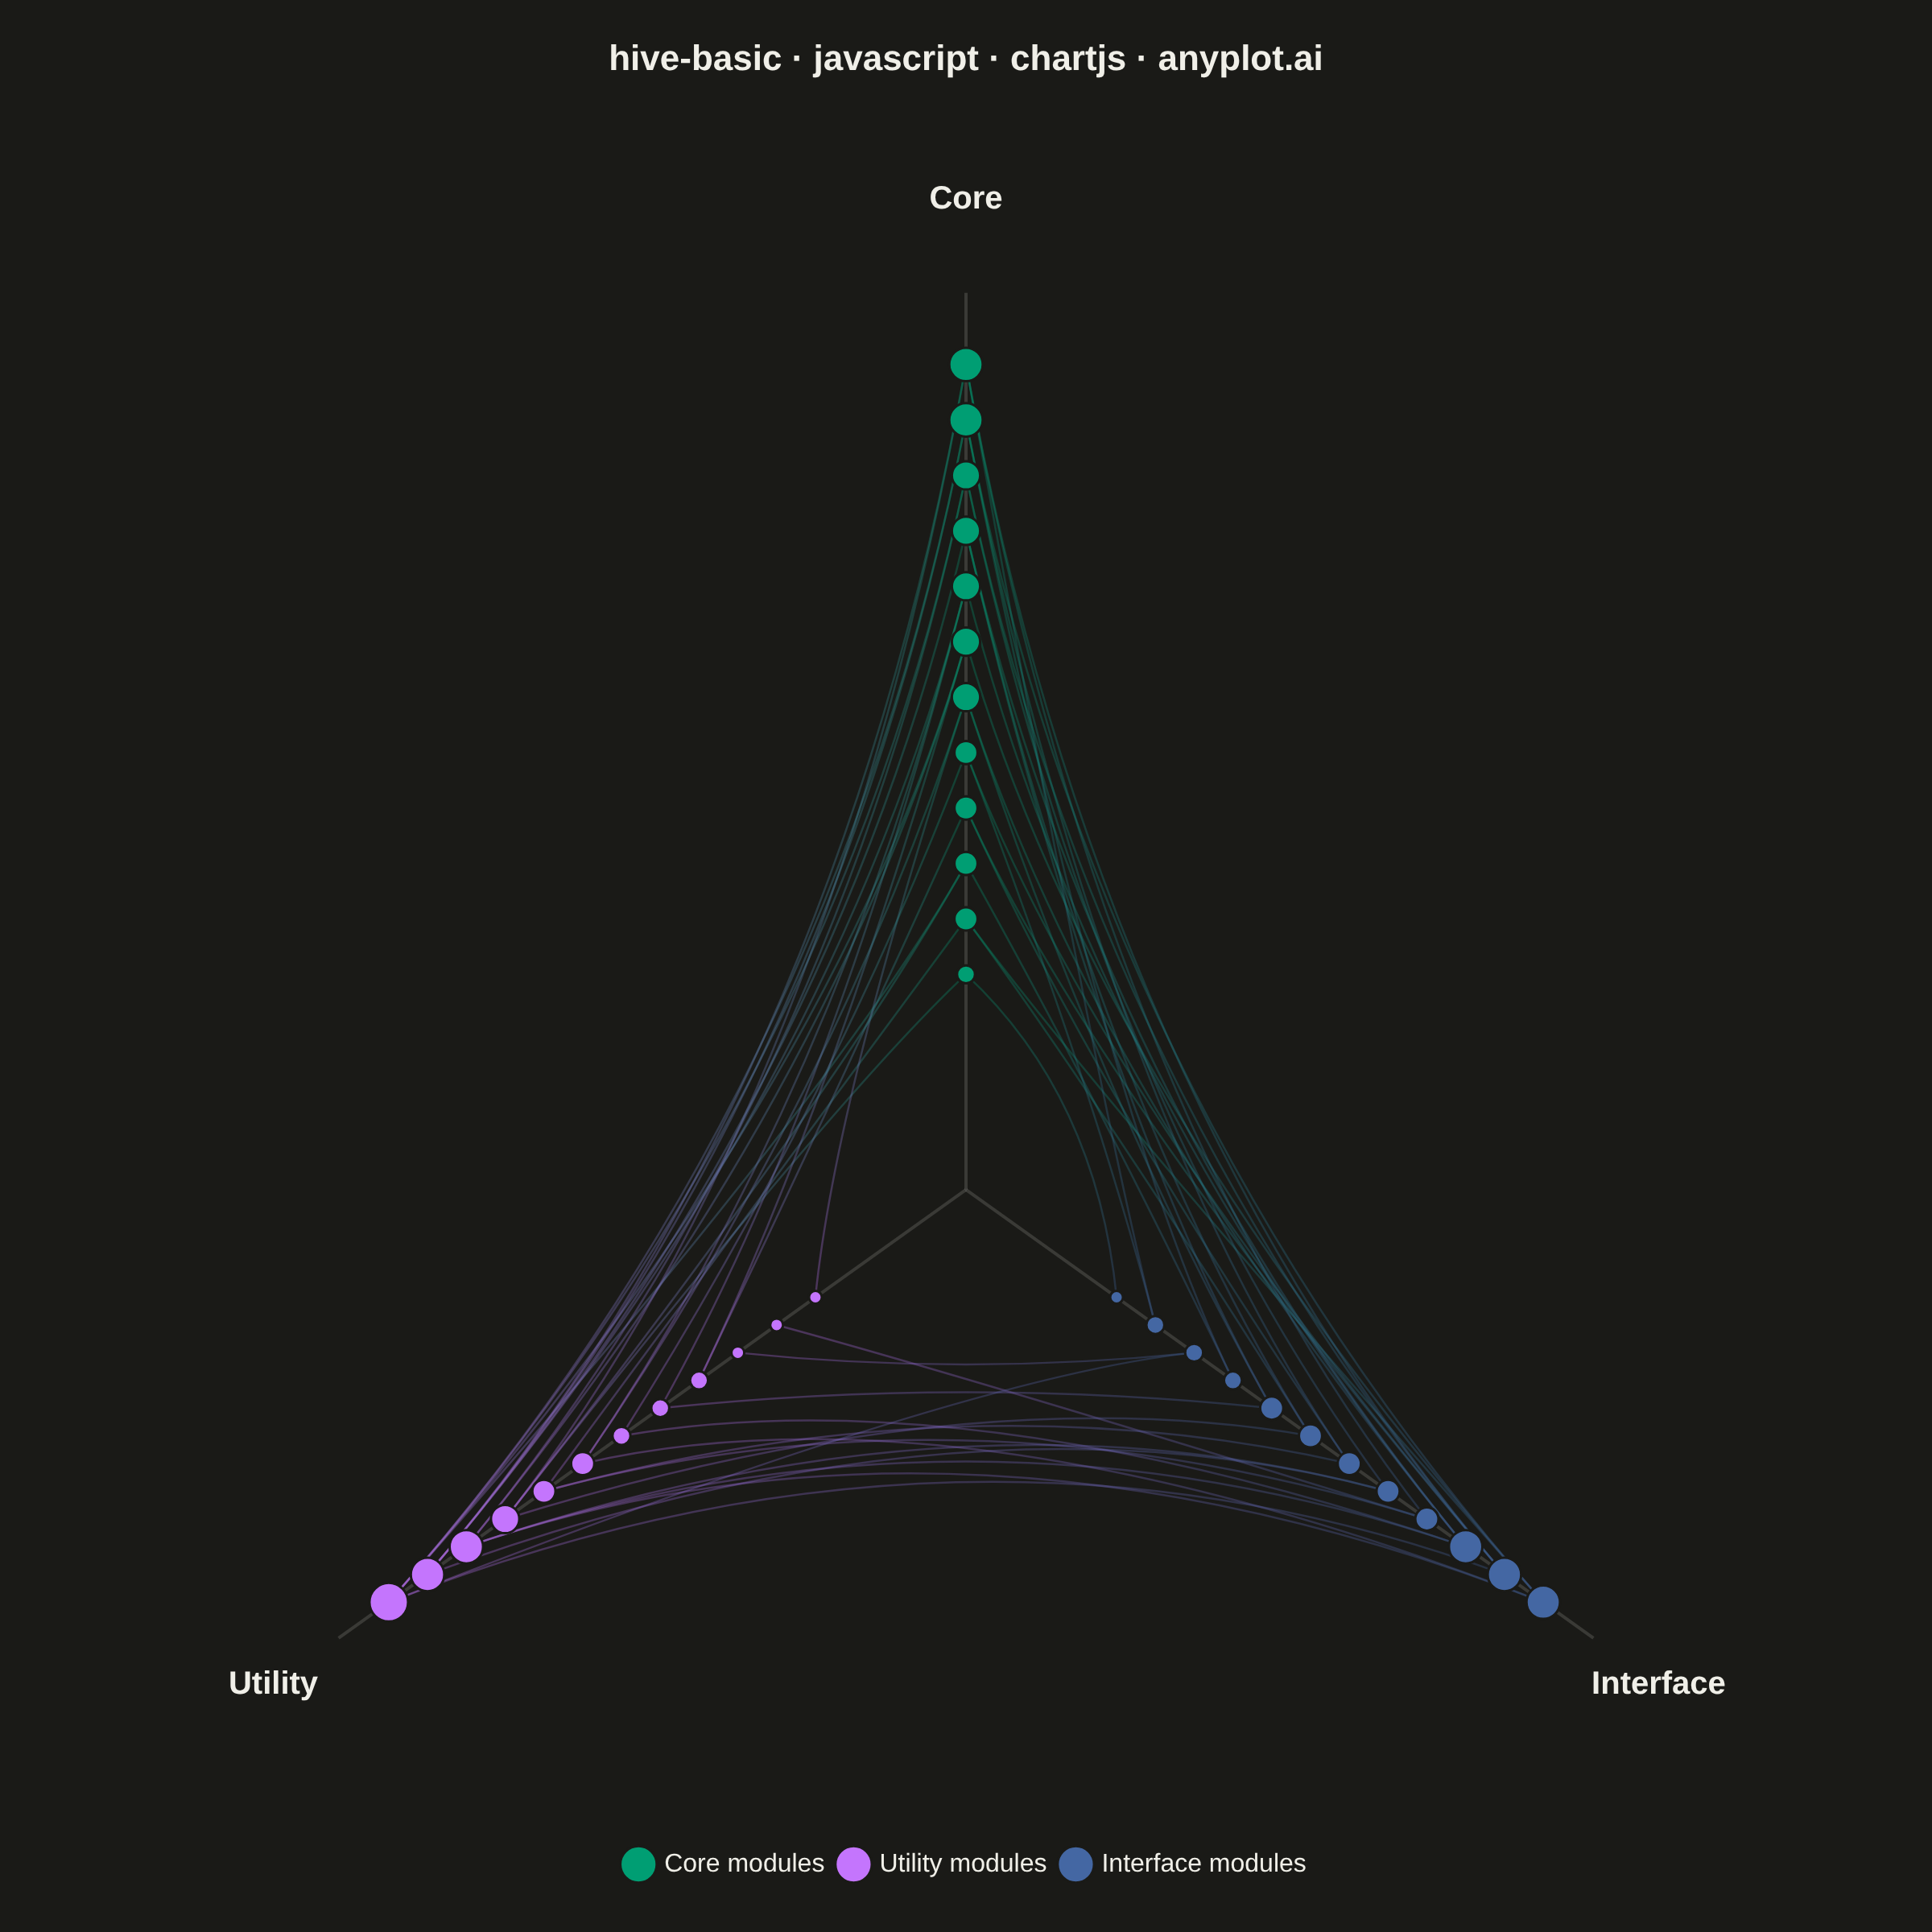
The same plot in 14 other libraries — JavaScript: D3.js, Apache ECharts, Highcharts, MUI X Charts; Python: Altair, Bokeh, lets-plot, Matplotlib, Plotly, plotnine, Pygal, Seaborn; R: ggplot2; Julia: Makie.jl. Compare all 15 side by side: Basic Hive Plot in Python, R, Julia and JavaScript.
A hive plot arranges network nodes on radial axes based on node properties (such as degree, category, or other attributes), enabling reproducible and directly comparable network visualizations. Unlike force-directed layouts which can produce different arrangements for identical networks, hive plots always render the same network identically, solving the "hairball" problem of traditional network graphs and making structural comparisons reliable.
// anyplot.ai
// hive-basic: Basic Hive Plot
// Library: chartjs 4.4.7 | JavaScript 22.23.2
// Quality: 89/100 | Created: 2026-09-05
//# anyplot-orientation: square

const t = window.ANYPLOT_TOKENS;

// --- Deterministic PRNG (LCG) ------------------------------------------------
let seed = 42;
function rand() {
  seed = (seed * 1103515245 + 12345) & 0x7fffffff;
  return seed / 0x7fffffff;
}

// --- Data: software module dependency network -------------------------------
// Three axes group modules by type; a node's position along its axis encodes
// its degree, so the same network always renders identically — the reason a
// hive plot is chosen over a force-directed "hairball" layout.
const AXES = [
  { key: "core", label: "Core", angle: 90, color: t.palette[0] },
  { key: "utility", label: "Utility", angle: 210, color: t.palette[1] },
  { key: "interface", label: "Interface", angle: 330, color: t.palette[2] },
];
const NODES_PER_AXIS = 12;
const R_MIN = 3;
const R_MAX = 11.5;
const AXIS_END = 12.5;
const LABEL_R = 13.8;
const EDGE_PROBABILITY = 0.11;

const nodes = [];
AXES.forEach((axis) => {
  for (let i = 0; i < NODES_PER_AXIS; i++) {
    nodes.push({ id: `${axis.key}-${i + 1}`, axis: axis.key, degree: 0 });
  }
});

// Hive plots draw only cross-axis dependencies; same-axis edges would need
// arcs bowed off-axis and are skipped for clarity (per the spec's guidance).
const edges = [];
for (let i = 0; i < nodes.length; i++) {
  for (let j = i + 1; j < nodes.length; j++) {
    if (nodes[i].axis === nodes[j].axis) continue;
    if (rand() < EDGE_PROBABILITY) {
      edges.push([nodes[i], nodes[j]]);
      nodes[i].degree += 1;
      nodes[j].degree += 1;
    }
  }
}

const maxDegree = Math.max(...nodes.map((n) => n.degree));
const minDegree = Math.min(...nodes.map((n) => n.degree));
const degreeSpan = maxDegree - minDegree || 1;

// Position by degree-rank (not raw degree) within each axis: several nodes
// often share the same degree, and raw-value placement would stack them on
// the exact same pixel. Ranking preserves the ordering (higher degree = further
// out) while guaranteeing every node its own spot along the axis.
AXES.forEach((axis) => {
  const axisNodes = nodes.filter((n) => n.axis === axis.key);
  axisNodes.sort((a, b) => a.degree - b.degree);
  const rad = (axis.angle * Math.PI) / 180;
  axisNodes.forEach((node, rank) => {
    const radius = R_MIN + (rank / (axisNodes.length - 1)) * (R_MAX - R_MIN);
    node.x = radius * Math.cos(rad);
    node.y = radius * Math.sin(rad);
    node.axisColor = axis.color;
  });
});

const axisGeometry = AXES.map((axis) => {
  const rad = (axis.angle * Math.PI) / 180;
  return {
    ...axis,
    endX: AXIS_END * Math.cos(rad),
    endY: AXIS_END * Math.sin(rad),
    labelX: LABEL_R * Math.cos(rad),
    labelY: LABEL_R * Math.sin(rad),
  };
});

function bisectorControlPoint(angleA, angleB) {
  const diff = ((angleB - angleA + 540) % 360) - 180;
  const mid = angleA + diff / 2;
  const rad = (mid * Math.PI) / 180;
  const r = 2.6;
  return { x: r * Math.cos(rad), y: r * Math.sin(rad) };
}

const edgeGeometry = edges.map(([a, b]) => ({
  a,
  b,
  control: bisectorControlPoint(
    AXES.find((ax) => ax.key === a.axis).angle,
    AXES.find((ax) => ax.key === b.axis).angle,
  ),
}));

// --- Mount -------------------------------------------------------------------
const canvas = document.createElement("canvas");
document.getElementById("container").appendChild(canvas);

// --- Custom plugin: draws hive axes + curved edges behind the node markers --
const hiveGeometryPlugin = {
  id: "hiveGeometry",
  beforeDatasetsDraw(chart) {
    const { ctx, scales } = chart;
    const px = (v) => scales.x.getPixelForValue(v);
    const py = (v) => scales.y.getPixelForValue(v);

    ctx.save();
    ctx.globalAlpha = 0.3;
    ctx.lineWidth = 1.25;
    edgeGeometry.forEach(({ a, b, control }) => {
      // Gradient along the edge rather than a.axisColor alone, so a cross-axis
      // edge is colored symmetrically by both endpoints instead of favoring
      // whichever node happened to sort first.
      const gradient = ctx.createLinearGradient(px(a.x), py(a.y), px(b.x), py(b.y));
      gradient.addColorStop(0, a.axisColor);
      gradient.addColorStop(1, b.axisColor);
      ctx.beginPath();
      ctx.moveTo(px(a.x), py(a.y));
      ctx.quadraticCurveTo(px(control.x), py(control.y), px(b.x), py(b.y));
      ctx.strokeStyle = gradient;
      ctx.stroke();
    });
    ctx.globalAlpha = 1;

    ctx.strokeStyle = t.grid;
    ctx.lineWidth = 2;
    axisGeometry.forEach((axis) => {
      ctx.beginPath();
      ctx.moveTo(px(0), py(0));
      ctx.lineTo(px(axis.endX), py(axis.endY));
      ctx.stroke();
    });

    ctx.fillStyle = t.ink;
    ctx.font = "600 20px sans-serif";
    ctx.textAlign = "center";
    ctx.textBaseline = "middle";
    axisGeometry.forEach((axis) => {
      ctx.fillText(axis.label, px(axis.labelX), py(axis.labelY));
    });
    ctx.restore();
  },
};

// --- Chart -------------------------------------------------------------------
new Chart(canvas, {
  type: "scatter",
  data: {
    datasets: AXES.map((axis) => ({
      label: `${axis.label} modules`,
      data: nodes
        .filter((n) => n.axis === axis.key)
        .map((n) => ({ x: n.x, y: n.y, id: n.id, degree: n.degree })),
      backgroundColor: axis.color,
      borderColor: t.pageBg,
      borderWidth: 1.5,
      pointRadius: (pointCtx) => 4 + ((pointCtx.raw.degree - minDegree) / degreeSpan) * 8,
      pointHoverRadius: (pointCtx) => 6 + ((pointCtx.raw.degree - minDegree) / degreeSpan) * 8,
    })),
  },
  options: {
    responsive: true,
    maintainAspectRatio: false,
    animation: false,
    layout: { padding: 24 },
    scales: {
      x: { type: "linear", min: -16, max: 16, display: false },
      // Hive geometry spans y ≈ -6.9..13.8 (axis angles 90/210/330), not
      // symmetric around 0 — an asymmetric domain centers the triangle
      // instead of leaving a blank third of the canvas below it.
      y: { type: "linear", min: -9, max: 15, display: false },
    },
    plugins: {
      title: {
        display: true,
        text: "hive-basic · javascript · chartjs · anyplot.ai",
        color: t.ink,
        font: { size: 22 },
        padding: { bottom: 20 },
      },
      legend: {
        position: "bottom",
        labels: { color: t.ink, font: { size: 16 }, usePointStyle: true },
      },
      tooltip: {
        callbacks: {
          label: (tooltipCtx) => `${tooltipCtx.raw.id} · degree ${tooltipCtx.raw.degree}`,
        },
      },
    },
  },
  plugins: [hiveGeometryPlugin],
});
Runnable source as JSON, for any HTTP client: https://api.anyplot.ai/specs/hive-basic/chartjs/code. Any spec id and library id listed in llms-full.txt fit the same URL shape; every URL below is complete and callable.
{
  "spec_id": "hive-basic",
  "language": "javascript",
  "library": "chartjs",
  "page": "https://anyplot.ai/hive-basic/javascript/chartjs",
  "hub": "https://anyplot.ai/hive-basic",
  "code_json": "https://api.anyplot.ai/specs/hive-basic/chartjs/code",
  "spec_json": "https://api.anyplot.ai/specs/hive-basic",
  "render_light_png": "https://storage.googleapis.com/anyplot-images/plots/hive-basic/javascript/chartjs/plot-light.png",
  "render_dark_png": "https://storage.googleapis.com/anyplot-images/plots/hive-basic/javascript/chartjs/plot-dark.png",
  "interactive_light_html": "https://storage.googleapis.com/anyplot-images/plots/hive-basic/javascript/chartjs/plot-light.html",
  "interactive_dark_html": "https://storage.googleapis.com/anyplot-images/plots/hive-basic/javascript/chartjs/plot-dark.html",
  "quality_score": 89.0,
  "license": "MIT",
  "guide": "https://anyplot.ai/llms.txt"
}
Part of Basic Hive Plot on anyplot.ai.