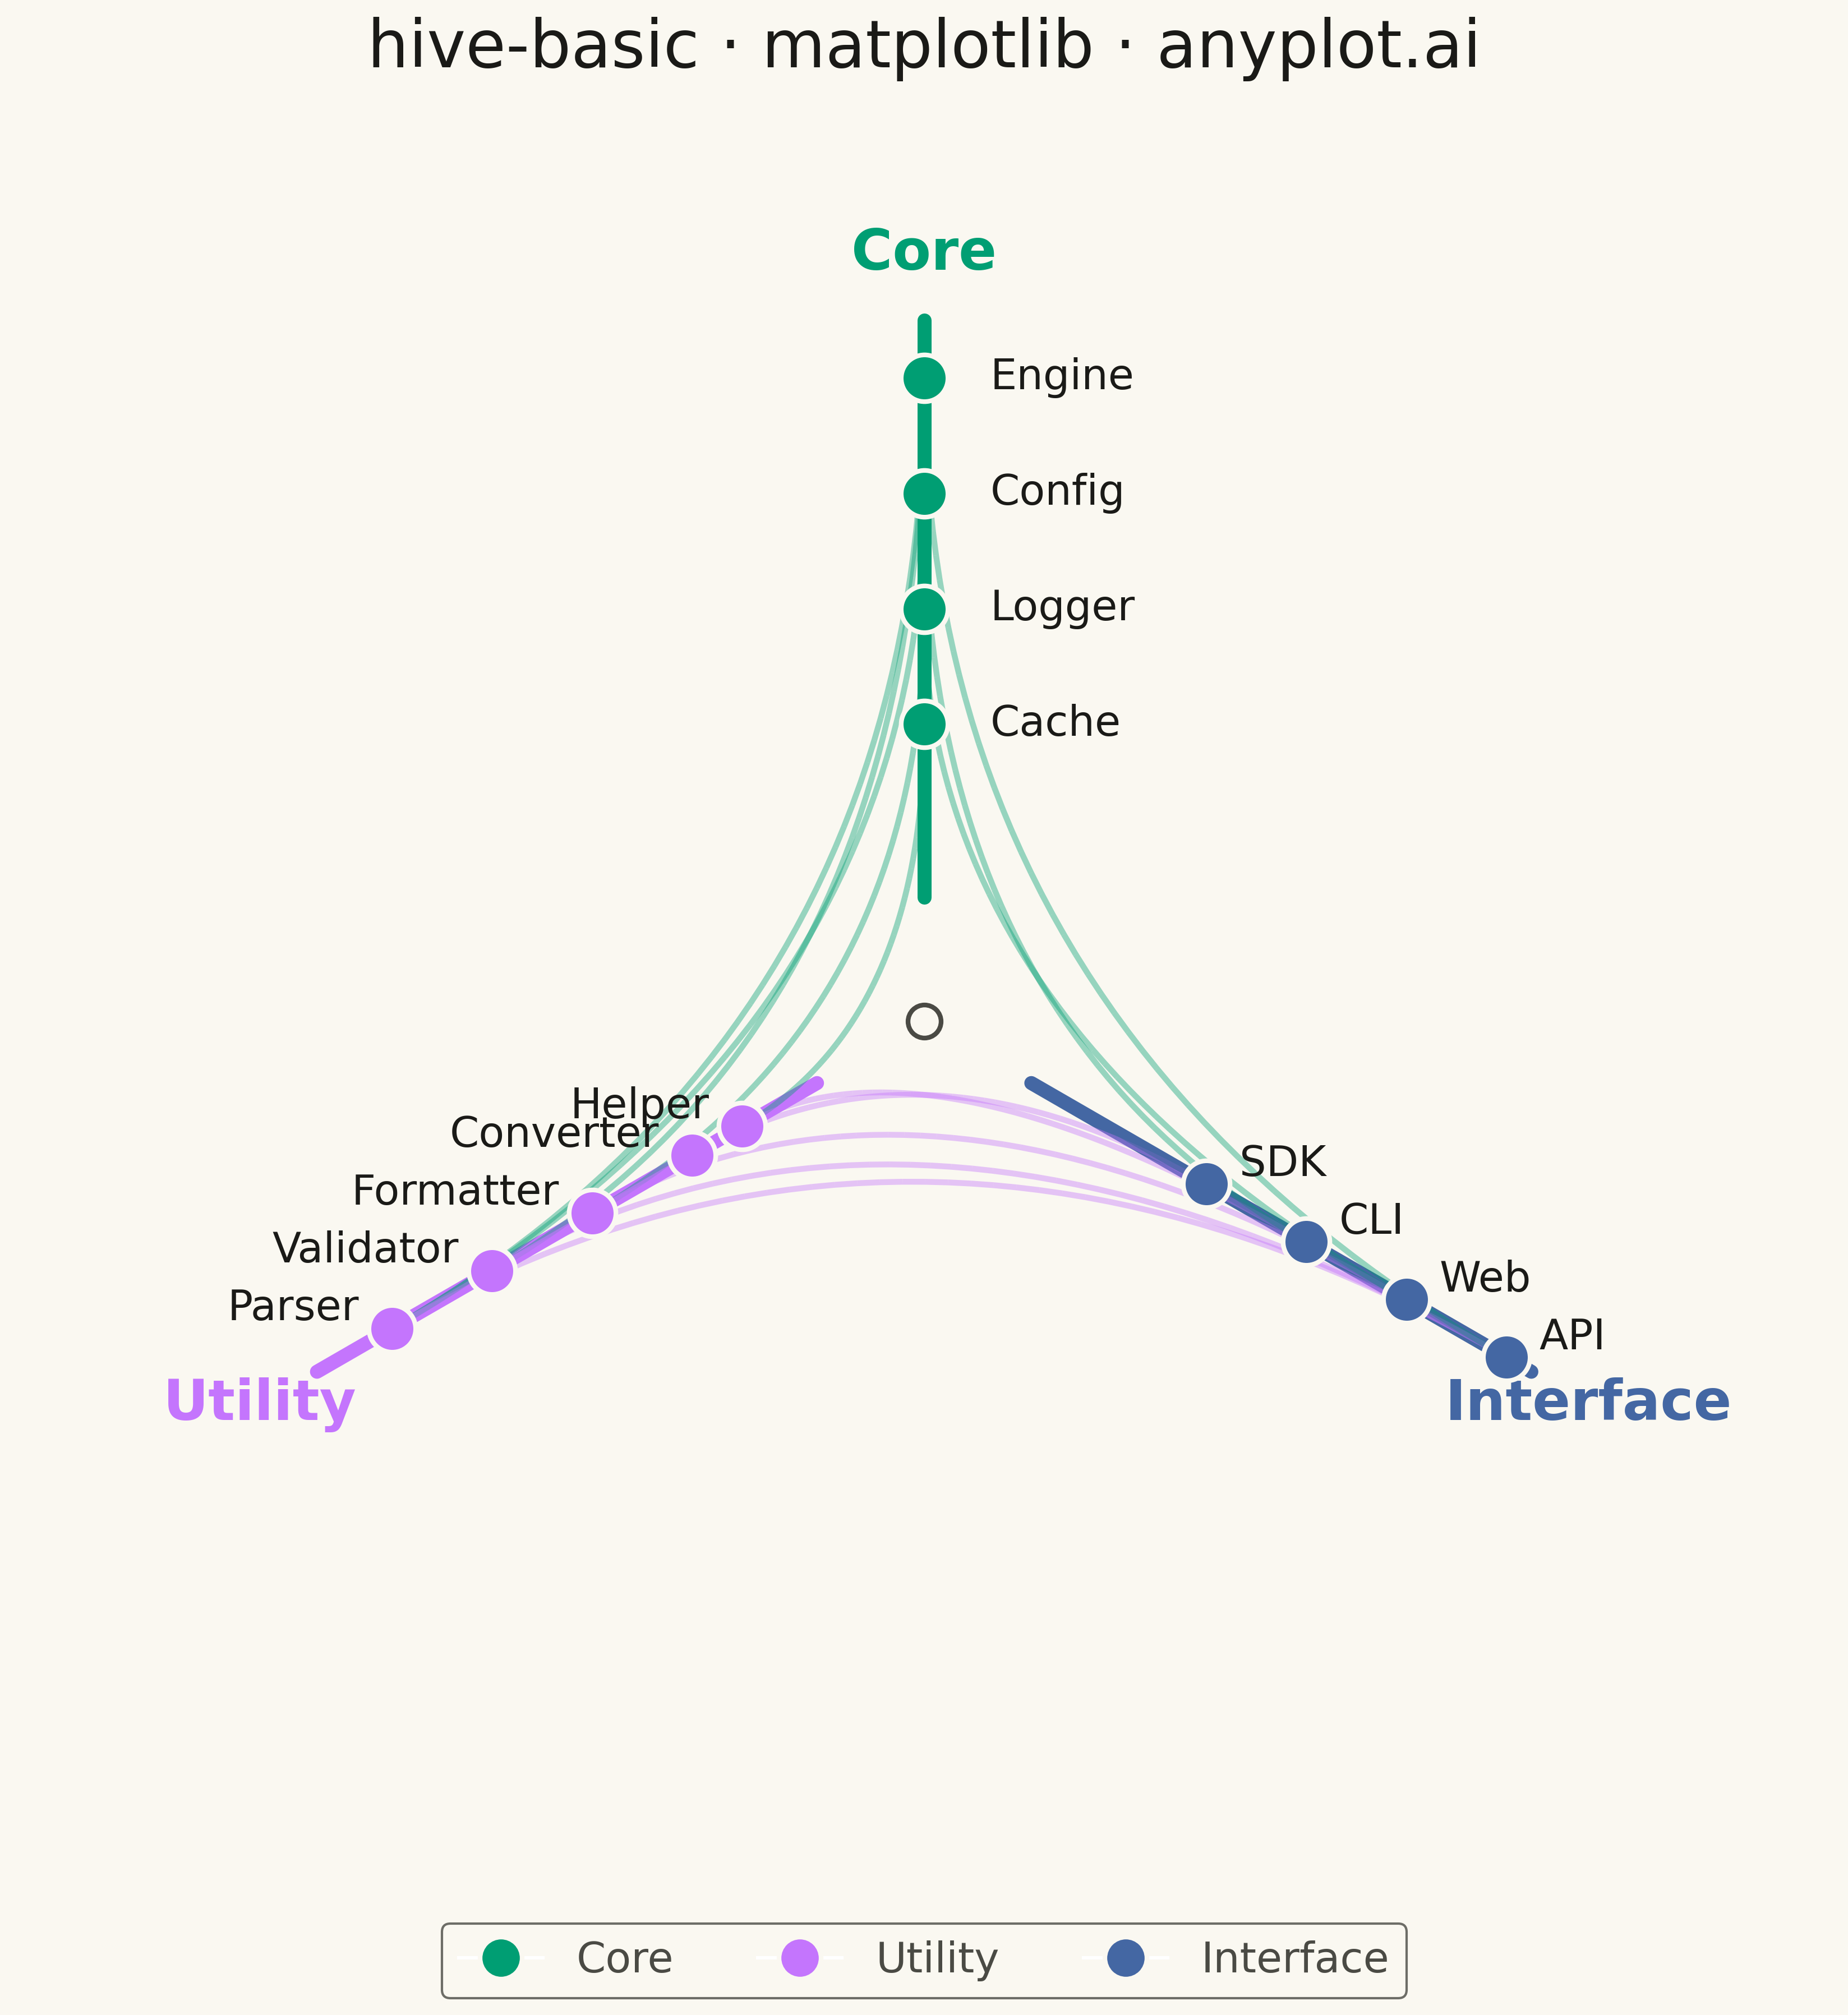
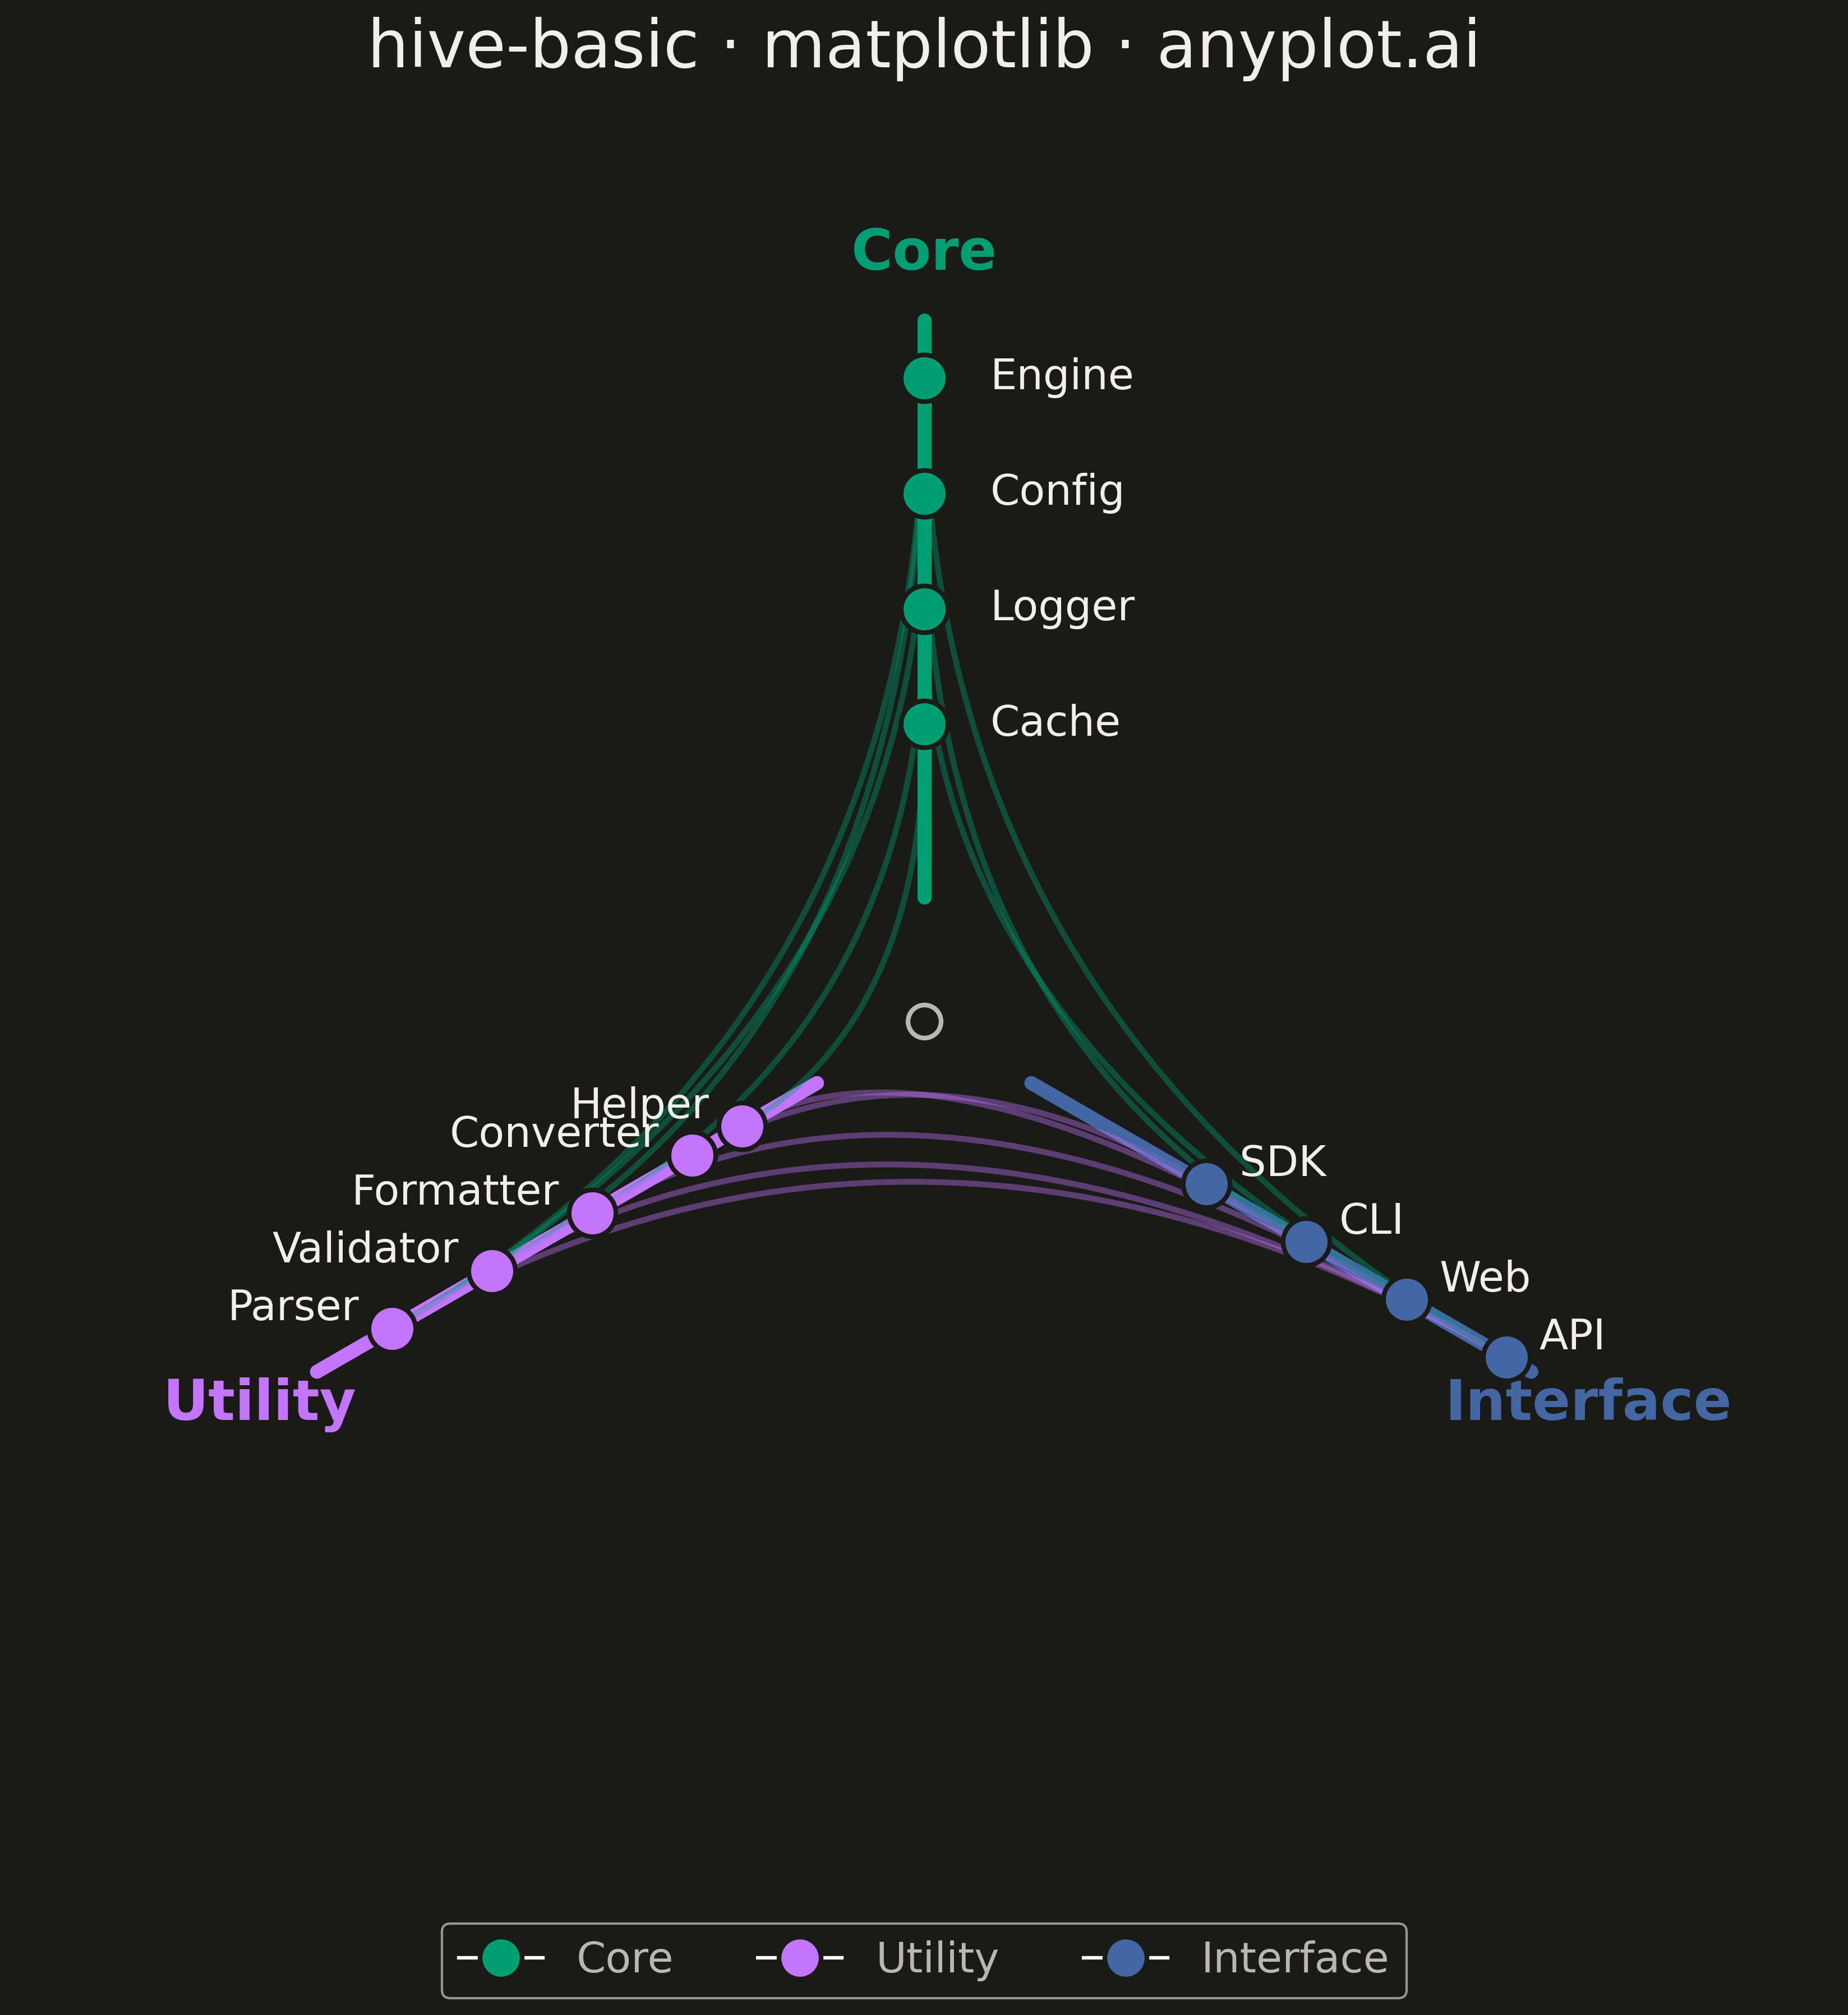
A hive plot arranges network nodes on radial axes based on node properties (such as degree, category, or other attributes), enabling reproducible and directly comparable network visualizations. Unlike force-directed layouts which can produce different arrangements for identical networks, hive plots always render the same network identically, solving the "hairball" problem of traditional network graphs and making structural comparisons reliable.
""" anyplot.ai
hive-basic: Basic Hive Plot
Library: matplotlib 3.10.9 | Python 3.13.13
Quality: 94/100 | Updated: 2026-05-07
"""

import os

import matplotlib.pyplot as plt
import numpy as np
from matplotlib.collections import LineCollection


# Theme tokens
THEME = os.getenv("ANYPLOT_THEME", "light")
PAGE_BG = "#FAF8F1" if THEME == "light" else "#1A1A17"
INK = "#1A1A17" if THEME == "light" else "#F0EFE8"
INK_SOFT = "#4A4A44" if THEME == "light" else "#B8B7B0"

# Okabe-Ito palette for axes (first 3 colors for 3 categories)
AXIS_COLORS = ["#009E73", "#C475FD", "#4467A3"]

# Create software module dependency network data
np.random.seed(42)
nodes = [
    # Core modules (axis 0)
    {"id": "core_engine", "axis": 0, "order": 0.9, "label": "Engine"},
    {"id": "core_config", "axis": 0, "order": 0.7, "label": "Config"},
    {"id": "core_logger", "axis": 0, "order": 0.5, "label": "Logger"},
    {"id": "core_cache", "axis": 0, "order": 0.3, "label": "Cache"},
    # Utility modules (axis 1)
    {"id": "util_parser", "axis": 1, "order": 0.85, "label": "Parser"},
    {"id": "util_validator", "axis": 1, "order": 0.65, "label": "Validator"},
    {"id": "util_formatter", "axis": 1, "order": 0.45, "label": "Formatter"},
    {"id": "util_converter", "axis": 1, "order": 0.25, "label": "Converter"},
    {"id": "util_helper", "axis": 1, "order": 0.15, "label": "Helper"},
    # Interface modules (axis 2)
    {"id": "iface_api", "axis": 2, "order": 0.95, "label": "API"},
    {"id": "iface_web", "axis": 2, "order": 0.75, "label": "Web"},
    {"id": "iface_cli", "axis": 2, "order": 0.55, "label": "CLI"},
    {"id": "iface_sdk", "axis": 2, "order": 0.35, "label": "SDK"},
]

node_lookup = {n["id"]: n for n in nodes}

# Dependencies between modules
edges = [
    ("core_engine", "util_parser"),
    ("core_engine", "util_validator"),
    ("core_config", "util_parser"),
    ("core_logger", "util_formatter"),
    ("core_cache", "util_helper"),
    ("util_parser", "iface_api"),
    ("util_validator", "iface_api"),
    ("util_formatter", "iface_web"),
    ("util_converter", "iface_sdk"),
    ("util_helper", "iface_cli"),
    ("core_engine", "iface_api"),
    ("core_config", "iface_cli"),
    ("core_logger", "iface_web"),
    ("core_engine", "core_config"),
    ("core_engine", "core_logger"),
    ("util_parser", "util_validator"),
    ("iface_api", "iface_sdk"),
]

# Hive plot configuration
n_axes = 3
axis_angles = [np.pi / 2 + i * 2 * np.pi / n_axes for i in range(n_axes)]
axis_labels = ["Core", "Utility", "Interface"]
inner_radius = 0.15
outer_radius = 0.85

# Plot
fig, ax = plt.subplots(figsize=(12, 12), facecolor=PAGE_BG)
ax.set_facecolor(PAGE_BG)

# Draw axes as thick lines
for i in range(n_axes):
    angle = axis_angles[i]
    x_inner = inner_radius * np.cos(angle)
    y_inner = inner_radius * np.sin(angle)
    x_outer = outer_radius * np.cos(angle)
    y_outer = outer_radius * np.sin(angle)

    ax.plot([x_inner, x_outer], [y_inner, y_outer], color=AXIS_COLORS[i], linewidth=6, solid_capstyle="round", zorder=1)

    label_r = outer_radius + 0.08
    label_x = label_r * np.cos(angle)
    label_y = label_r * np.sin(angle)
    ax.text(
        label_x, label_y, axis_labels[i], fontsize=24, fontweight="bold", ha="center", va="center", color=AXIS_COLORS[i]
    )

# Draw edges as curved bezier curves
edge_lines = []
edge_colors = []

for source_id, target_id in edges:
    source = node_lookup[source_id]
    target = node_lookup[target_id]

    angle1 = axis_angles[source["axis"]]
    r1 = inner_radius + source["order"] * (outer_radius - inner_radius)
    x1 = r1 * np.cos(angle1)
    y1 = r1 * np.sin(angle1)

    angle2 = axis_angles[target["axis"]]
    r2 = inner_radius + target["order"] * (outer_radius - inner_radius)
    x2 = r2 * np.cos(angle2)
    y2 = r2 * np.sin(angle2)

    # Create bezier curve through center
    t = np.linspace(0, 1, 50)
    curve_x = (1 - t) ** 2 * x1 + 2 * (1 - t) * t * 0 + t**2 * x2
    curve_y = (1 - t) ** 2 * y1 + 2 * (1 - t) * t * 0 + t**2 * y2

    points = np.column_stack([curve_x, curve_y])
    segments = np.array([points[:-1], points[1:]]).transpose(1, 0, 2)
    edge_lines.extend(segments)
    edge_colors.extend([AXIS_COLORS[source["axis"]]] * len(segments))

lc = LineCollection(edge_lines, colors=edge_colors, linewidths=2.5, alpha=0.4, zorder=2)
ax.add_collection(lc)

# Draw nodes
for node in nodes:
    angle = axis_angles[node["axis"]]
    r = inner_radius + node["order"] * (outer_radius - inner_radius)
    x = r * np.cos(angle)
    y = r * np.sin(angle)
    color = AXIS_COLORS[node["axis"]]

    ax.scatter(x, y, s=400, c=color, edgecolors=PAGE_BG, linewidths=2, zorder=3)

    # Add node label with offset based on axis position
    offset_dist = 0.08
    if node["axis"] == 0:
        ha = "left"
        label_x = x + offset_dist
        label_y = y
    elif node["axis"] == 1:
        ha = "right"
        label_x = x - offset_dist * 0.5
        label_y = y + offset_dist * 0.3
    else:
        ha = "left"
        label_x = x + offset_dist * 0.5
        label_y = y + offset_dist * 0.3

    ax.text(label_x, label_y, node["label"], fontsize=18, ha=ha, va="center", color=INK)

# Draw center point
ax.scatter(0, 0, s=200, c=PAGE_BG, edgecolors=INK_SOFT, linewidths=2, zorder=4)

# Styling
ax.set_xlim(-1.1, 1.1)
ax.set_ylim(-1.1, 1.1)
ax.set_aspect("equal")
ax.axis("off")

# Title
ax.set_title("hive-basic · matplotlib · anyplot.ai", fontsize=28, fontweight="medium", color=INK, pad=20)

# Legend
legend_elements = [
    plt.Line2D(
        [0],
        [0],
        marker="o",
        color="w",
        markerfacecolor=AXIS_COLORS[i],
        markersize=18,
        markeredgecolor=PAGE_BG,
        markeredgewidth=2,
        label=axis_labels[i],
    )
    for i in range(n_axes)
]
leg = ax.legend(
    handles=legend_elements, loc="lower center", fontsize=18, frameon=True, ncol=3, bbox_to_anchor=(0.5, -0.05)
)
if leg:
    leg.get_frame().set_facecolor(PAGE_BG)
    leg.get_frame().set_edgecolor(INK_SOFT)
    plt.setp(leg.get_texts(), color=INK_SOFT)

plt.tight_layout()
plt.savefig(f"plot-{THEME}.png", dpi=300, bbox_inches="tight", facecolor=PAGE_BG)
Runnable source as JSON, for any HTTP client: https://api.anyplot.ai/specs/hive-basic/matplotlib/code. Any spec id and library id listed in llms-full.txt fit the same URL shape; every URL below is complete and callable.
{
  "spec_id": "hive-basic",
  "language": "python",
  "library": "matplotlib",
  "page": "https://anyplot.ai/hive-basic/python/matplotlib",
  "hub": "https://anyplot.ai/hive-basic",
  "code_json": "https://api.anyplot.ai/specs/hive-basic/matplotlib/code",
  "spec_json": "https://api.anyplot.ai/specs/hive-basic",
  "render_light_png": "https://storage.googleapis.com/anyplot-images/plots/hive-basic/python/matplotlib/plot-light.png",
  "render_dark_png": "https://storage.googleapis.com/anyplot-images/plots/hive-basic/python/matplotlib/plot-dark.png",
  "quality_score": 94.0,
  "license": "MIT",
  "guide": "https://anyplot.ai/llms.txt"
}
Part of Basic Hive Plot on anyplot.ai.