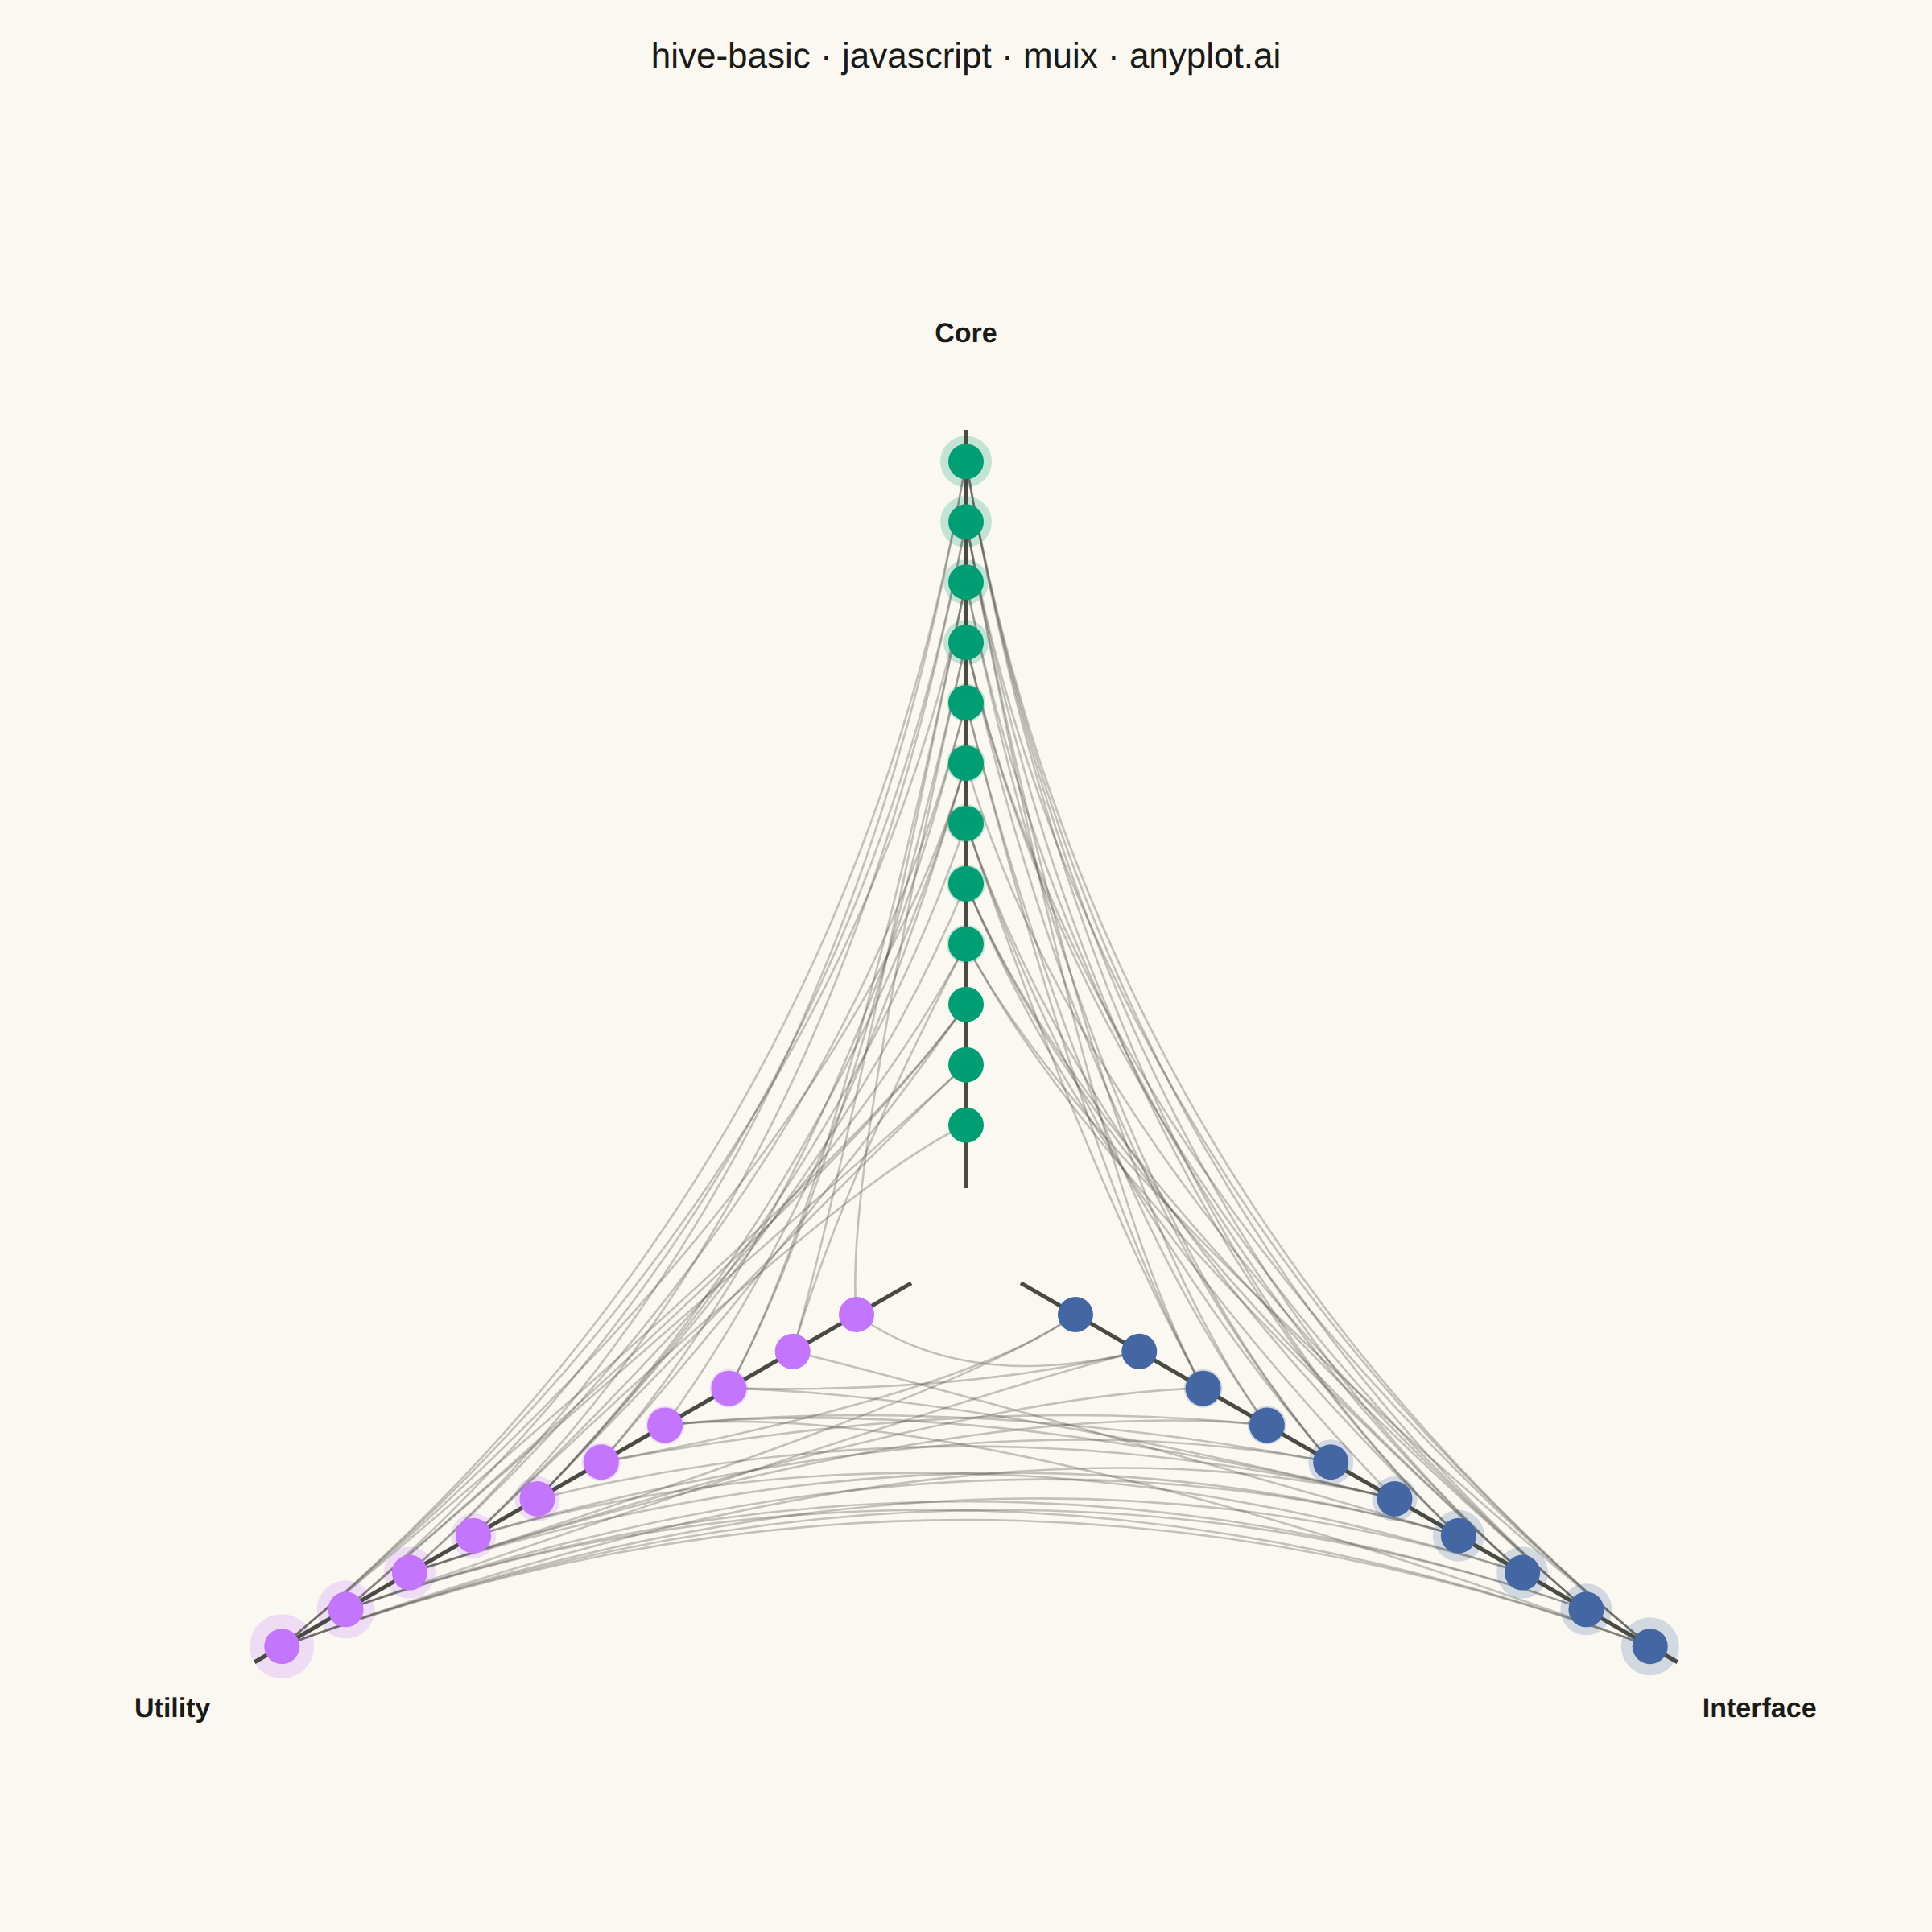
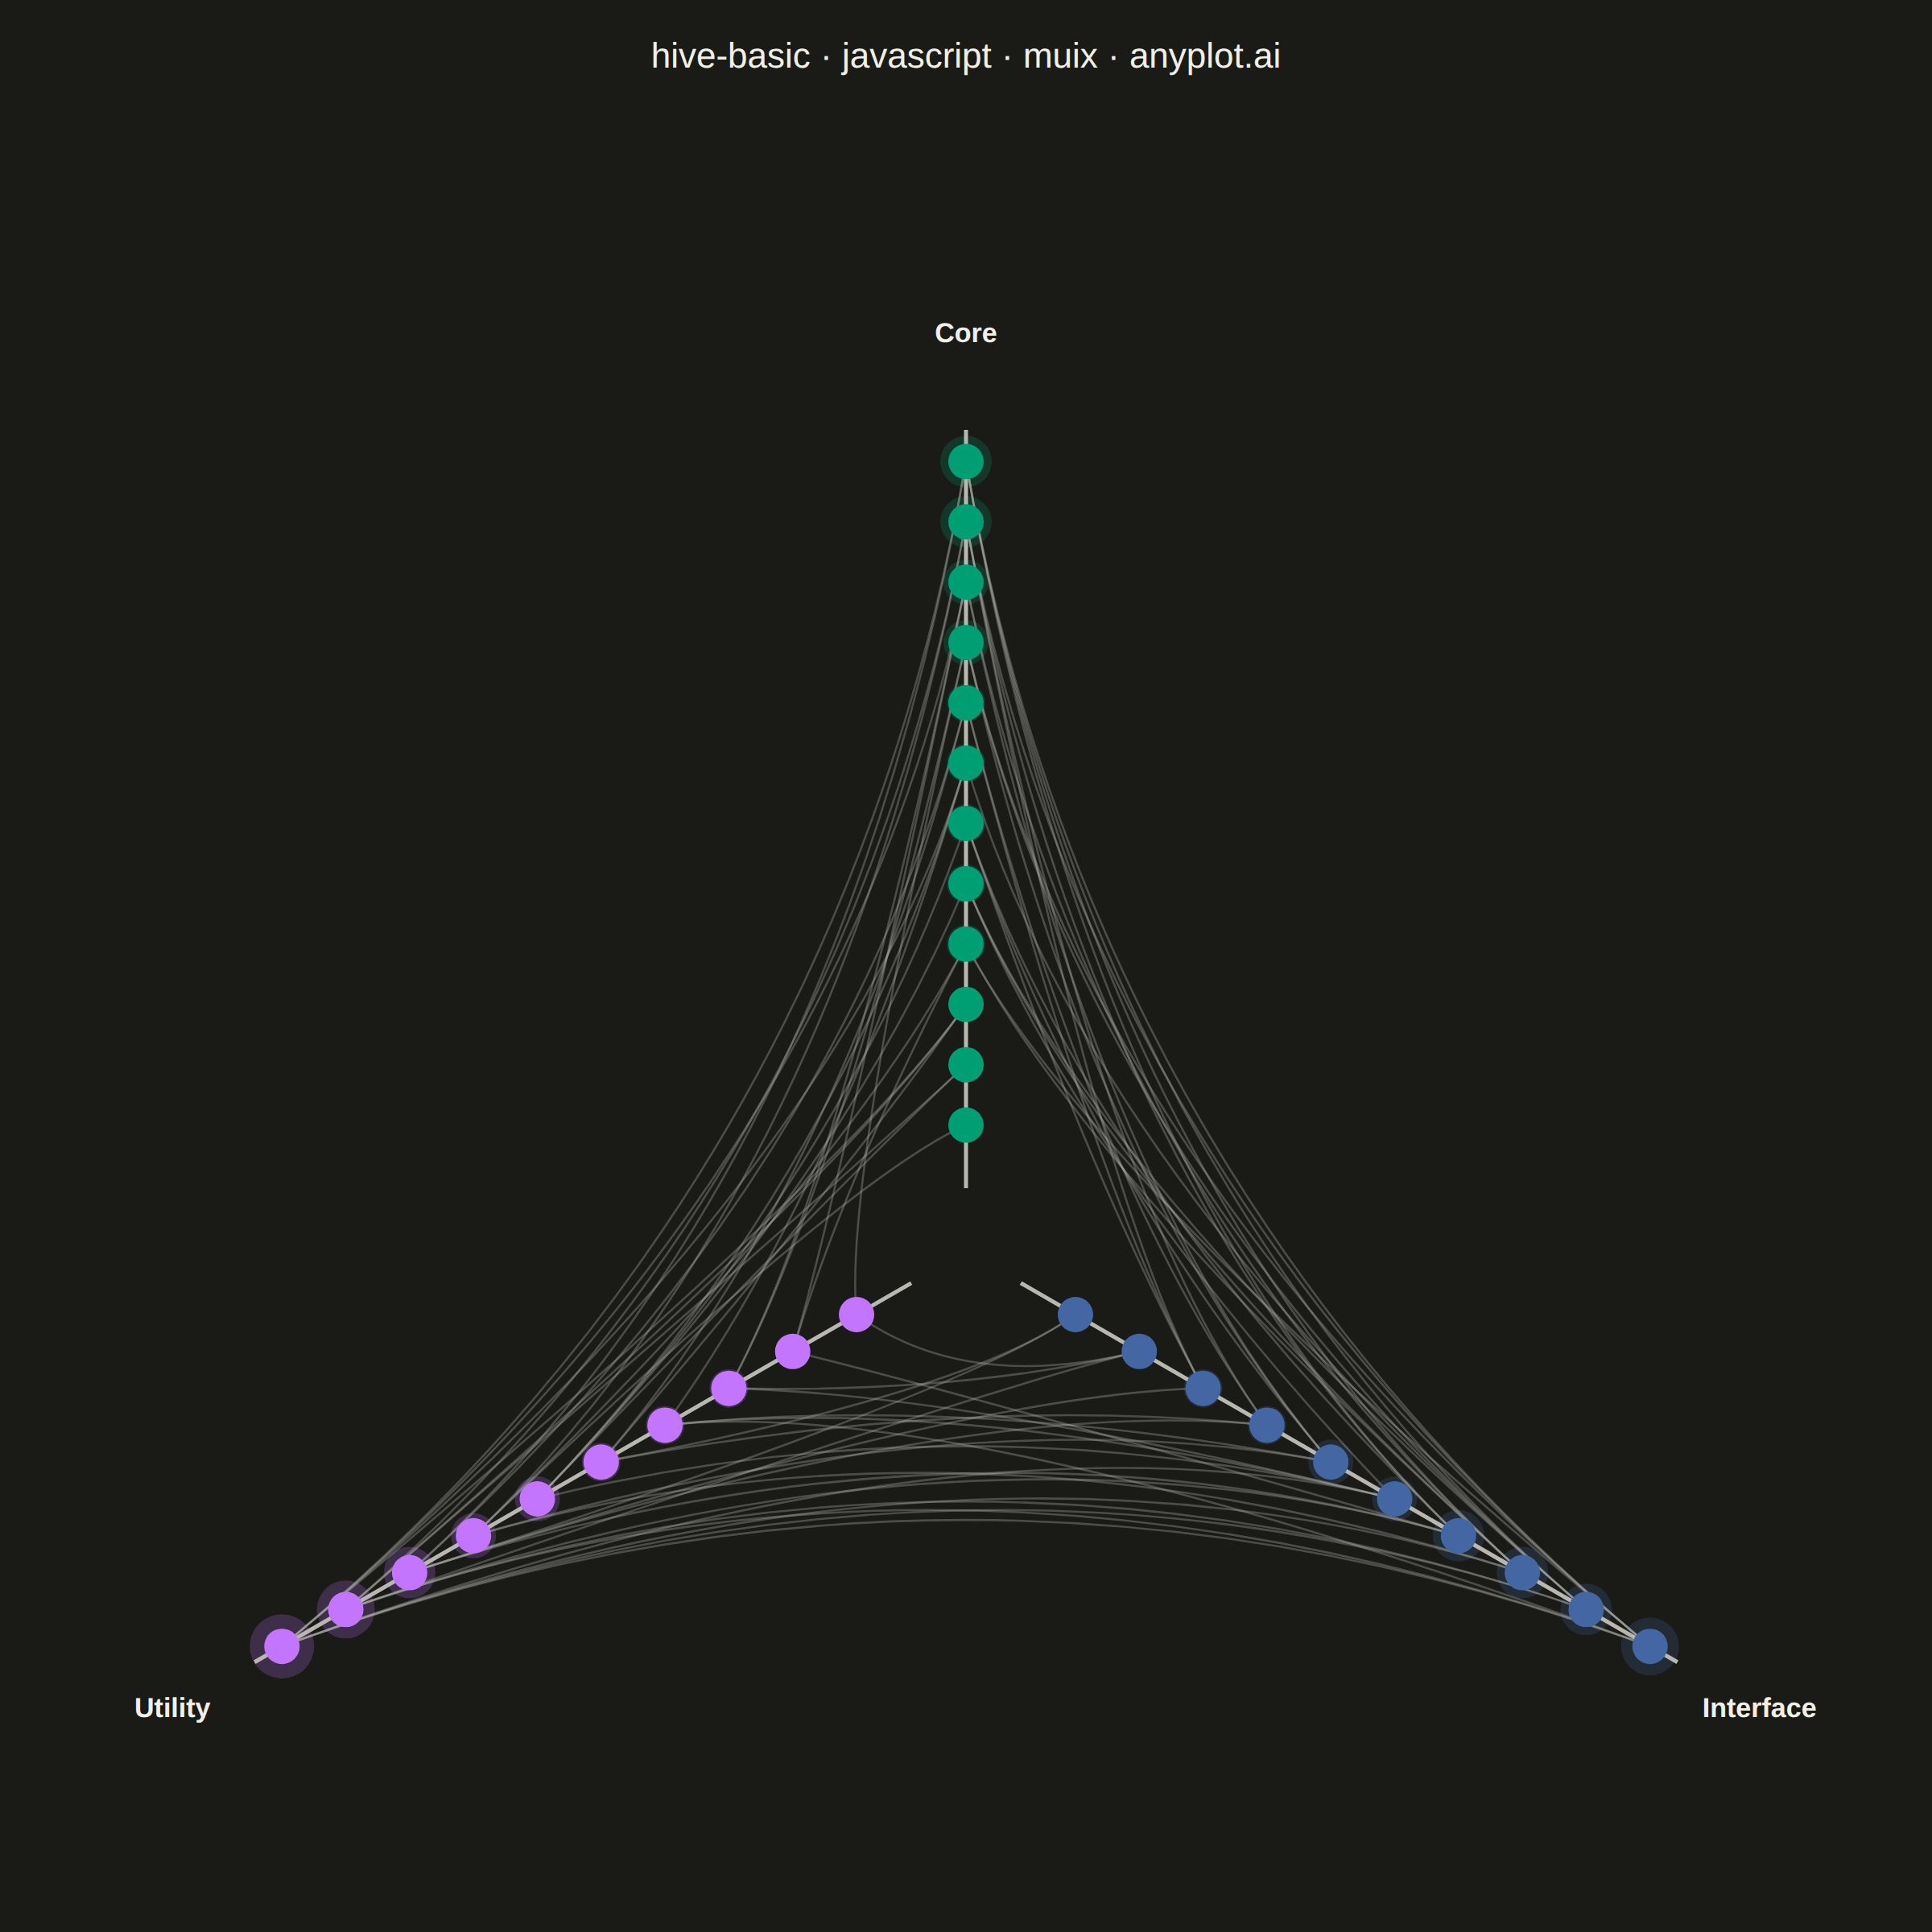
The same plot in 14 other libraries — JavaScript: Chart.js, D3.js, Apache ECharts, Highcharts; Python: Altair, Bokeh, lets-plot, Matplotlib, Plotly, plotnine, Pygal, Seaborn; R: ggplot2; Julia: Makie.jl. Compare all 15 side by side: Basic Hive Plot in Python, R, Julia and JavaScript.
A hive plot arranges network nodes on radial axes based on node properties (such as degree, category, or other attributes), enabling reproducible and directly comparable network visualizations. Unlike force-directed layouts which can produce different arrangements for identical networks, hive plots always render the same network identically, solving the "hairball" problem of traditional network graphs and making structural comparisons reliable.
// anyplot.ai
// hive-basic: Basic Hive Plot
// Library: muix 7.29.1 | JavaScript 22.23.2
// Quality: 92/100 | Created: 2026-09-05
//# anyplot-orientation: square
// anyplot.ai
// hive-basic: Basic Hive Plot
// Library: MUI X Charts | React | Node 22
// License: @mui/x-charts — MIT (community). Pro/Premium are out of scope.
// Quality: pending | Created: 2026-09-05
import { ChartContainer } from "@mui/x-charts/ChartContainer";
import { ScatterPlot } from "@mui/x-charts/ScatterChart";
import { useXScale, useYScale } from "@mui/x-charts/hooks";

const t = window.ANYPLOT_TOKENS;

// --- Deterministic PRNG (the browser has no seeded Math.random) -------------
function createLcg(seed) {
  let state = seed >>> 0;
  return () => {
    state = (Math.imul(state, 1664525) + 1013904223) >>> 0;
    return state / 4294967296;
  };
}
const random = createLcg(42);

// --- Network: a software-module dependency graph, nodes grouped onto 3 hive
// axes by module type. A hive plot's whole point is a reproducible, fixed
// layout — position never depends on a force simulation. ---------------------
const AXES = [
  { id: "core", label: "Core", angle: 90, count: 12 },
  { id: "utility", label: "Utility", angle: 210, count: 10 },
  { id: "interface", label: "Interface", angle: 330, count: 10 },
];

const nodesByAxis = {};
AXES.forEach((axis) => {
  nodesByAxis[axis.id] = Array.from({ length: axis.count }, (_, i) => ({
    id: `${axis.id}-${i}`,
    axis: axis.id,
    degree: 0,
  }));
});
const allNodes = AXES.flatMap((axis) => nodesByAxis[axis.id]);
const nodesById = Object.fromEntries(allNodes.map((n) => [n.id, n]));

// Dependencies only cross axes (core<->utility, utility<->interface,
// interface<->core) — comparing how edges route between groups is the
// structural point of a hive plot, so same-axis edges are omitted.
const AXIS_PAIRS = [
  ["core", "utility"],
  ["utility", "interface"],
  ["interface", "core"],
];
const EDGES_PER_PAIR = 24;

const edgeKeys = new Set();
const edges = [];
AXIS_PAIRS.forEach(([a, b]) => {
  let added = 0;
  let attempts = 0;
  while (added < EDGES_PER_PAIR && attempts < EDGES_PER_PAIR * 6) {
    attempts += 1;
    const source = nodesByAxis[a][Math.floor(random() * nodesByAxis[a].length)];
    const target = nodesByAxis[b][Math.floor(random() * nodesByAxis[b].length)];
    const key = `${source.id}|${target.id}`;
    if (edgeKeys.has(key)) continue;
    edgeKeys.add(key);
    edges.push({ source: source.id, target: target.id });
    source.degree += 1;
    target.degree += 1;
    added += 1;
  }
});

// --- Radial layout: position along each axis encodes node degree (fewer
// dependencies near the hub, heavily-depended-on modules pushed to the rim) --
const INNER_R = 16;
const OUTER_R = 100;
const CONTROL_R = 18; // edge curves bow through a small radius near the hub

function polarToXY(angleDeg, radius) {
  const rad = (angleDeg * Math.PI) / 180;
  return { x: radius * Math.cos(rad), y: radius * Math.sin(rad) };
}

// Bisecting angle for the short arc between each pair of axes — where edge
// curves bow toward, so they read as gentle strands instead of straight
// chords cutting through the hub.
const CONTROL_ANGLE = { "core|utility": 150, "utility|interface": 270, "interface|core": 30 };
function controlAngleFor(axisA, axisB) {
  return CONTROL_ANGLE[`${axisA}|${axisB}`] ?? CONTROL_ANGLE[`${axisB}|${axisA}`];
}

AXES.forEach((axis) => {
  const ordered = [...nodesByAxis[axis.id]].sort((a, b) => a.degree - b.degree);
  ordered.forEach((node, i) => {
    const r = ordered.length > 1 ? INNER_R + (i / (ordered.length - 1)) * (OUTER_R - INNER_R) : OUTER_R;
    const { x, y } = polarToXY(axis.angle, r);
    node.x = x;
    node.y = y;
  });
});

// --- Chart geometry ----------------------------------------------------------
const TITLE = "hive-basic · javascript · muix · anyplot.ai";
const TITLE_HEIGHT = 70;

// The 3-axis star is vertically lopsided (the Core spoke points straight up
// while Utility/Interface point down-left/down-right) and wider than it is
// tall. Center the domain on the content's own bounding box, using a
// *separate* half-span per axis so each hugs its own content tightly — then
// give the plot area that same width:height ratio (below) so the
// pixel-per-unit mapping stays equal on both axes (required for undistorted
// angles) without padding the shorter axis out to match the longer one.
const LABEL_R = OUTER_R * 1.16;
const TOP_Y = LABEL_R; // Core points at 90°, sin(90°) = 1
const BOTTOM_Y = LABEL_R * Math.sin((210 * Math.PI) / 180); // Utility/Interface, negative
const SIDE_X = LABEL_R * Math.cos((330 * Math.PI) / 180); // symmetric left/right extent
const CONTENT_Y_CENTER = (TOP_Y + BOTTOM_Y) / 2;
const PAD = 1.12; // clearance for label text extending past its anchor point
const X_HALF_SPAN = SIDE_X * PAD;
const Y_HALF_SPAN = ((TOP_Y - BOTTOM_Y) / 2) * PAD;
const X_MIN = -X_HALF_SPAN;
const X_MAX = X_HALF_SPAN;
const Y_MIN = CONTENT_Y_CENTER - Y_HALF_SPAN;
const Y_MAX = CONTENT_Y_CENTER + Y_HALF_SPAN;

// Fit the widest possible plot area of ratio X_HALF_SPAN:Y_HALF_SPAN inside
// the canvas (minus a flat outer-margin floor), then split the leftover
// canvas space evenly as margin on whichever pair of sides has slack.
const MIN_MARGIN = 48;
const FRAME_W = window.ANYPLOT_SIZE.width;
const FRAME_H = window.ANYPLOT_SIZE.height - TITLE_HEIGHT;
const domainRatio = X_HALF_SPAN / Y_HALF_SPAN;
const innerW = FRAME_W - 2 * MIN_MARGIN;
const innerH = FRAME_H - 2 * MIN_MARGIN;
const plotW = innerW / innerH > domainRatio ? innerH * domainRatio : innerW;
const plotH = innerW / innerH > domainRatio ? innerH : innerW / domainRatio;
const MARGIN = {
  top: (FRAME_H - plotH) / 2,
  bottom: (FRAME_H - plotH) / 2,
  left: (FRAME_W - plotW) / 2,
  right: (FRAME_W - plotW) / 2,
};

const AXIS_INDEX = Object.fromEntries(AXES.map((axis, i) => [axis.id, i]));

// Degree-based halo behind each marker reinforces the radial ordering: nodes
// pushed to the rim (higher degree) get a visibly larger glow than nodes near
// the hub, so the encoded property reads at a glance instead of only through
// position.
const degrees = allNodes.map((n) => n.degree);
const MIN_DEGREE = Math.min(...degrees);
const MAX_DEGREE = Math.max(...degrees);
const HALO_MIN_PX = 6;
const HALO_MAX_PX = 20;
function haloRadiusFor(node) {
  if (MAX_DEGREE === MIN_DEGREE) return (HALO_MIN_PX + HALO_MAX_PX) / 2;
  const frac = (node.degree - MIN_DEGREE) / (MAX_DEGREE - MIN_DEGREE);
  return HALO_MIN_PX + frac * (HALO_MAX_PX - HALO_MIN_PX);
}

// --- Custom overlay: axis spokes, category labels, and edge curves. Community
// `@mui/x-charts/hooks` (useXScale/useYScale) map the hand-computed polar
// layout into the same pixel space the ScatterPlot markers use, so hubs,
// spokes and edges stay aligned at any render size. --------------------------
function HiveGeometry() {
  const xScale = useXScale();
  const yScale = useYScale();
  const toPx = (p) => ({ x: xScale(p.x), y: yScale(p.y) });

  return (
    <g>
      {allNodes.map((node) => {
        const p = toPx(node);
        return (
          <circle
            key={`halo-${node.id}`}
            cx={p.x}
            cy={p.y}
            r={haloRadiusFor(node)}
            fill={t.palette[AXIS_INDEX[node.axis]]}
            fillOpacity={0.22}
          />
        );
      })}
      {edges.map((edge, i) => {
        const source = nodesById[edge.source];
        const target = nodesById[edge.target];
        const control = polarToXY(controlAngleFor(source.axis, target.axis), CONTROL_R);
        const p1 = toPx(source);
        const p2 = toPx(target);
        const c = toPx(control);
        return (
          <path
            key={i}
            d={`M ${p1.x} ${p1.y} Q ${c.x} ${c.y} ${p2.x} ${p2.y}`}
            fill="none"
            stroke={t.inkSoft}
            strokeOpacity={0.32}
            strokeWidth={1.3}
          />
        );
      })}
      {AXES.map((axis) => {
        const hub = toPx(polarToXY(axis.angle, INNER_R * 0.5));
        const rim = toPx(polarToXY(axis.angle, OUTER_R * 1.04));
        const labelPt = toPx(polarToXY(axis.angle, OUTER_R * 1.16));
        return (
          <g key={axis.id}>
            <line x1={hub.x} y1={hub.y} x2={rim.x} y2={rim.y} stroke={t.inkSoft} strokeWidth={2.5} />
            <text
              x={labelPt.x}
              y={labelPt.y}
              fill={t.ink}
              fontSize={17}
              fontWeight={600}
              textAnchor="middle"
              dominantBaseline="middle"
            >
              {axis.label}
            </text>
          </g>
        );
      })}
    </g>
  );
}

// --- Chart (default-exported component — the harness mounts it) -------------
export default function Chart() {
  return (
    <div
      style={{
        width: window.ANYPLOT_SIZE.width,
        height: window.ANYPLOT_SIZE.height,
        display: "flex",
        flexDirection: "column",
      }}
    >
      <div
        style={{
          height: TITLE_HEIGHT,
          display: "flex",
          alignItems: "center",
          justifyContent: "center",
          fontSize: 22,
          fontWeight: 500,
          color: t.ink,
        }}
      >
        {TITLE}
      </div>
      <ChartContainer
        width={window.ANYPLOT_SIZE.width}
        height={window.ANYPLOT_SIZE.height - TITLE_HEIGHT}
        margin={MARGIN}
        skipAnimation
        xAxis={[{ scaleType: "linear", min: X_MIN, max: X_MAX }]}
        yAxis={[{ scaleType: "linear", min: Y_MIN, max: Y_MAX }]}
        series={AXES.map((axis) => ({
          type: "scatter",
          id: axis.id,
          label: axis.label,
          color: t.palette[AXIS_INDEX[axis.id]],
          markerSize: 11,
          data: nodesByAxis[axis.id].map((n) => ({ x: n.x, y: n.y, id: n.id })),
        }))}
      >
        <HiveGeometry />
        <ScatterPlot />
      </ChartContainer>
    </div>
  );
}
Runnable source as JSON, for any HTTP client: https://api.anyplot.ai/specs/hive-basic/muix/code. Any spec id and library id listed in llms-full.txt fit the same URL shape; every URL below is complete and callable.
{
  "spec_id": "hive-basic",
  "language": "javascript",
  "library": "muix",
  "page": "https://anyplot.ai/hive-basic/javascript/muix",
  "hub": "https://anyplot.ai/hive-basic",
  "code_json": "https://api.anyplot.ai/specs/hive-basic/muix/code",
  "spec_json": "https://api.anyplot.ai/specs/hive-basic",
  "render_light_png": "https://storage.googleapis.com/anyplot-images/plots/hive-basic/javascript/muix/plot-light.png",
  "render_dark_png": "https://storage.googleapis.com/anyplot-images/plots/hive-basic/javascript/muix/plot-dark.png",
  "interactive_light_html": "https://storage.googleapis.com/anyplot-images/plots/hive-basic/javascript/muix/plot-light.html",
  "interactive_dark_html": "https://storage.googleapis.com/anyplot-images/plots/hive-basic/javascript/muix/plot-dark.html",
  "quality_score": 92.0,
  "license": "MIT",
  "guide": "https://anyplot.ai/llms.txt"
}
Part of Basic Hive Plot on anyplot.ai.