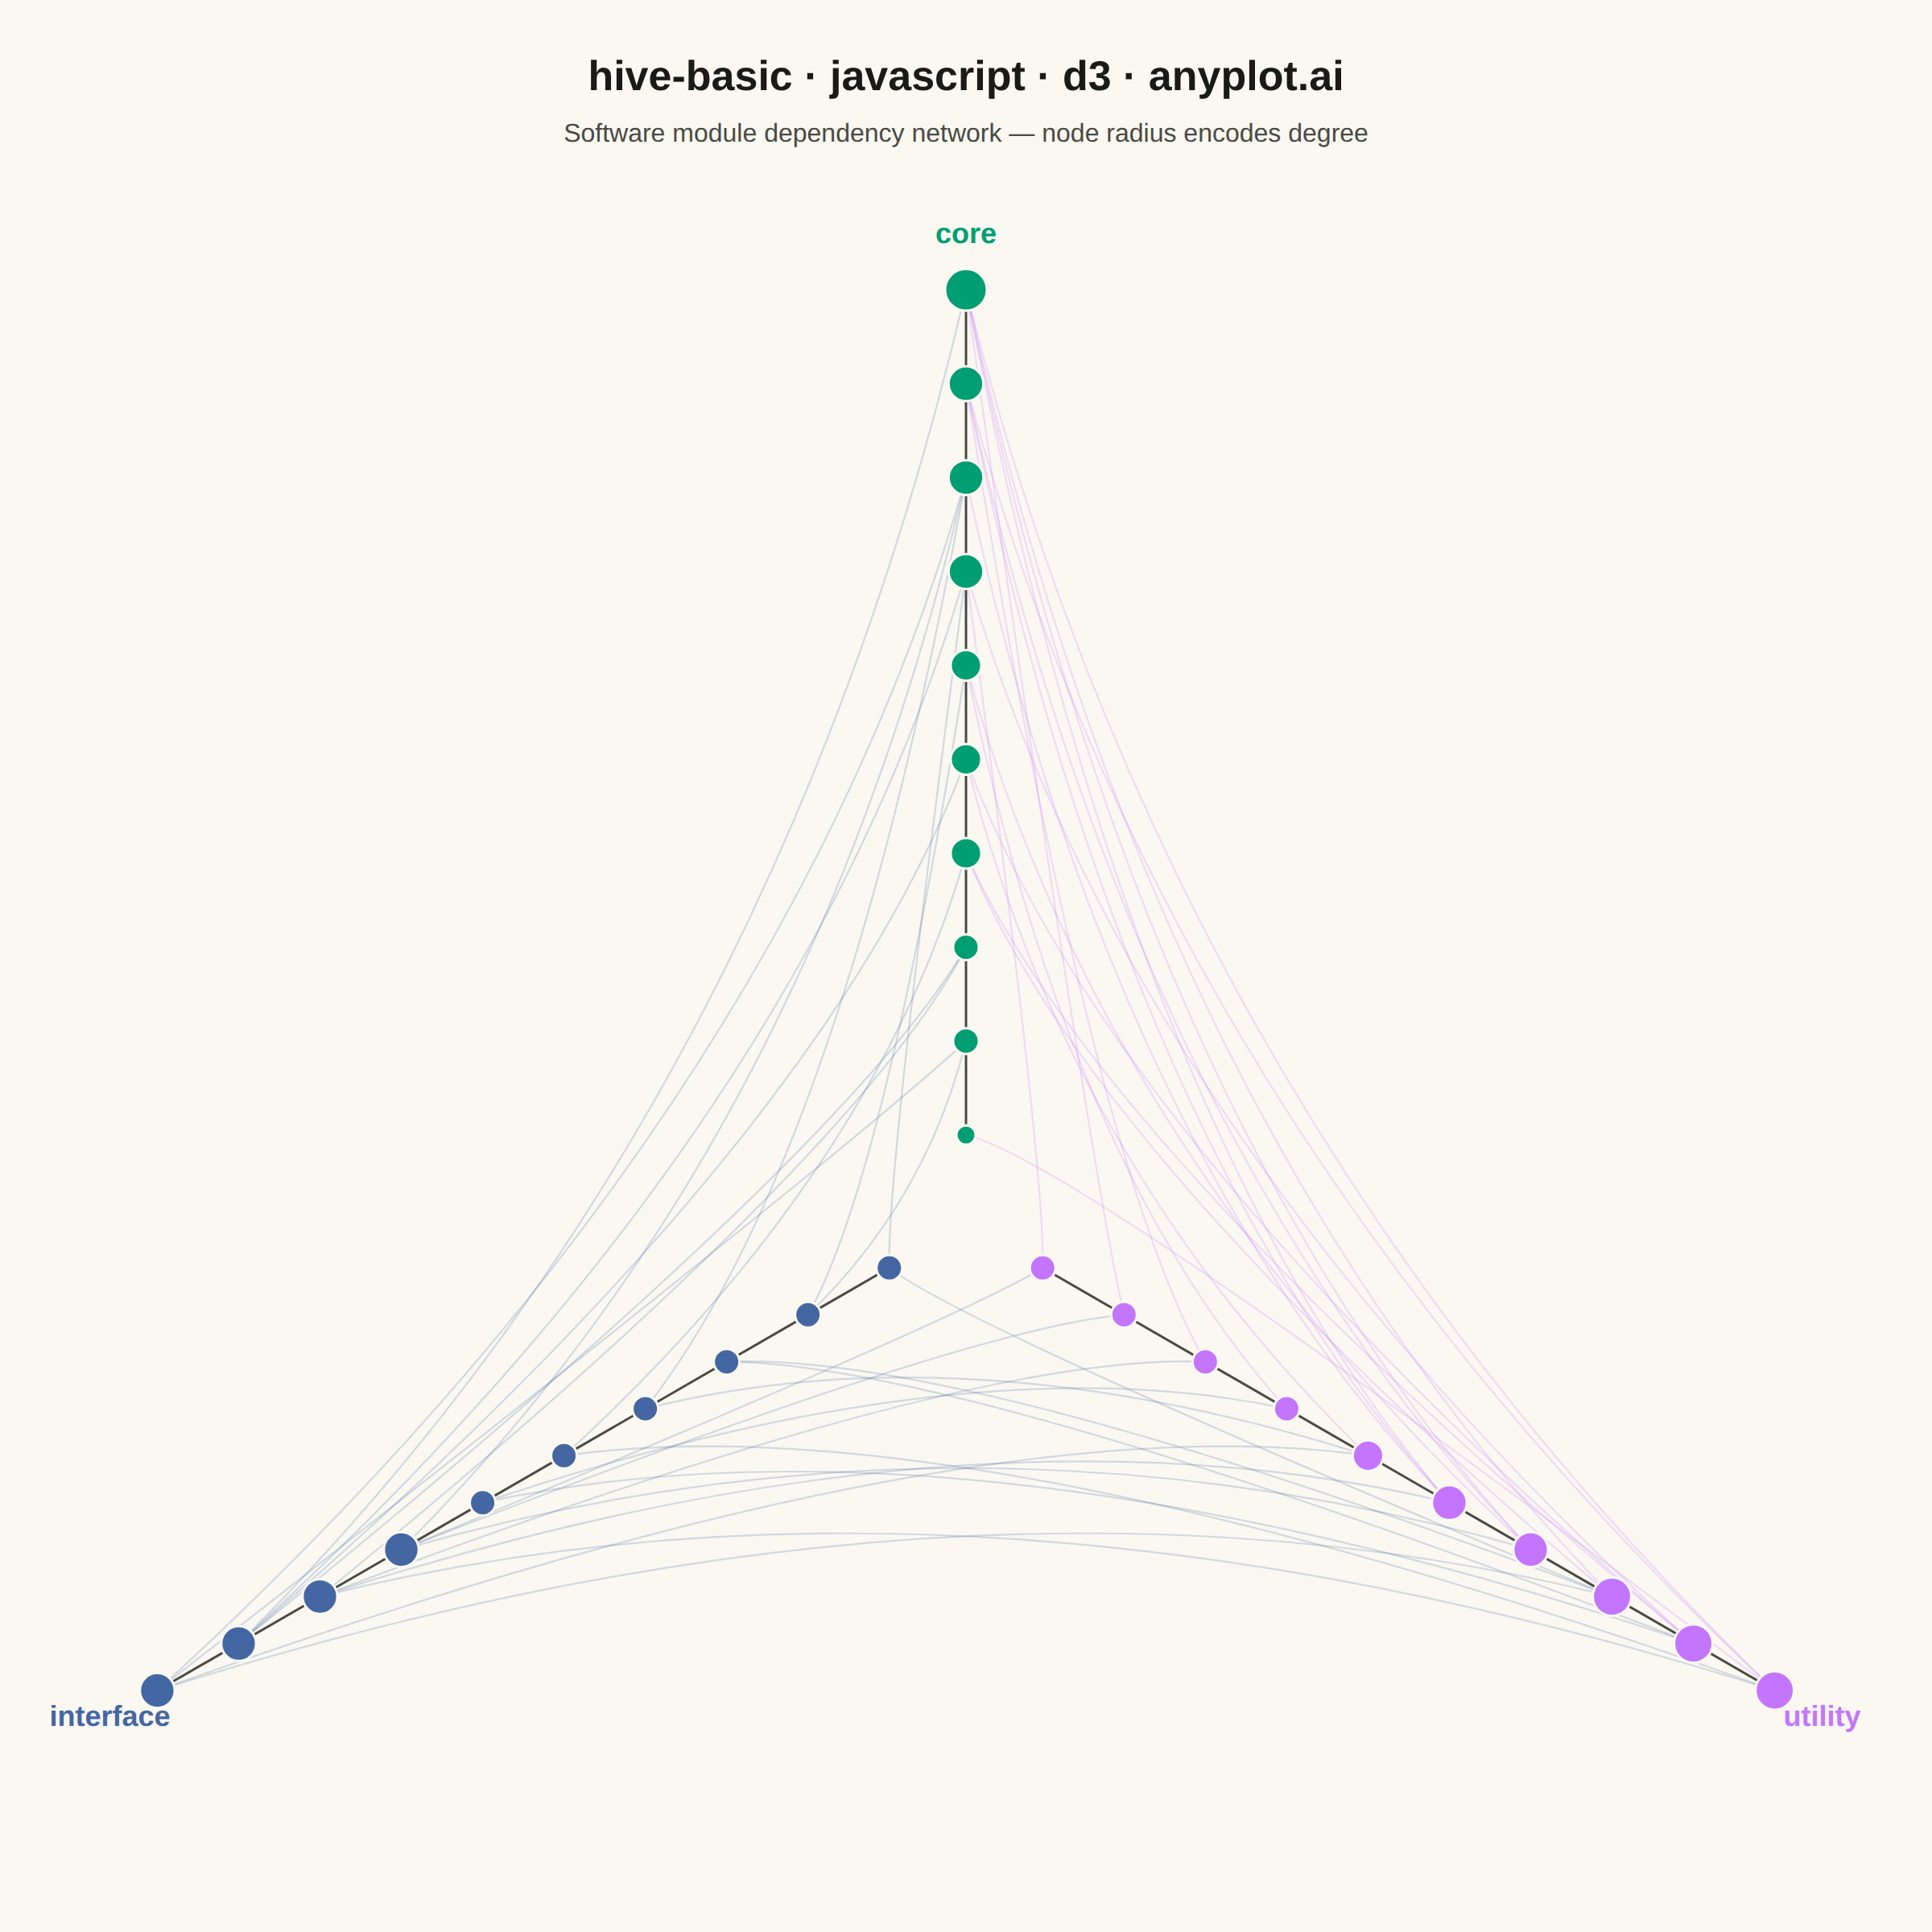
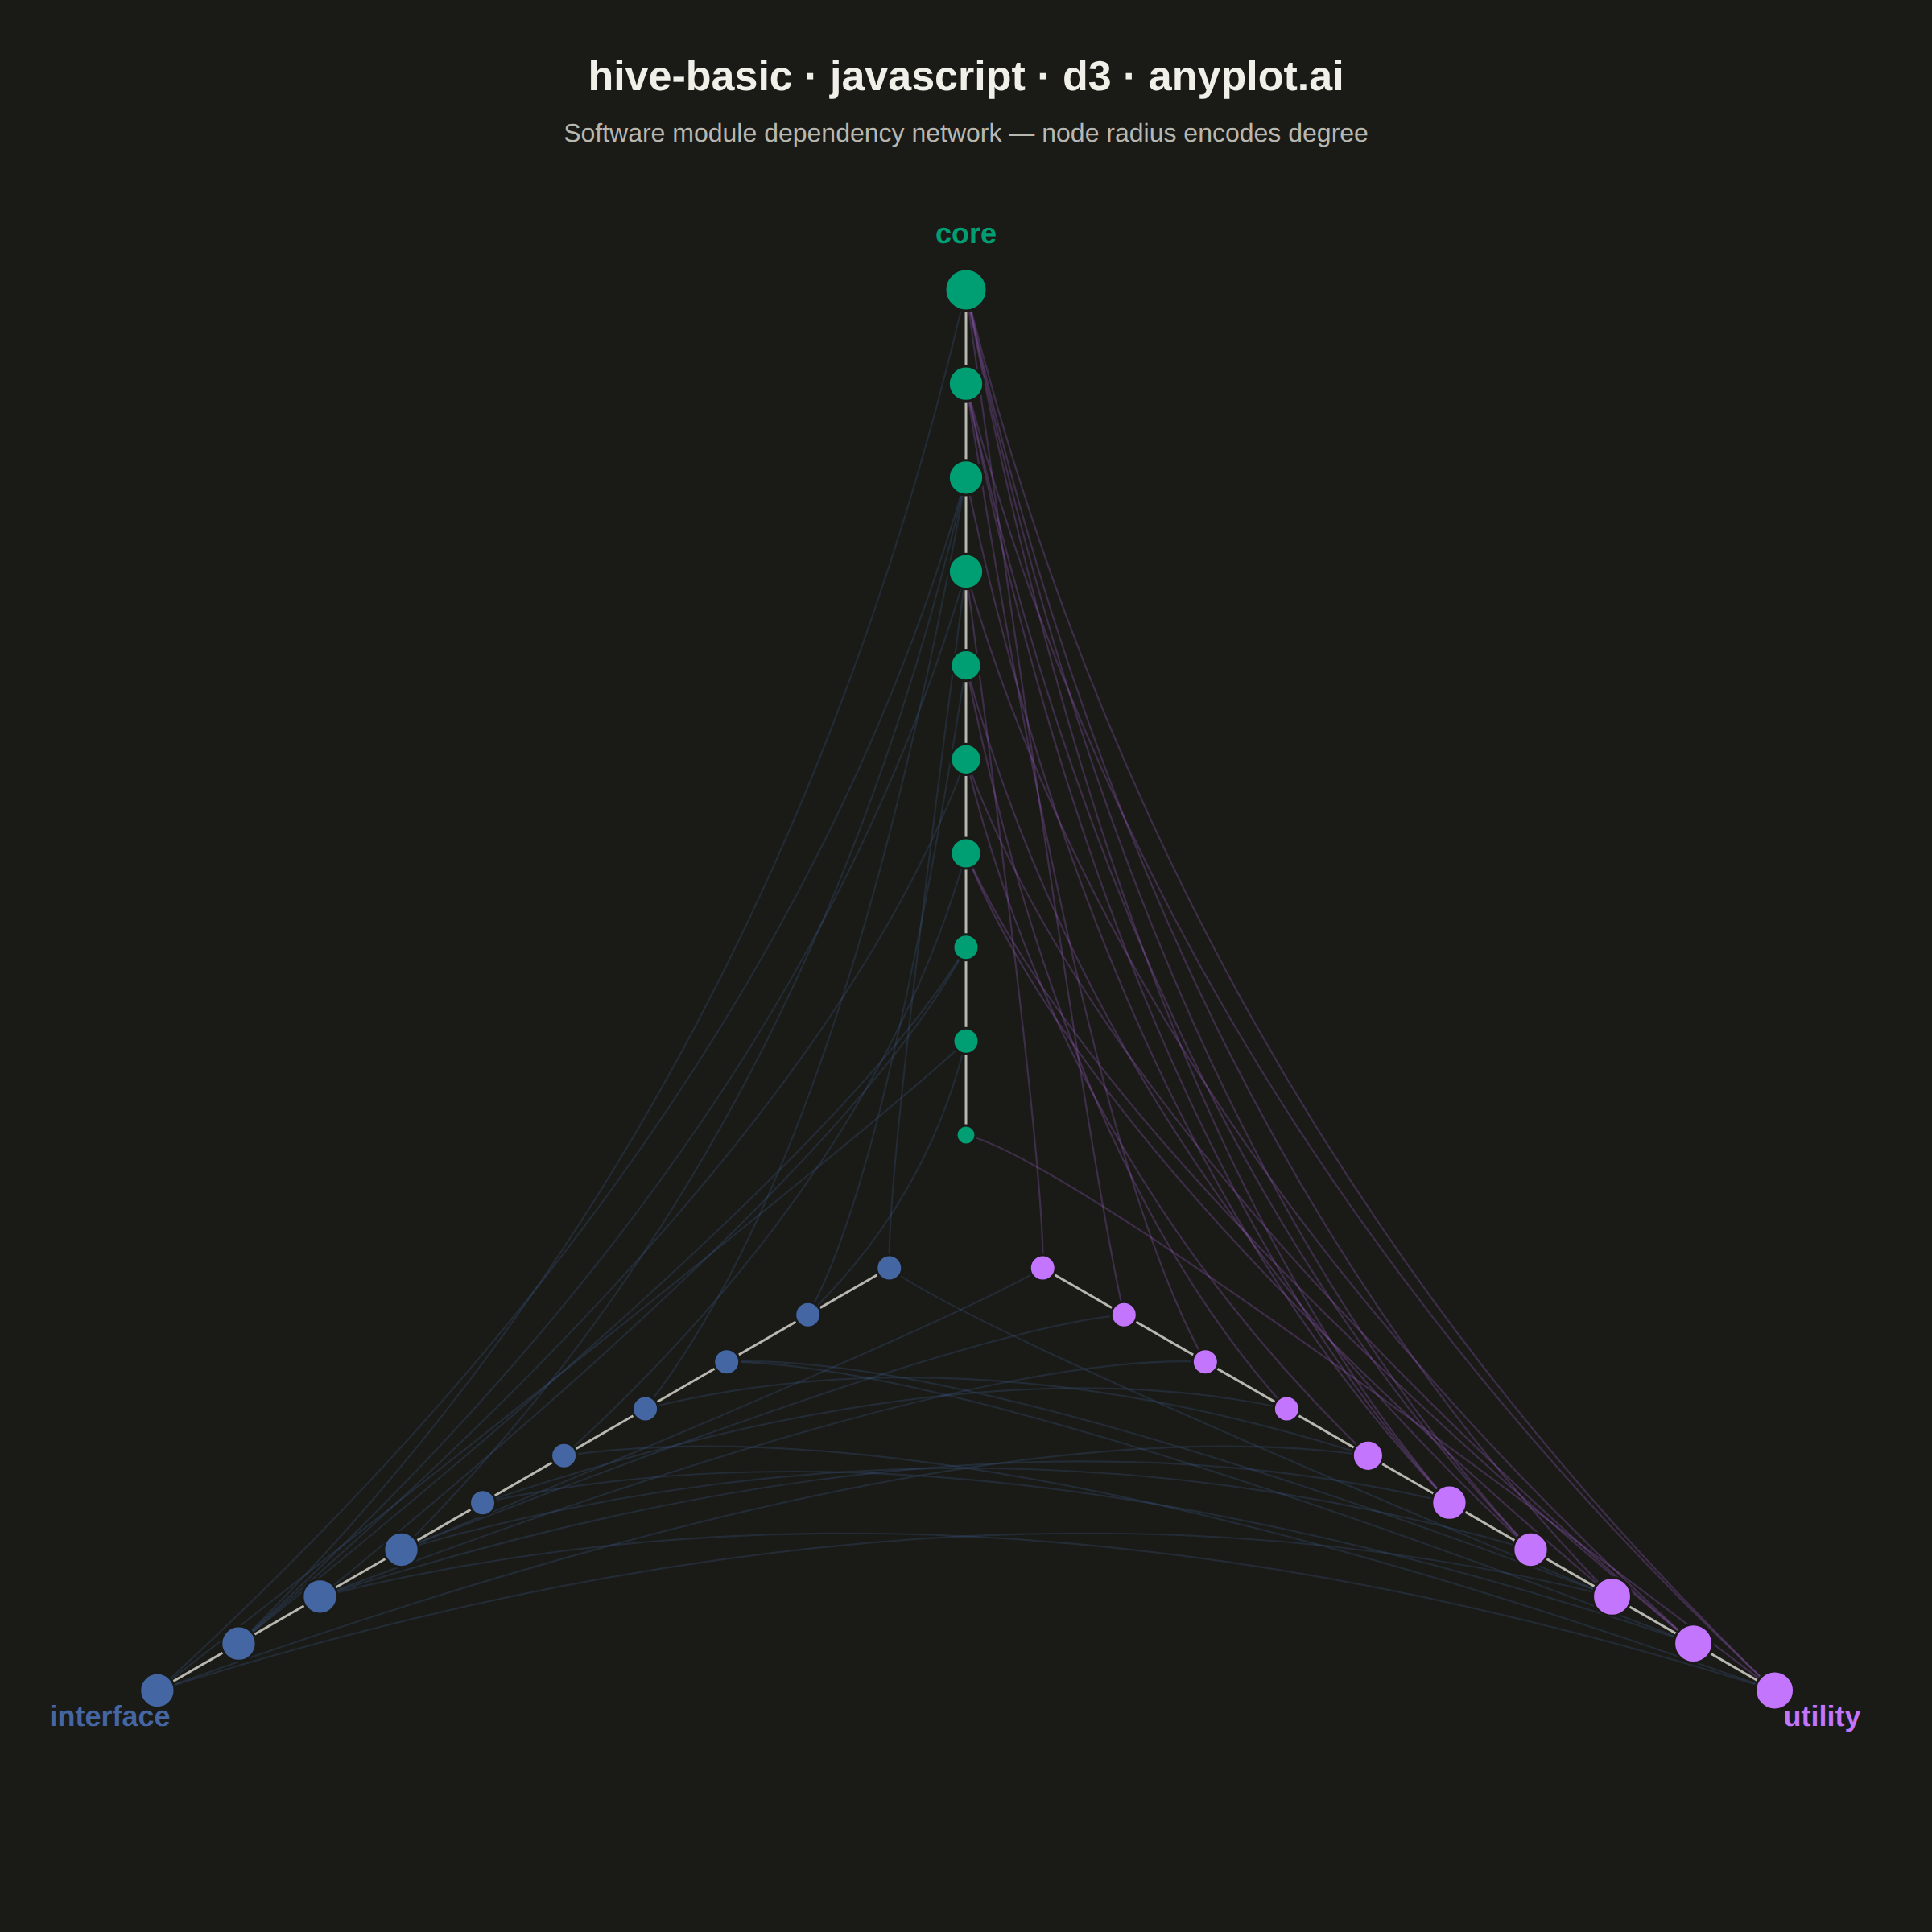
The same plot in 14 other libraries — JavaScript: Chart.js, Apache ECharts, Highcharts, MUI X Charts; Python: Altair, Bokeh, lets-plot, Matplotlib, Plotly, plotnine, Pygal, Seaborn; R: ggplot2; Julia: Makie.jl. Compare all 15 side by side: Basic Hive Plot in Python, R, Julia and JavaScript.
A hive plot arranges network nodes on radial axes based on node properties (such as degree, category, or other attributes), enabling reproducible and directly comparable network visualizations. Unlike force-directed layouts which can produce different arrangements for identical networks, hive plots always render the same network identically, solving the "hairball" problem of traditional network graphs and making structural comparisons reliable.
// anyplot.ai
// hive-basic: Basic Hive Plot
// Library: d3 7.9.0 | JavaScript 22.23.2
// Quality: 85/100 | Created: 2026-09-05

//# anyplot-orientation: square

const t = window.ANYPLOT_TOKENS;
const { width, height } = window.ANYPLOT_SIZE;

// --- Data: software module dependency network -------------------------------
// Three axes group modules by architectural layer. Edges run strictly from a
// higher layer to a lower one (interface -> utility -> core), so every edge
// crosses axes — the standard hive-plot convention of never linking two nodes
// on the same axis.
const AXES = [
  {
    key: "core",
    label: "core",
    modules: [
      "kernel", "scheduler", "memory-mgr", "io-driver", "syscall",
      "bootloader", "filesystem", "network-stack", "process-mgr", "device-mgr",
    ],
  },
  {
    key: "utility",
    label: "utility",
    modules: [
      "logger", "config", "string-utils", "math-utils", "json-parser",
      "compressor", "validator", "cache", "serializer", "metrics",
    ],
  },
  {
    key: "interface",
    label: "interface",
    modules: [
      "rest-api", "grpc-service", "cli", "websocket", "auth-gateway",
      "admin-ui", "webhook", "graphql", "sdk-client", "plugin-api",
    ],
  },
];

// Fixed-seed LCG — Math.random() is not reproducible.
const lcg = (seed) => {
  let s = seed;
  return () => {
    s = (s * 1664525 + 1013904223) % 4294967296;
    return s / 4294967296;
  };
};
const rand = lcg(42);
const randInt = (min, max) => min + Math.floor(rand() * (max - min + 1));
const sample = (arr, n) => {
  const pool = [...arr];
  const picked = [];
  for (let i = 0; i < n && pool.length > 0; i++) {
    picked.push(pool.splice(Math.floor(rand() * pool.length), 1)[0]);
  }
  return picked;
};

const nodes = AXES.flatMap((axis) =>
  axis.modules.map((name) => ({ id: `${axis.key}:${name}`, name, axis: axis.key }))
);
const coreIds = AXES[0].modules.map((m) => `core:${m}`);
const utilityIds = AXES[1].modules.map((m) => `utility:${m}`);
const interfaceIds = AXES[2].modules.map((m) => `interface:${m}`);

const edges = [];
for (const id of utilityIds) {
  for (const target of sample(coreIds, randInt(1, 3))) edges.push({ source: id, target });
}
for (const id of interfaceIds) {
  const pool = [...coreIds, ...utilityIds];
  for (const target of sample(pool, randInt(2, 4))) edges.push({ source: id, target });
}

const degree = new Map(nodes.map((n) => [n.id, 0]));
for (const e of edges) {
  degree.set(e.source, degree.get(e.source) + 1);
  degree.set(e.target, degree.get(e.target) + 1);
}

// --- Layout -------------------------------------------------------------------
// Geometry tuned for the 1200x1200 square mount: the "core" axis points up,
// the other two point down-left/down-right, so the triangle is taller above
// its center than below — cy is pulled down from the mount's midpoint, but
// only slightly, so the single upward axis still starts close under the
// subtitle instead of leaving a dead gap across the top of the canvas.
const cx = width / 2;
const cy = 760;
const innerR = 55;
const outerR = 580;

const axisAngle = (i) => -Math.PI / 2 + i * ((2 * Math.PI) / 3);
const axisColor = d3.scaleOrdinal().domain(AXES.map((a) => a.key)).range(t.palette);
const radiusScale = d3.scaleSqrt().domain([1, d3.max([...degree.values()])]).range([6, 13]);

const nodePos = new Map();
AXES.forEach((axis, i) => {
  const angle = axisAngle(i);
  const axisNodes = nodes
    .filter((n) => n.axis === axis.key)
    .sort((a, b) => degree.get(a.id) - degree.get(b.id));
  const place = d3.scaleLinear().domain([0, axisNodes.length - 1]).range([innerR, outerR]);
  axisNodes.forEach((n, rank) => {
    const r = place(rank);
    nodePos.set(n.id, {
      x: cx + r * Math.cos(angle),
      y: cy + r * Math.sin(angle),
      r,
      angle,
      color: axisColor(axis.key),
    });
  });
});

// --- SVG mount ------------------------------------------------------------
const svg = d3.select("#container").append("svg").attr("width", width).attr("height", height);

// --- Edges: quadratic curves bulging toward the center (hive-plot bundling) -
const edgeLayer = svg.append("g").attr("fill", "none");
edgeLayer
  .selectAll("path")
  .data(edges)
  .join("path")
  .attr("d", (e) => {
    const s = nodePos.get(e.source);
    const t2 = nodePos.get(e.target);
    const ux = Math.cos(s.angle) + Math.cos(t2.angle);
    const uy = Math.sin(s.angle) + Math.sin(t2.angle);
    const len = Math.hypot(ux, uy) || 1;
    const controlR = ((s.r + t2.r) / 2) * 0.25;
    const qx = cx + (ux / len) * controlR;
    const qy = cy + (uy / len) * controlR;
    return `M${s.x},${s.y} Q${qx},${qy} ${t2.x},${t2.y}`;
  })
  .attr("stroke", (e) => nodePos.get(e.source).color)
  .attr("stroke-width", 1.1)
  .attr("stroke-opacity", 0.22);

// --- Axes -------------------------------------------------------------------
const axisLayer = svg.append("g");
AXES.forEach((axis, i) => {
  const angle = axisAngle(i);
  const x1 = cx + innerR * Math.cos(angle);
  const y1 = cy + innerR * Math.sin(angle);
  const x2 = cx + outerR * Math.cos(angle);
  const y2 = cy + outerR * Math.sin(angle);
  axisLayer
    .append("line")
    .attr("x1", x1).attr("y1", y1).attr("x2", x2).attr("y2", y2)
    .attr("stroke", t.inkSoft)
    .attr("stroke-width", 1.5);

  const lx = cx + (outerR + 34) * Math.cos(angle);
  const ly = cy + (outerR + 34) * Math.sin(angle);
  axisLayer
    .append("text")
    .attr("x", lx).attr("y", ly)
    .attr("text-anchor", "middle")
    .attr("dominant-baseline", "middle")
    .attr("fill", axisColor(axis.key))
    .style("font-size", "18px")
    .style("font-weight", "600")
    .text(axis.label);
});

// --- Nodes --------------------------------------------------------------------
svg
  .append("g")
  .selectAll("circle")
  .data(nodes)
  .join("circle")
  .attr("cx", (n) => nodePos.get(n.id).x)
  .attr("cy", (n) => nodePos.get(n.id).y)
  .attr("r", (n) => radiusScale(degree.get(n.id)))
  .attr("fill", (n) => nodePos.get(n.id).color)
  .attr("stroke", t.pageBg)
  .attr("stroke-width", 1.5);

// --- Title ------------------------------------------------------------------
svg
  .append("text")
  .attr("x", width / 2).attr("y", 56)
  .attr("text-anchor", "middle")
  .attr("fill", t.ink)
  .style("font-size", "26px")
  .style("font-weight", "600")
  .text("hive-basic · javascript · d3 · anyplot.ai");

svg
  .append("text")
  .attr("x", width / 2).attr("y", 88)
  .attr("text-anchor", "middle")
  .attr("fill", t.inkSoft)
  .style("font-size", "16px")
  .text("Software module dependency network — node radius encodes degree");
Runnable source as JSON, for any HTTP client: https://api.anyplot.ai/specs/hive-basic/d3/code. Any spec id and library id listed in llms-full.txt fit the same URL shape; every URL below is complete and callable.
{
  "spec_id": "hive-basic",
  "language": "javascript",
  "library": "d3",
  "page": "https://anyplot.ai/hive-basic/javascript/d3",
  "hub": "https://anyplot.ai/hive-basic",
  "code_json": "https://api.anyplot.ai/specs/hive-basic/d3/code",
  "spec_json": "https://api.anyplot.ai/specs/hive-basic",
  "render_light_png": "https://storage.googleapis.com/anyplot-images/plots/hive-basic/javascript/d3/plot-light.png",
  "render_dark_png": "https://storage.googleapis.com/anyplot-images/plots/hive-basic/javascript/d3/plot-dark.png",
  "interactive_light_html": "https://storage.googleapis.com/anyplot-images/plots/hive-basic/javascript/d3/plot-light.html",
  "interactive_dark_html": "https://storage.googleapis.com/anyplot-images/plots/hive-basic/javascript/d3/plot-dark.html",
  "quality_score": 85.0,
  "license": "MIT",
  "guide": "https://anyplot.ai/llms.txt"
}
Part of Basic Hive Plot on anyplot.ai.