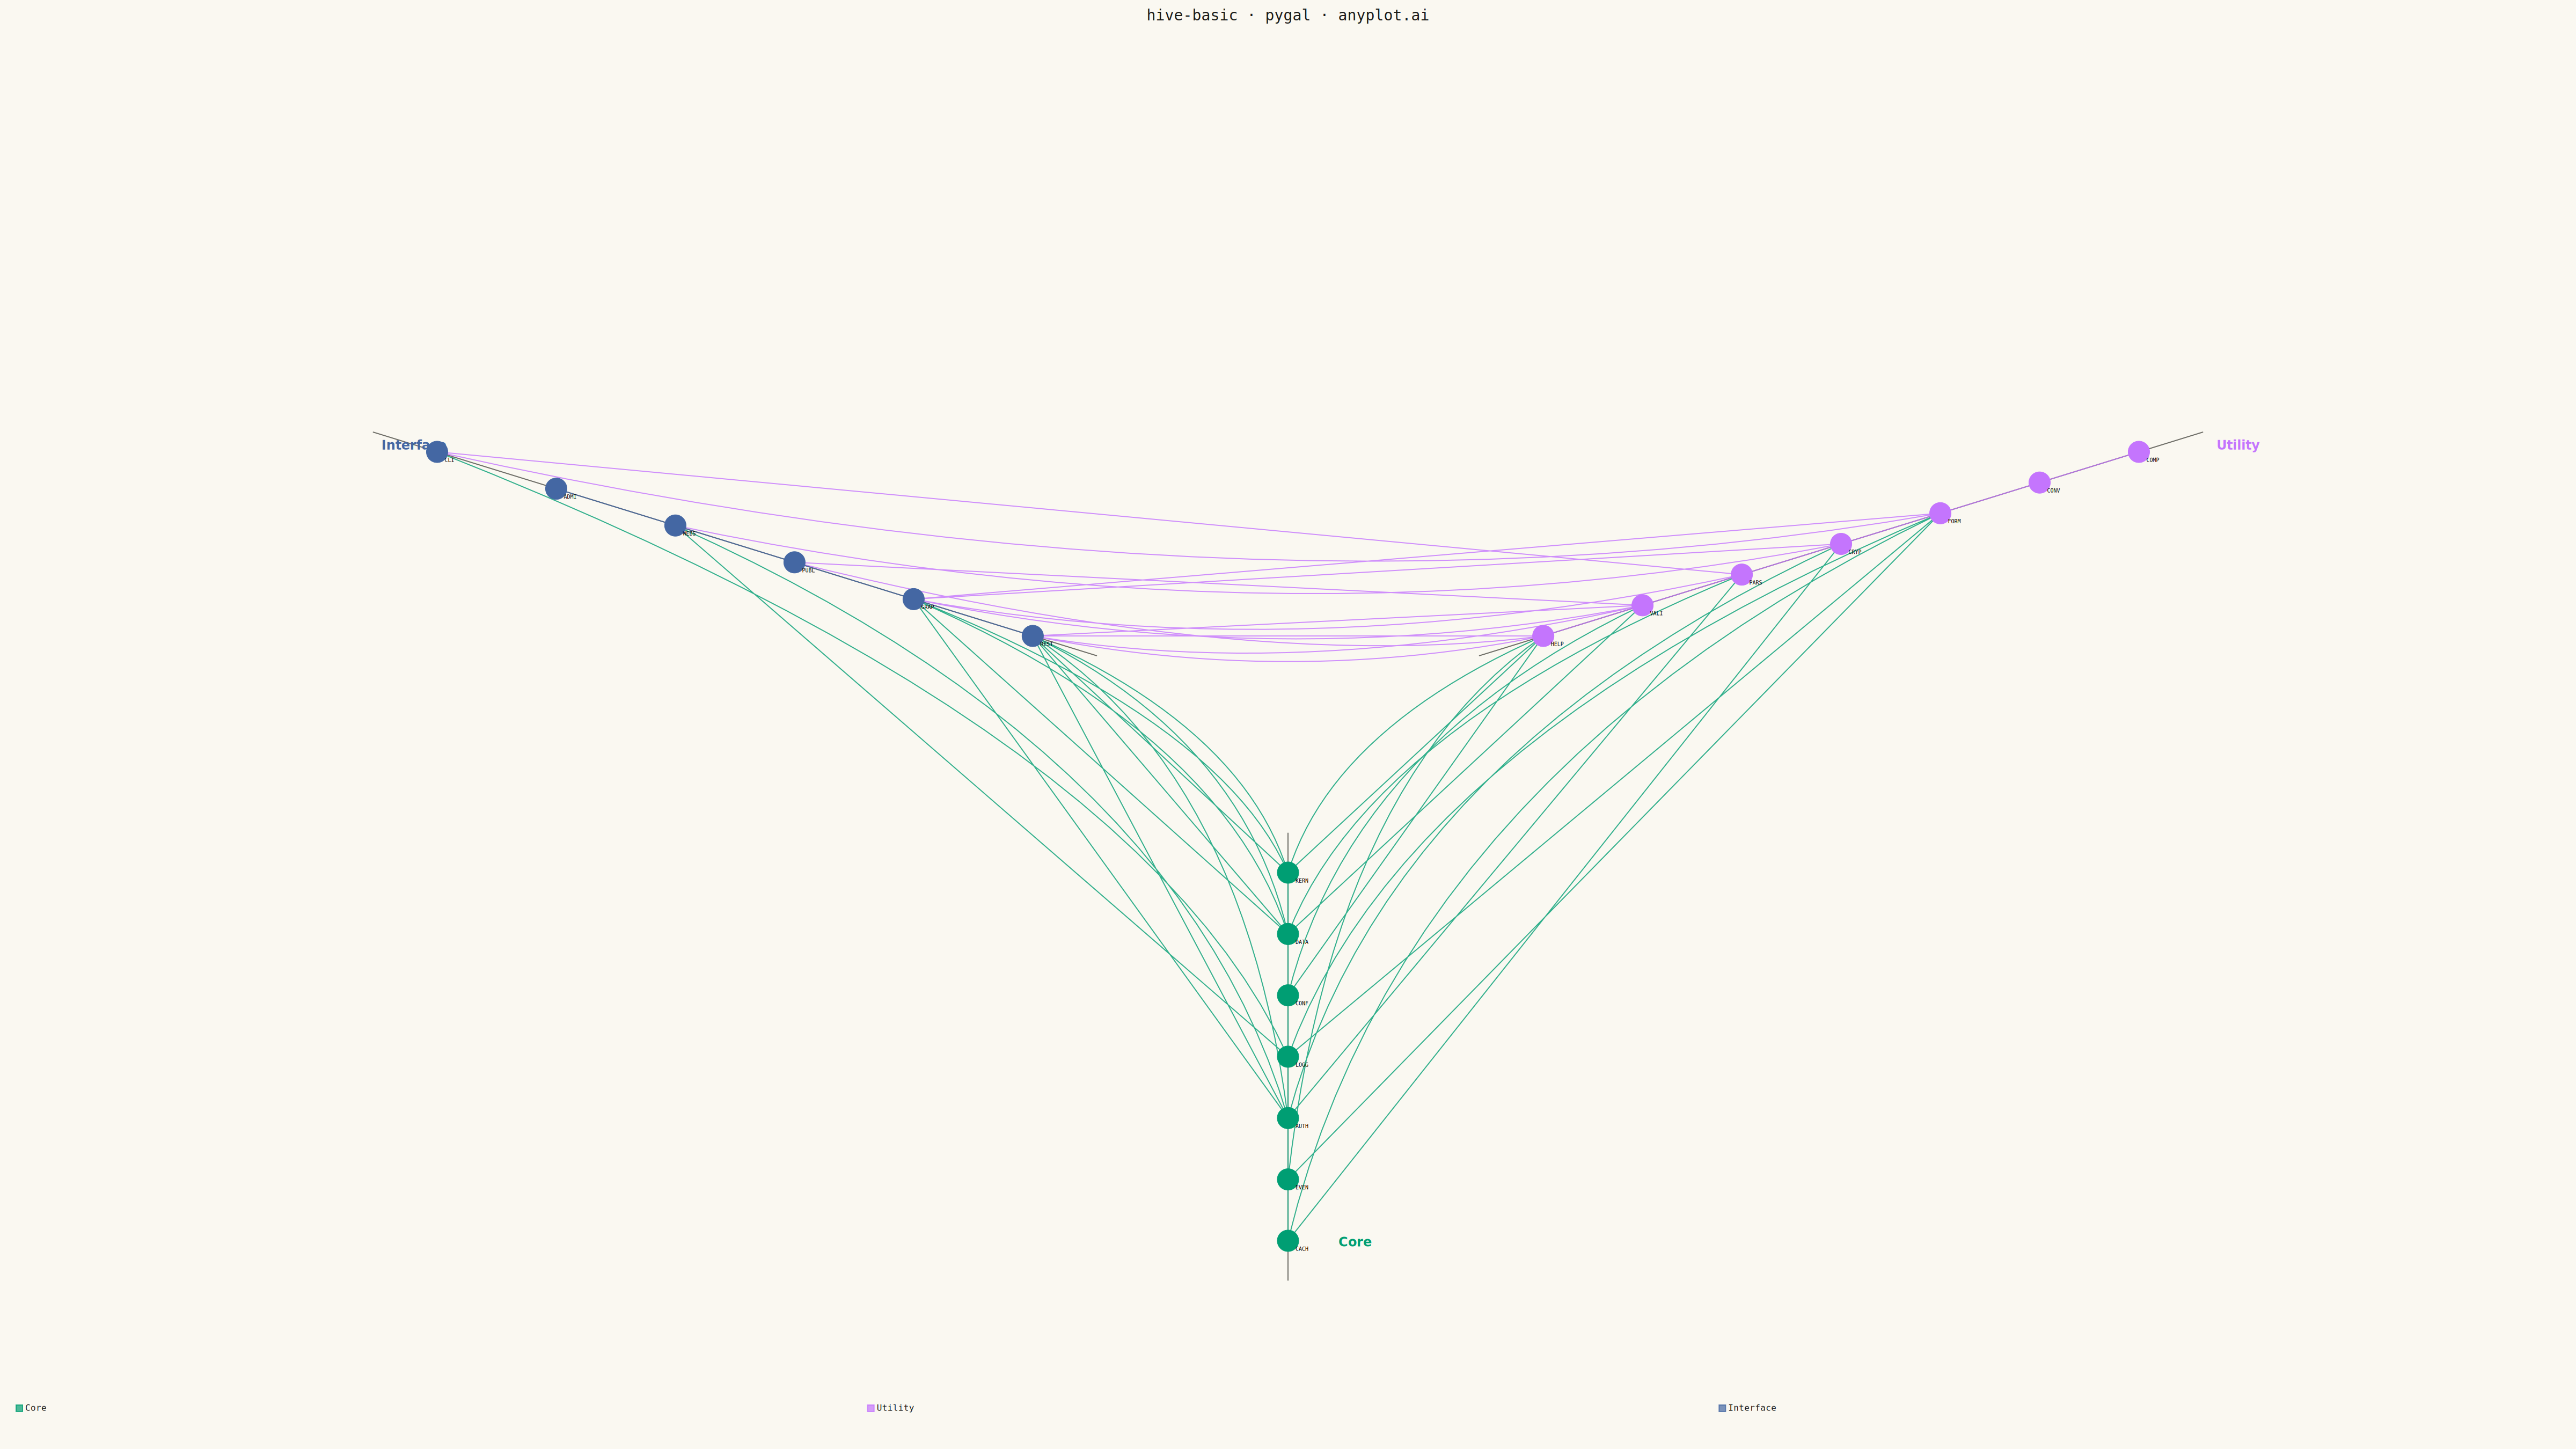
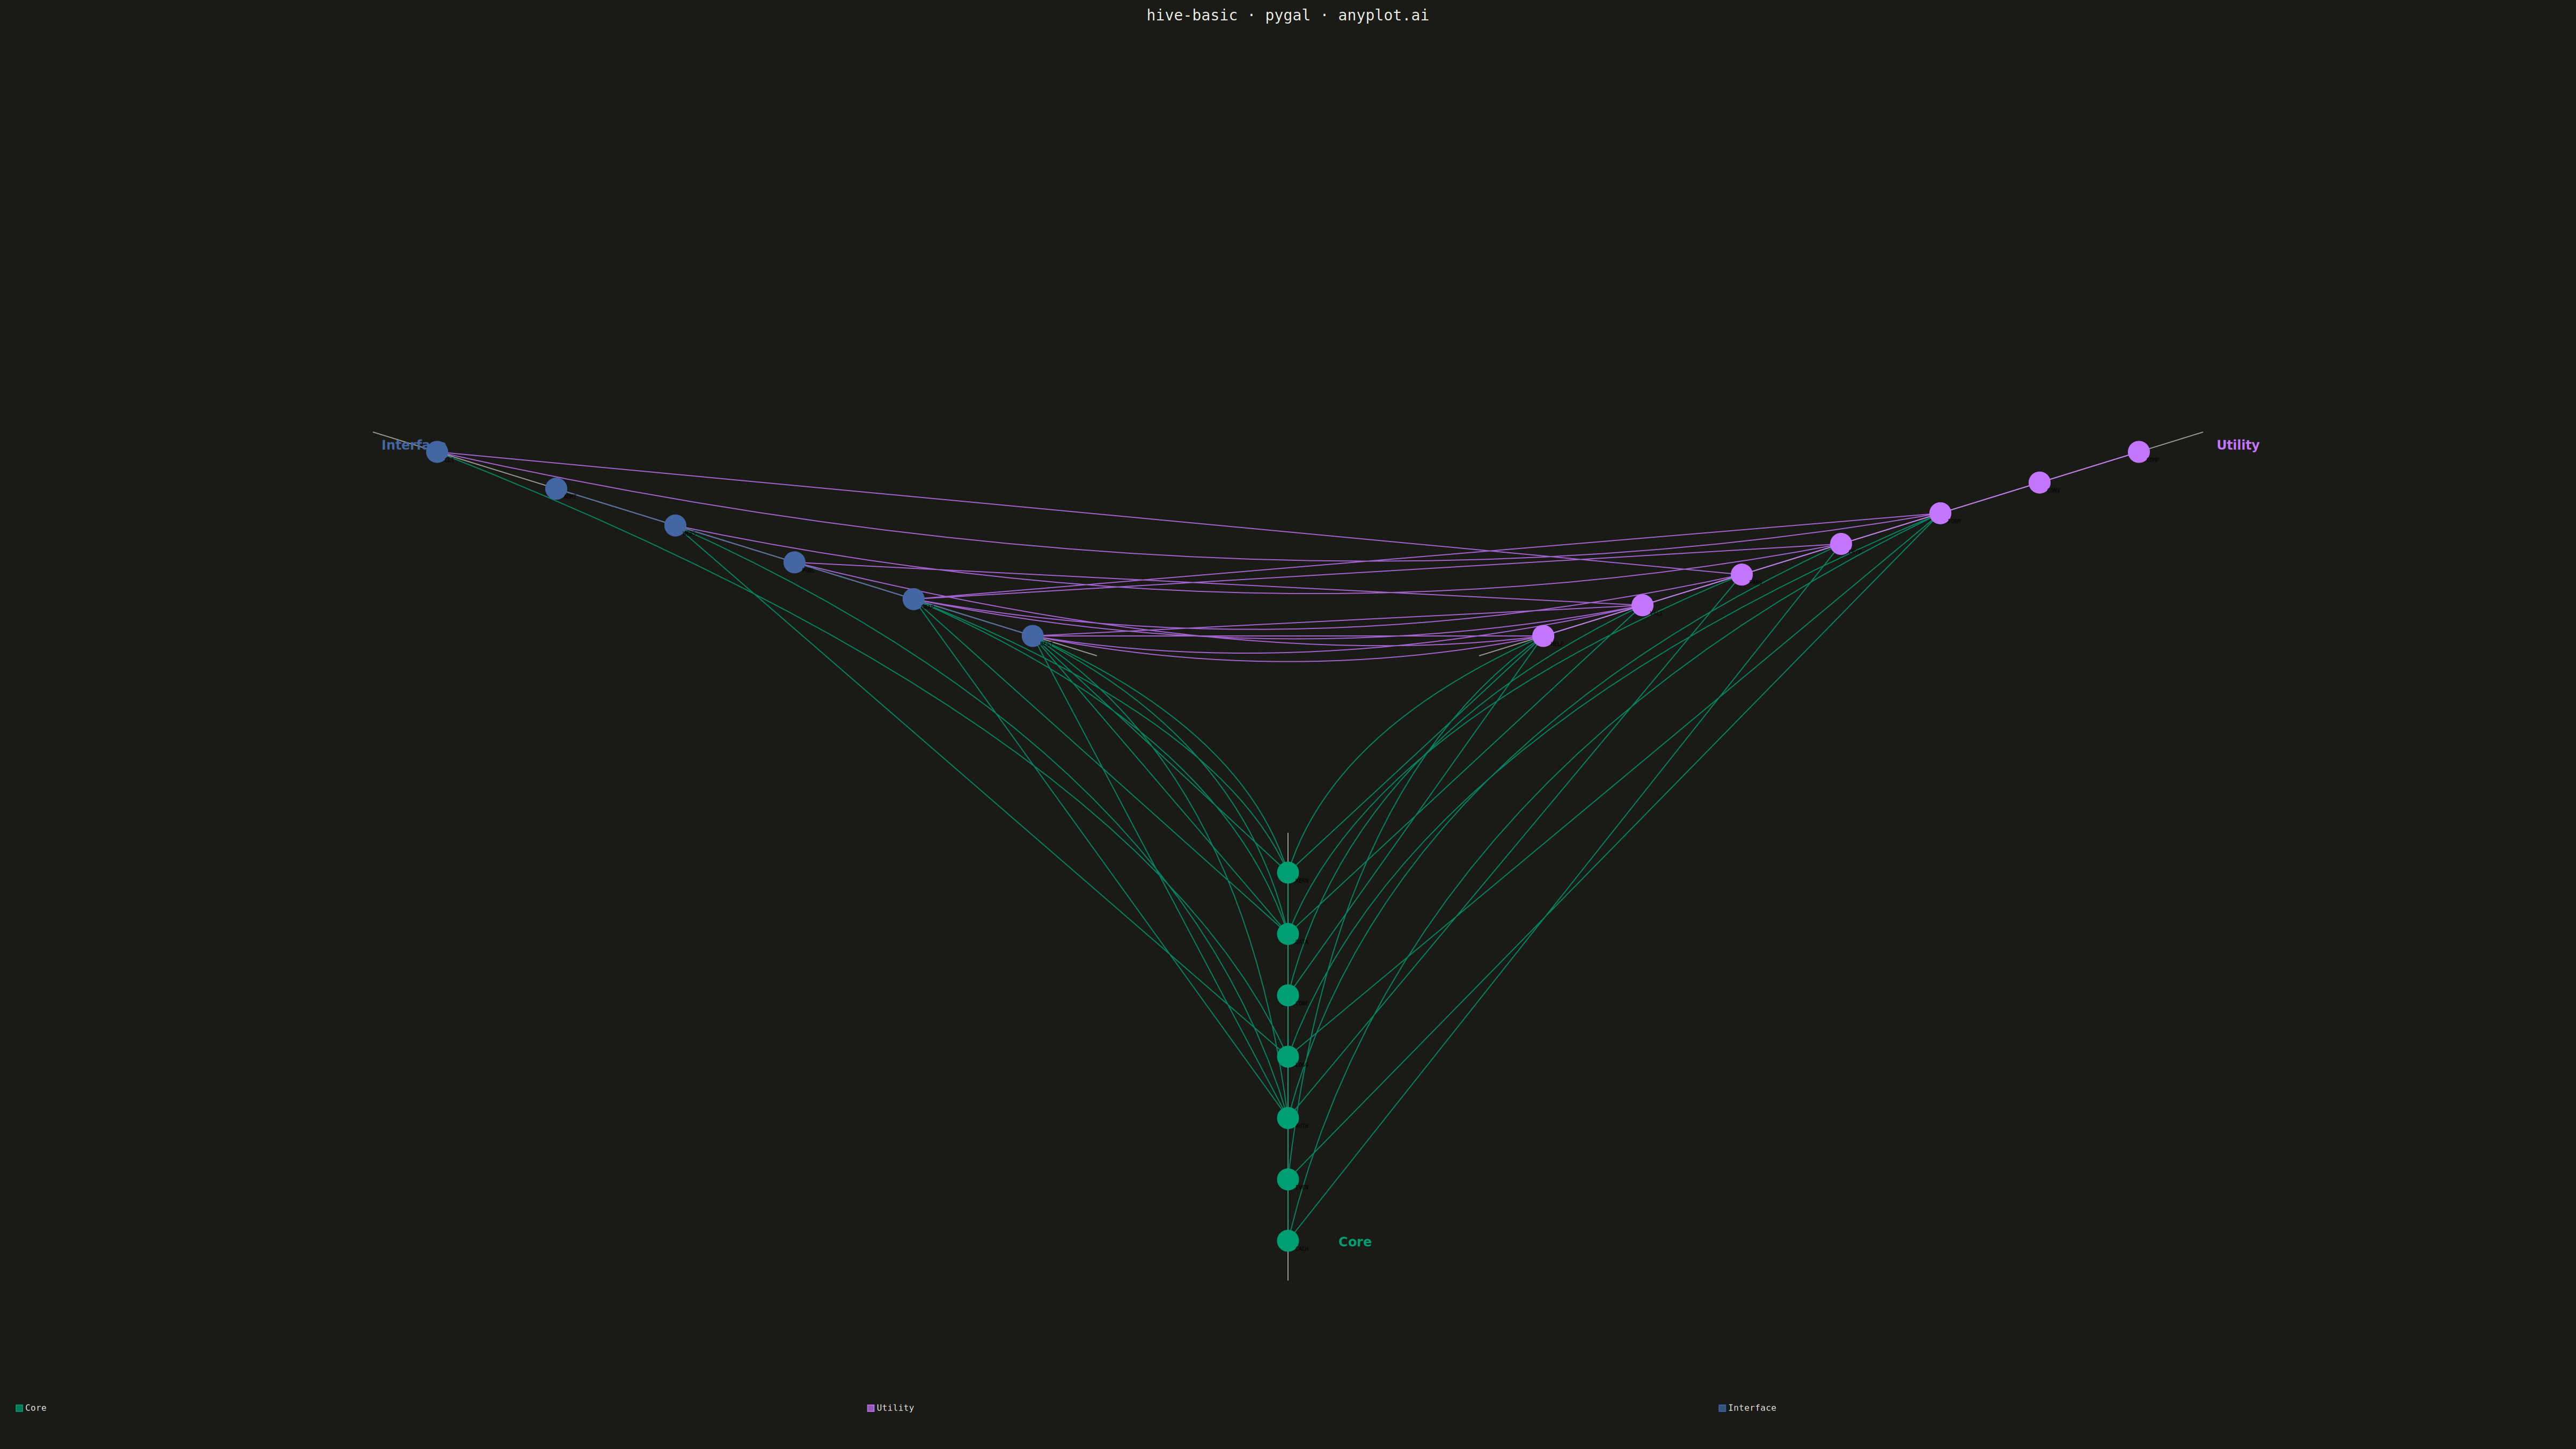
A hive plot arranges network nodes on radial axes based on node properties (such as degree, category, or other attributes), enabling reproducible and directly comparable network visualizations. Unlike force-directed layouts which can produce different arrangements for identical networks, hive plots always render the same network identically, solving the "hairball" problem of traditional network graphs and making structural comparisons reliable.
""" anyplot.ai
hive-basic: Basic Hive Plot
Library: pygal 3.1.0 | Python 3.13.13
Quality: 83/100 | Updated: 2026-05-07
"""

import math
import os
import re
import sys

import cairosvg
import numpy as np


# Avoid import shadowing: temporarily remove current directory from path
_cwd = os.getcwd()
sys.path = [p for p in sys.path if os.path.abspath(p) != _cwd]

import pygal
from pygal.style import Style


# Restore path for any later imports
sys.path.insert(0, _cwd)

THEME = os.getenv("ANYPLOT_THEME", "light")
PAGE_BG = "#FAF8F1" if THEME == "light" else "#1A1A17"
INK = "#1A1A17" if THEME == "light" else "#F0EFE8"
INK_SOFT = "#4A4A44" if THEME == "light" else "#B8B7B0"
INK_MUTED = "#6B6A63" if THEME == "light" else "#A8A79F"

IMPRINT = ["#009E73", "#C475FD", "#4467A3", "#BD8233", "#AE3030", "#2ABCCD", "#954477"]

np.random.seed(42)

# Data: Software module dependency network
# Nodes assigned to 3 axes by module type: Core (0), Utility (1), Interface (2)
nodes = [
    # Core modules (axis 0)
    {"id": 0, "label": "kernel", "axis": 0, "degree": 8},
    {"id": 1, "label": "config", "axis": 0, "degree": 6},
    {"id": 2, "label": "database", "axis": 0, "degree": 7},
    {"id": 3, "label": "auth", "axis": 0, "degree": 5},
    {"id": 4, "label": "cache", "axis": 0, "degree": 4},
    {"id": 5, "label": "logger", "axis": 0, "degree": 6},
    {"id": 6, "label": "events", "axis": 0, "degree": 5},
    # Utility modules (axis 1)
    {"id": 7, "label": "helpers", "axis": 1, "degree": 5},
    {"id": 8, "label": "validators", "axis": 1, "degree": 4},
    {"id": 9, "label": "formatters", "axis": 1, "degree": 3},
    {"id": 10, "label": "parsers", "axis": 1, "degree": 4},
    {"id": 11, "label": "converters", "axis": 1, "degree": 3},
    {"id": 12, "label": "crypto", "axis": 1, "degree": 4},
    {"id": 13, "label": "compress", "axis": 1, "degree": 2},
    # Interface modules (axis 2)
    {"id": 14, "label": "rest_api", "axis": 2, "degree": 6},
    {"id": 15, "label": "graphql", "axis": 2, "degree": 5},
    {"id": 16, "label": "websocket", "axis": 2, "degree": 4},
    {"id": 17, "label": "cli", "axis": 2, "degree": 3},
    {"id": 18, "label": "admin_ui", "axis": 2, "degree": 4},
    {"id": 19, "label": "public_ui", "axis": 2, "degree": 5},
]

# Edges: Dependencies between modules
edges = [
    # Core → Core
    (0, 1),
    (0, 2),
    (0, 3),
    (1, 4),
    (1, 5),
    (2, 4),
    (2, 5),
    (3, 6),
    # Core → Utility
    (0, 7),
    (1, 8),
    (2, 10),
    (3, 12),
    (4, 9),
    (5, 9),
    (6, 7),
    # Core → Interface
    (0, 14),
    (0, 15),
    (2, 14),
    (2, 15),
    (3, 14),
    (3, 16),
    (5, 17),
    # Utility → Utility
    (7, 8),
    (8, 10),
    (9, 11),
    (10, 11),
    (12, 13),
    # Utility → Interface
    (7, 14),
    (7, 19),
    (8, 14),
    (8, 15),
    (9, 17),
    (10, 15),
    (12, 16),
    # Interface → Interface
    (14, 18),
    (14, 19),
    (15, 19),
    (16, 18),
]

# Axis configuration (3 radial axes at 120 degrees apart)
n_axes = 3
axis_angles = [2 * math.pi * i / n_axes - math.pi / 2 for i in range(n_axes)]
axis_names = ["Core", "Utility", "Interface"]

# Calculate node positions along each axis
center_x, center_y = 5.0, 5.0
inner_radius = 1.2
outer_radius = 4.0

# Sort nodes by axis and degree for positioning
axis_nodes = {i: [] for i in range(n_axes)}
for node in nodes:
    axis_nodes[node["axis"]].append(node)

# Sort each axis by degree (descending) for inner-to-outer positioning
for axis_id in axis_nodes:
    axis_nodes[axis_id].sort(key=lambda n: -n["degree"])

# Calculate positions
node_positions = {}
for axis_id in range(n_axes):
    angle = axis_angles[axis_id]
    nodes_on_axis = axis_nodes[axis_id]
    n_nodes = len(nodes_on_axis)

    for i, node in enumerate(nodes_on_axis):
        if n_nodes > 1:
            t = i / (n_nodes - 1)
        else:
            t = 0.5
        radius = inner_radius + t * (outer_radius - inner_radius)
        x = center_x + radius * math.cos(angle)
        y = center_y + radius * math.sin(angle)
        node_positions[node["id"]] = (x, y, axis_id)

# Create theme-adaptive style
custom_style = Style(
    background=PAGE_BG,
    plot_background=PAGE_BG,
    foreground=INK,
    foreground_strong=INK,
    foreground_subtle=INK_MUTED,
    colors=(
        INK_SOFT,
        INK_SOFT,
        INK_SOFT,
        IMPRINT[0] + "44",
        IMPRINT[1] + "44",
        IMPRINT[2] + "44",
        IMPRINT[0],
        IMPRINT[1],
        IMPRINT[2],
    ),
    title_font_size=28,
    label_font_size=18,
    major_label_font_size=16,
    legend_font_size=16,
    value_font_size=14,
    stroke_width=2,
)

# Create XY chart
chart = pygal.XY(
    width=4800,
    height=2700,
    style=custom_style,
    title="hive-basic · pygal · anyplot.ai",
    show_legend=True,
    x_title="",
    y_title="",
    show_x_guides=False,
    show_y_guides=False,
    show_x_labels=False,
    show_y_labels=False,
    stroke=True,
    dots_size=20,
    legend_at_bottom=True,
    range=(0, 10),
    xrange=(0, 10),
    print_labels=True,
    print_values=False,
)

# Draw axis lines
for axis_id in range(n_axes):
    angle = axis_angles[axis_id]
    x1 = center_x + (inner_radius - 0.3) * math.cos(angle)
    y1 = center_y + (inner_radius - 0.3) * math.sin(angle)
    x2 = center_x + (outer_radius + 0.3) * math.cos(angle)
    y2 = center_y + (outer_radius + 0.3) * math.sin(angle)
    chart.add(
        None,
        [(x1, y1), (x2, y2)],
        stroke=True,
        show_dots=False,
        fill=False,
        stroke_style={"width": 4, "linecap": "round"},
    )

# Calculate axis label positions
label_radius = outer_radius + 0.7
axis_label_positions = []
for axis_id in range(n_axes):
    angle = axis_angles[axis_id]
    label_x = center_x + label_radius * math.cos(angle)
    label_y = center_y + label_radius * math.sin(angle)
    axis_label_positions.append((label_x, label_y, axis_names[axis_id], IMPRINT[axis_id]))

# Draw edges as curved paths with bundling to reduce visual clutter
edge_points_by_axis = {0: [], 1: [], 2: []}

for src, tgt in edges:
    src_x, src_y, src_axis = node_positions[src]
    tgt_x, tgt_y, tgt_axis = node_positions[tgt]

    # Edge bundling: bend toward center more for inter-axis edges
    if src_axis == tgt_axis:
        pull = 0.75
    else:
        pull = 0.35

    ctrl_x = center_x + pull * ((src_x + tgt_x) / 2 - center_x)
    ctrl_y = center_y + pull * ((src_y + tgt_y) / 2 - center_y)

    # Generate Bezier curve points
    n_points = 25
    for t_idx in range(n_points + 1):
        t = t_idx / n_points
        bx = (1 - t) ** 2 * src_x + 2 * (1 - t) * t * ctrl_x + t**2 * tgt_x
        by = (1 - t) ** 2 * src_y + 2 * (1 - t) * t * ctrl_y + t**2 * tgt_y
        edge_points_by_axis[src_axis].append((bx, by))
    edge_points_by_axis[src_axis].append(None)

# Add edges grouped by source axis
for axis_id in range(n_axes):
    chart.add(
        None,
        edge_points_by_axis[axis_id],
        stroke=True,
        show_dots=False,
        fill=False,
        stroke_style={"width": 1, "linecap": "round"},
    )

# Add nodes grouped by axis with abbreviated labels to reduce overlap
for axis_id in range(n_axes):
    nodes_on_axis = axis_nodes[axis_id]
    node_points = []
    for node in nodes_on_axis:
        x, y, _ = node_positions[node["id"]]
        node_points.append({"value": (x, y), "label": node["label"][:4].upper()})
    chart.add(axis_names[axis_id], node_points, stroke=False)

# Render SVG
svg_content = chart.render().decode("utf-8")

# Extract viewBox dimensions
viewbox_match = re.search(r'viewBox="([^"]+)"', svg_content)
if viewbox_match:
    vb_parts = viewbox_match.group(1).split()
    vb_width = float(vb_parts[2])
    vb_height = float(vb_parts[3])
else:
    vb_width = 4800
    vb_height = 2700

# Calculate plot area coordinates
plot_left = vb_width * 0.08
plot_right = vb_width * 0.95
plot_top = vb_height * 0.12
plot_bottom = vb_height * 0.88

plot_width = plot_right - plot_left
plot_height = plot_bottom - plot_top
data_range = 10.0


def data_to_svg(dx, dy):
    """Convert data coordinates to SVG coordinates."""
    sx = plot_left + (dx / data_range) * plot_width
    sy = plot_bottom - (dy / data_range) * plot_height
    return sx, sy


# Create axis label text elements
axis_label_svg = ""
for dx, dy, label, color in axis_label_positions:
    sx, sy = data_to_svg(dx, dy)
    if dy > center_y:
        text_anchor = "middle"
        dy_offset = -30
        dx_offset = 0
    elif dx < center_x:
        text_anchor = "end"
        dy_offset = 8
        dx_offset = -22
    else:
        text_anchor = "start"
        dy_offset = 8
        dx_offset = 22

    axis_label_svg += f'''
    <text x="{sx + dx_offset}" y="{sy + dy_offset}" fill="{color}"
          font-size="24" font-weight="bold" font-family="sans-serif"
          text-anchor="{text_anchor}">{label}</text>'''

# Insert axis labels before closing tag
svg_content = svg_content.replace("</svg>", f"{axis_label_svg}\n</svg>")

# Save SVG and convert to PNG
with open(f"plot-{THEME}.svg", "w") as f:
    f.write(svg_content)

cairosvg.svg2png(bytestring=svg_content.encode("utf-8"), write_to=f"plot-{THEME}.png")

# Save interactive HTML
with open(f"plot-{THEME}.html", "w") as f:
    f.write(
        f"""<!DOCTYPE html>
<html>
<head>
    <title>hive-basic · pygal · anyplot.ai</title>
    <style>
        body {{ margin: 0; padding: 20px; background: {PAGE_BG}; }}
        .container {{ max-width: 100%; margin: 0 auto; }}
        object {{ width: 100%; height: auto; }}
    </style>
</head>
<body>
    <div class="container">
        <object type="image/svg+xml" data="plot-{THEME}.svg">
            Hive plot not supported
        </object>
    </div>
</body>
</html>"""
    )
Runnable source as JSON, for any HTTP client: https://api.anyplot.ai/specs/hive-basic/pygal/code. Any spec id and library id listed in llms-full.txt fit the same URL shape; every URL below is complete and callable.
{
  "spec_id": "hive-basic",
  "language": "python",
  "library": "pygal",
  "page": "https://anyplot.ai/hive-basic/python/pygal",
  "hub": "https://anyplot.ai/hive-basic",
  "code_json": "https://api.anyplot.ai/specs/hive-basic/pygal/code",
  "spec_json": "https://api.anyplot.ai/specs/hive-basic",
  "render_light_png": "https://storage.googleapis.com/anyplot-images/plots/hive-basic/python/pygal/plot-light.png",
  "render_dark_png": "https://storage.googleapis.com/anyplot-images/plots/hive-basic/python/pygal/plot-dark.png",
  "interactive_light_html": "https://storage.googleapis.com/anyplot-images/plots/hive-basic/python/pygal/plot-light.html",
  "interactive_dark_html": "https://storage.googleapis.com/anyplot-images/plots/hive-basic/python/pygal/plot-dark.html",
  "quality_score": 83.0,
  "license": "MIT",
  "guide": "https://anyplot.ai/llms.txt"
}
Part of Basic Hive Plot on anyplot.ai.