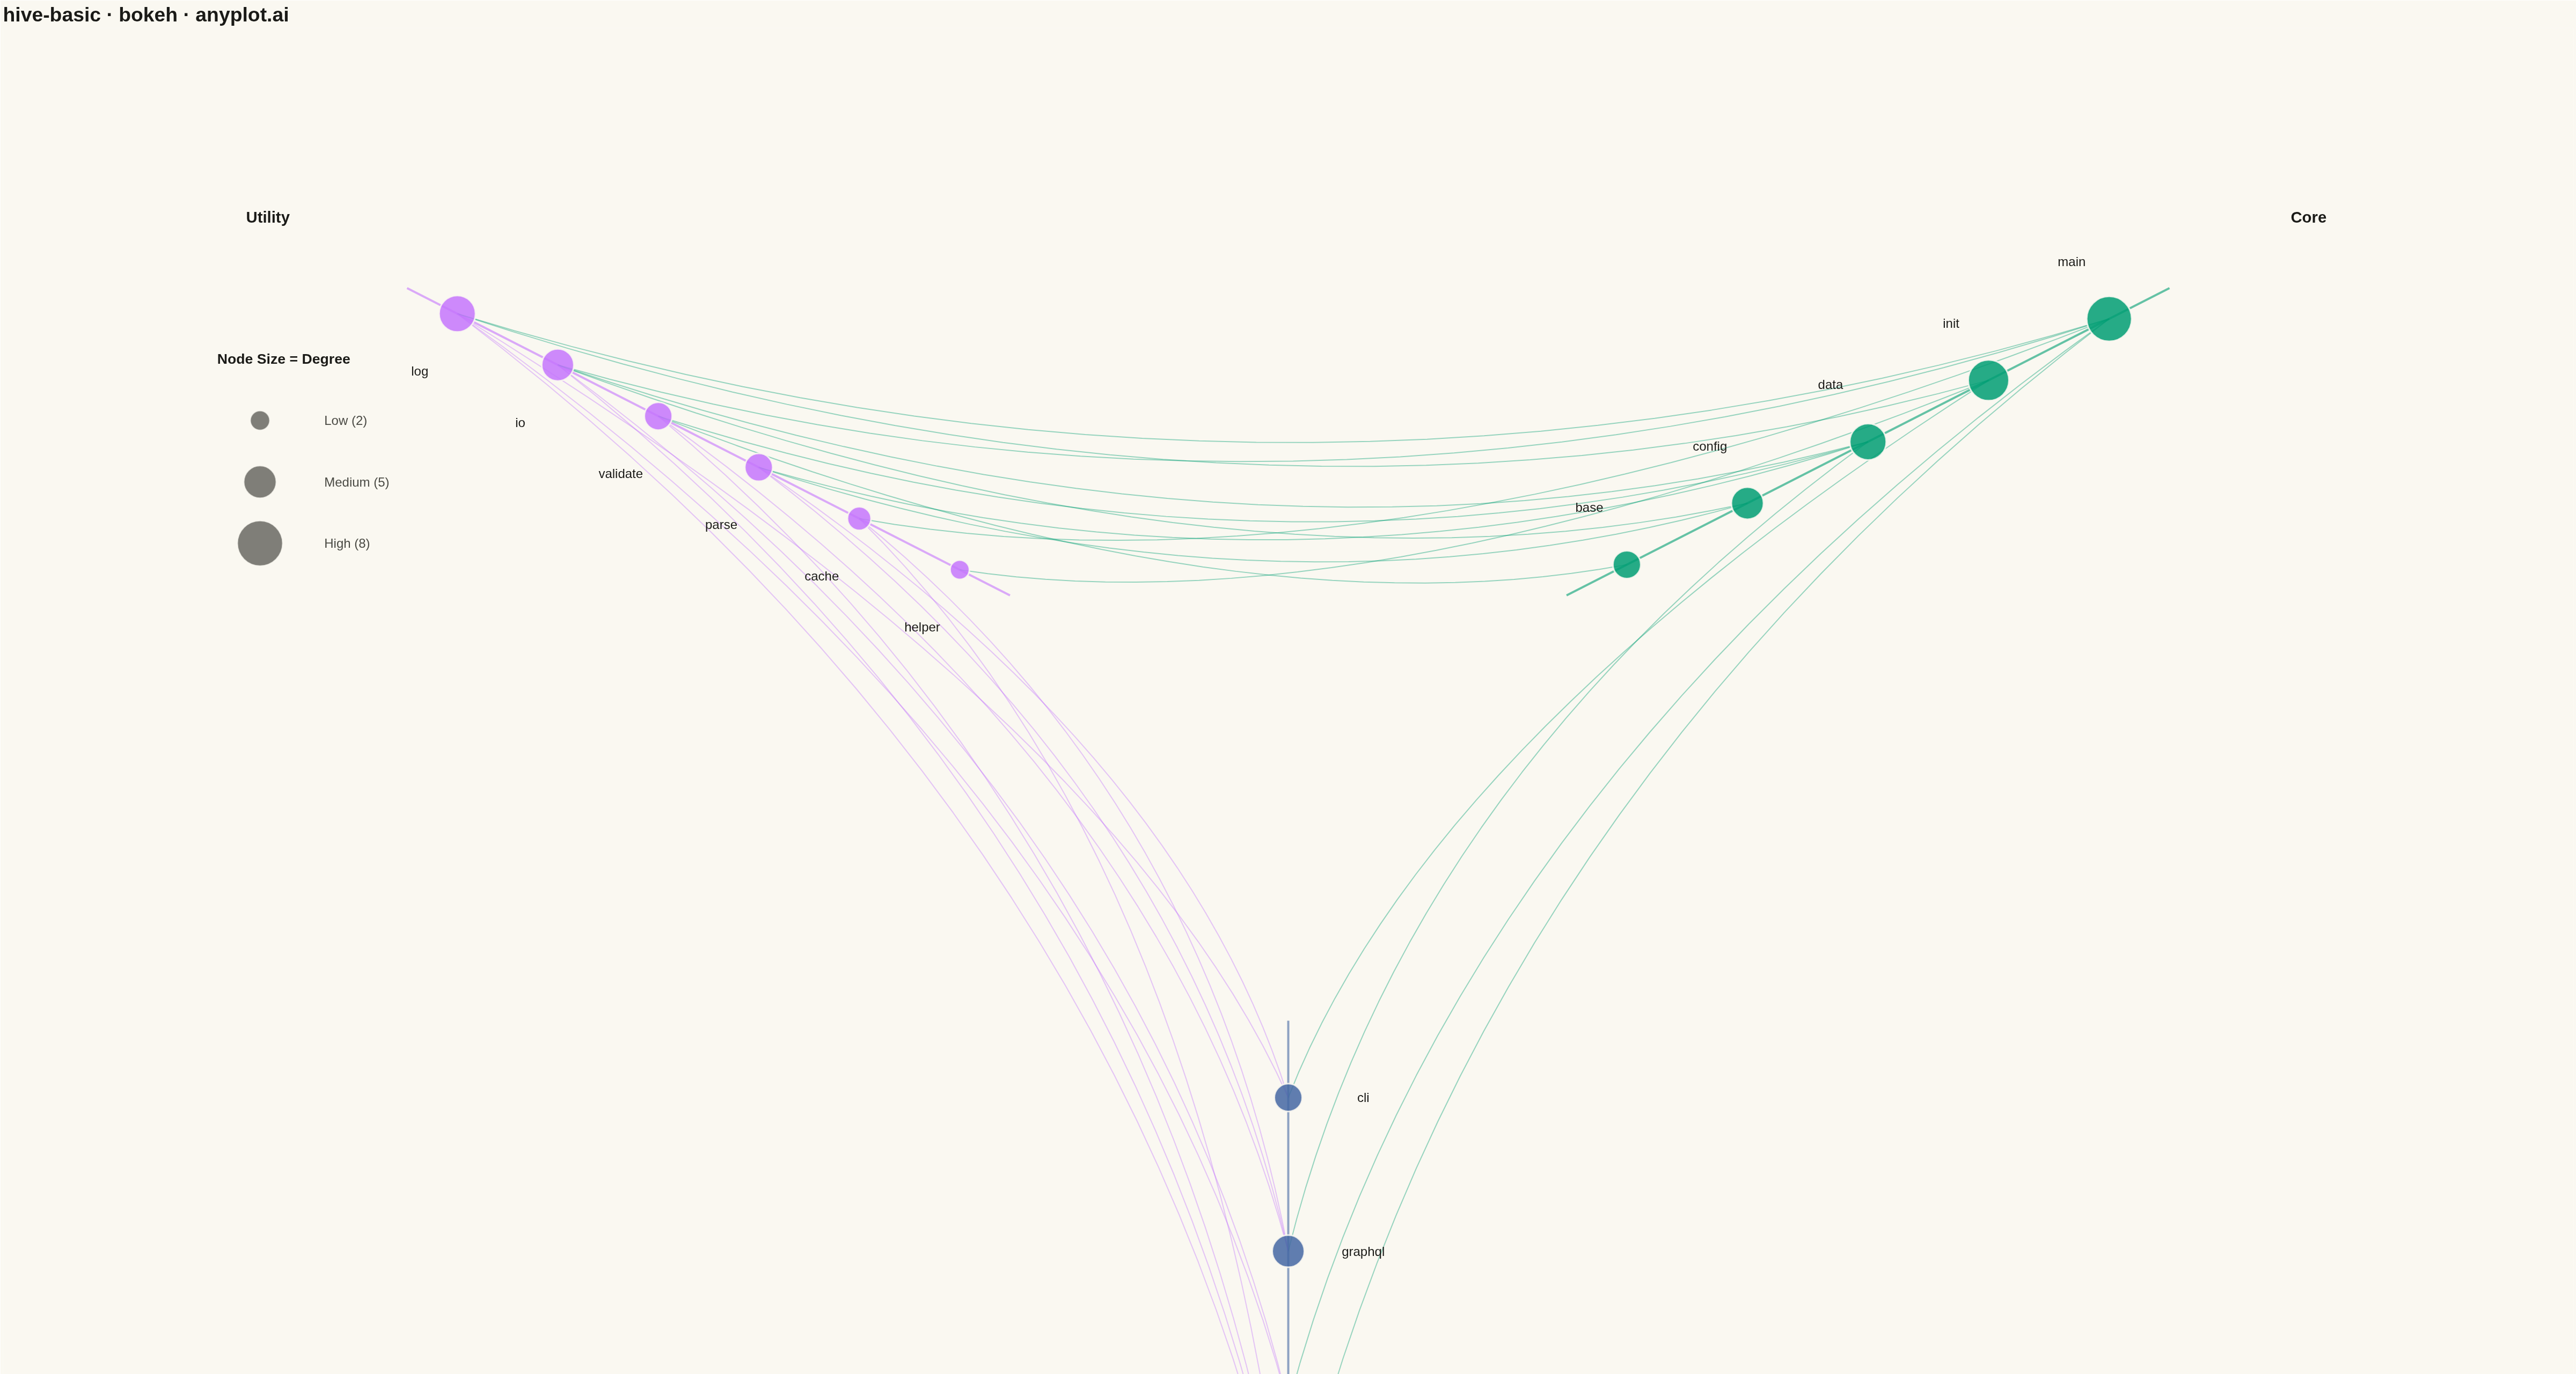
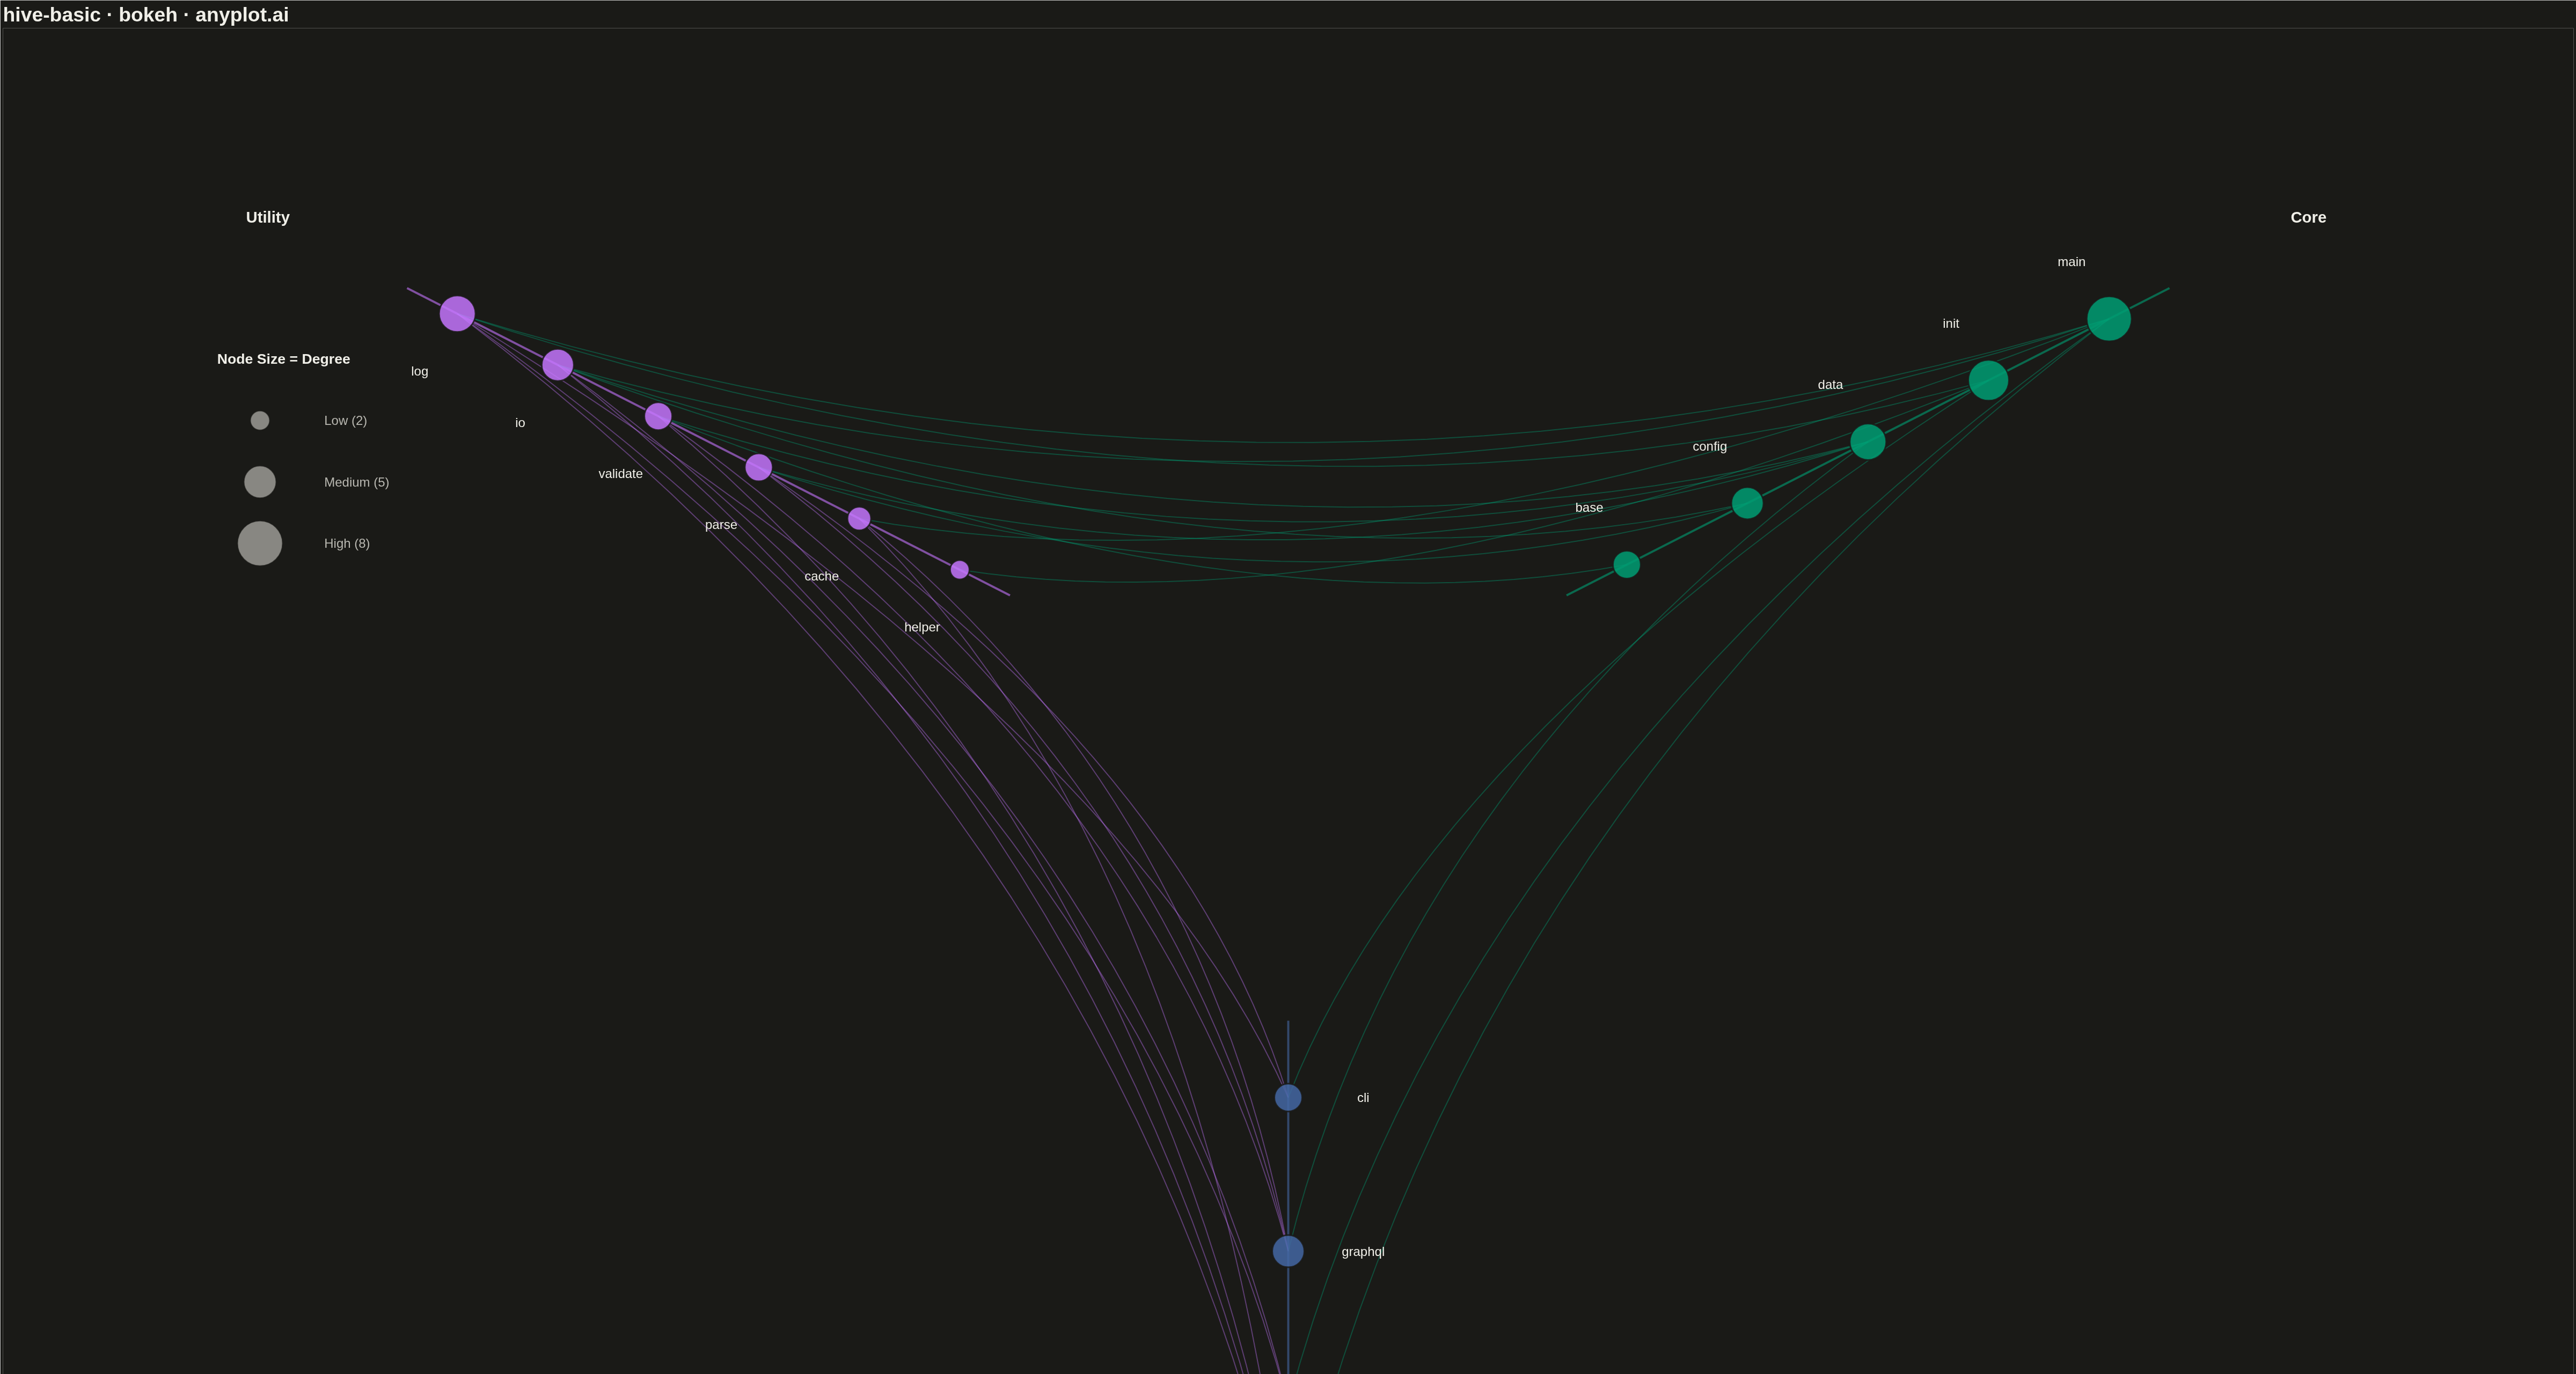
A hive plot arranges network nodes on radial axes based on node properties (such as degree, category, or other attributes), enabling reproducible and directly comparable network visualizations. Unlike force-directed layouts which can produce different arrangements for identical networks, hive plots always render the same network identically, solving the "hairball" problem of traditional network graphs and making structural comparisons reliable.
""" anyplot.ai
hive-basic: Basic Hive Plot
Library: bokeh 3.9.0 | Python 3.13.13
Quality: 91/100 | Updated: 2026-05-07
"""

import os
import time
from pathlib import Path

import numpy as np
from bokeh.io import output_file, save
from bokeh.models import ColumnDataSource, Label
from bokeh.plotting import figure
from selenium import webdriver
from selenium.webdriver.chrome.options import Options


# Theme tokens
THEME = os.getenv("ANYPLOT_THEME", "light")
PAGE_BG = "#FAF8F1" if THEME == "light" else "#1A1A17"
ELEVATED_BG = "#FFFDF6" if THEME == "light" else "#242420"
INK = "#1A1A17" if THEME == "light" else "#F0EFE8"
INK_SOFT = "#4A4A44" if THEME == "light" else "#B8B7B0"

# Okabe-Ito palette - first series is always #009E73
IMPRINT = [
    "#009E73",  # bluish green (brand)
    "#C475FD",  # vermillion
    "#4467A3",  # blue
]

# Data: Software module dependency network
# Nodes assigned to 3 axes by module type: Core, Utility, Interface
np.random.seed(42)

nodes = {
    # Core modules (axis 0)
    "core_main": {"axis": 0, "degree": 8},
    "core_data": {"axis": 0, "degree": 6},
    "core_config": {"axis": 0, "degree": 5},
    "core_init": {"axis": 0, "degree": 7},
    "core_base": {"axis": 0, "degree": 4},
    # Utility modules (axis 1)
    "util_io": {"axis": 1, "degree": 5},
    "util_parse": {"axis": 1, "degree": 4},
    "util_cache": {"axis": 1, "degree": 3},
    "util_log": {"axis": 1, "degree": 6},
    "util_helper": {"axis": 1, "degree": 2},
    "util_validate": {"axis": 1, "degree": 4},
    # Interface modules (axis 2)
    "api_rest": {"axis": 2, "degree": 7},
    "api_graphql": {"axis": 2, "degree": 5},
    "api_cli": {"axis": 2, "degree": 4},
    "api_web": {"axis": 2, "degree": 6},
}

edges = [
    # Core to Utility connections
    ("core_main", "util_io"),
    ("core_main", "util_log"),
    ("core_main", "util_cache"),
    ("core_data", "util_parse"),
    ("core_data", "util_io"),
    ("core_data", "util_validate"),
    ("core_config", "util_io"),
    ("core_config", "util_parse"),
    ("core_init", "util_log"),
    ("core_init", "util_helper"),
    ("core_base", "util_validate"),
    # Utility to Interface connections
    ("util_io", "api_rest"),
    ("util_io", "api_web"),
    ("util_parse", "api_graphql"),
    ("util_parse", "api_cli"),
    ("util_cache", "api_rest"),
    ("util_cache", "api_graphql"),
    ("util_log", "api_rest"),
    ("util_log", "api_cli"),
    ("util_log", "api_web"),
    ("util_validate", "api_rest"),
    ("util_validate", "api_graphql"),
    # Core to Interface connections (cross-axis)
    ("core_main", "api_rest"),
    ("core_main", "api_web"),
    ("core_data", "api_graphql"),
    ("core_init", "api_cli"),
]

# Hive plot parameters
n_axes = 3
# Rotate axes to point outward from center: up-right, up-left, down
axis_angles = [np.pi / 6, 5 * np.pi / 6, 3 * np.pi / 2]
inner_radius = 600
outer_radius = 1900
axis_labels = ["Core", "Utility", "Interface"]

# Calculate node positions on axes
node_positions = {}
for axis_id in range(n_axes):
    axis_nodes = [(name, data) for name, data in nodes.items() if data["axis"] == axis_id]
    axis_nodes.sort(key=lambda x: x[1]["degree"])
    n_nodes = len(axis_nodes)
    for i, (name, data) in enumerate(axis_nodes):
        t = (i + 0.5) / n_nodes
        radius = inner_radius + t * (outer_radius - inner_radius)
        angle = axis_angles[axis_id]
        x = radius * np.cos(angle)
        y = radius * np.sin(angle)
        node_positions[name] = {"x": x, "y": y, "axis": axis_id, "degree": data["degree"]}

# Create figure - landscape 16:9 for better canvas utilization
p = figure(
    width=4800,
    height=2700,
    title="hive-basic · bokeh · anyplot.ai",
    x_range=(-2400, 2400),
    y_range=(-1500, 1500),
    tools="",
    toolbar_location=None,
)

# Theme-adaptive styling
p.background_fill_color = PAGE_BG
p.border_fill_color = PAGE_BG
p.outline_line_color = None

p.title.text_font_size = "28pt"
p.title.text_color = INK

# Remove axes and grid for circular plot
p.axis.visible = False
p.grid.visible = False

# Draw radial axes
for i, angle in enumerate(axis_angles):
    x_start = inner_radius * np.cos(angle)
    y_start = inner_radius * np.sin(angle)
    x_end = outer_radius * np.cos(angle)
    y_end = outer_radius * np.sin(angle)
    p.line([x_start, x_end], [y_start, y_end], line_width=4, line_color=IMPRINT[i], line_alpha=0.6)

    # Axis labels
    label_radius = outer_radius + 300
    label_x = label_radius * np.cos(angle)
    label_y = label_radius * np.sin(angle)
    label = Label(
        x=label_x,
        y=label_y,
        text=axis_labels[i],
        text_font_size="22pt",
        text_align="center",
        text_baseline="middle",
        text_color=INK,
        text_font_style="bold",
    )
    p.add_layout(label)

# Draw edges as bezier curves
for source, target in edges:
    src_pos = node_positions[source]
    tgt_pos = node_positions[target]

    ctrl_x = (src_pos["x"] + tgt_pos["x"]) * 0.2
    ctrl_y = (src_pos["y"] + tgt_pos["y"]) * 0.2

    t_vals = np.linspace(0, 1, 30)
    curve_x = (1 - t_vals) ** 2 * src_pos["x"] + 2 * (1 - t_vals) * t_vals * ctrl_x + t_vals**2 * tgt_pos["x"]
    curve_y = (1 - t_vals) ** 2 * src_pos["y"] + 2 * (1 - t_vals) * t_vals * ctrl_y + t_vals**2 * tgt_pos["y"]

    edge_color = IMPRINT[src_pos["axis"]]
    p.line(curve_x.tolist(), curve_y.tolist(), line_width=2, line_color=edge_color, line_alpha=0.4)

# Draw nodes with larger sizes for visibility
for axis_id in range(n_axes):
    axis_node_data = [(name, data) for name, data in node_positions.items() if data["axis"] == axis_id]
    x_coords = [d["x"] for _, d in axis_node_data]
    y_coords = [d["y"] for _, d in axis_node_data]
    names = [name for name, _ in axis_node_data]
    sizes = [20 + d["degree"] * 8 for _, d in axis_node_data]

    source = ColumnDataSource(data={"x": x_coords, "y": y_coords, "size": sizes, "name": names})

    p.scatter(
        x="x",
        y="y",
        size="size",
        source=source,
        fill_color=IMPRINT[axis_id],
        line_color=PAGE_BG,
        line_width=3,
        alpha=0.85,
    )

# Add node labels - positioned visibly
for name, data in node_positions.items():
    angle = axis_angles[data["axis"]]
    perp_angle = angle + np.pi / 2
    label_offset = 140
    label_x = data["x"] + label_offset * np.cos(perp_angle)
    label_y = data["y"] + label_offset * np.sin(perp_angle)

    short_name = name.split("_")[1] if "_" in name else name

    node_label = Label(
        x=label_x,
        y=label_y,
        text=short_name,
        text_font_size="18pt",
        text_align="center",
        text_baseline="middle",
        text_color=INK,
    )
    p.add_layout(node_label)

# Add legend for node size
legend_x = -2000
legend_y = 800
legend_title = Label(
    x=legend_x,
    y=legend_y,
    text="Node Size = Degree",
    text_font_size="20pt",
    text_align="left",
    text_baseline="middle",
    text_color=INK,
    text_font_style="bold",
)
p.add_layout(legend_title)

legend_sizes = [2, 5, 8]
legend_labels = ["Low (2)", "Medium (5)", "High (8)"]
for i, (deg, label_text) in enumerate(zip(legend_sizes, legend_labels, strict=True)):
    node_size = 20 + deg * 8
    item_y = legend_y - 130 - i * 130
    p.scatter(
        [legend_x + 80], [item_y], size=node_size, fill_color=INK_SOFT, line_color=PAGE_BG, line_width=2, alpha=0.7
    )
    size_label = Label(
        x=legend_x + 200,
        y=item_y,
        text=label_text,
        text_font_size="18pt",
        text_align="left",
        text_baseline="middle",
        text_color=INK_SOFT,
    )
    p.add_layout(size_label)

# Save HTML
output_file(f"plot-{THEME}.html")
save(p)

# Screenshot with headless Chrome via Selenium
W, H = 4800, 2700
opts = Options()
for arg in (
    "--headless=new",
    "--no-sandbox",
    "--disable-dev-shm-usage",
    "--disable-gpu",
    f"--window-size={W},{H}",
    "--hide-scrollbars",
):
    opts.add_argument(arg)
driver = webdriver.Chrome(options=opts)
driver.set_window_size(W, H)
driver.get(f"file://{Path(f'plot-{THEME}.html').resolve()}")
time.sleep(3)
driver.save_screenshot(f"plot-{THEME}.png")
driver.quit()
Runnable source as JSON, for any HTTP client: https://api.anyplot.ai/specs/hive-basic/bokeh/code. Any spec id and library id listed in llms-full.txt fit the same URL shape; every URL below is complete and callable.
{
  "spec_id": "hive-basic",
  "language": "python",
  "library": "bokeh",
  "page": "https://anyplot.ai/hive-basic/python/bokeh",
  "hub": "https://anyplot.ai/hive-basic",
  "code_json": "https://api.anyplot.ai/specs/hive-basic/bokeh/code",
  "spec_json": "https://api.anyplot.ai/specs/hive-basic",
  "render_light_png": "https://storage.googleapis.com/anyplot-images/plots/hive-basic/python/bokeh/plot-light.png",
  "render_dark_png": "https://storage.googleapis.com/anyplot-images/plots/hive-basic/python/bokeh/plot-dark.png",
  "interactive_light_html": "https://storage.googleapis.com/anyplot-images/plots/hive-basic/python/bokeh/plot-light.html",
  "interactive_dark_html": "https://storage.googleapis.com/anyplot-images/plots/hive-basic/python/bokeh/plot-dark.html",
  "quality_score": 91.0,
  "license": "MIT",
  "guide": "https://anyplot.ai/llms.txt"
}
Part of Basic Hive Plot on anyplot.ai.