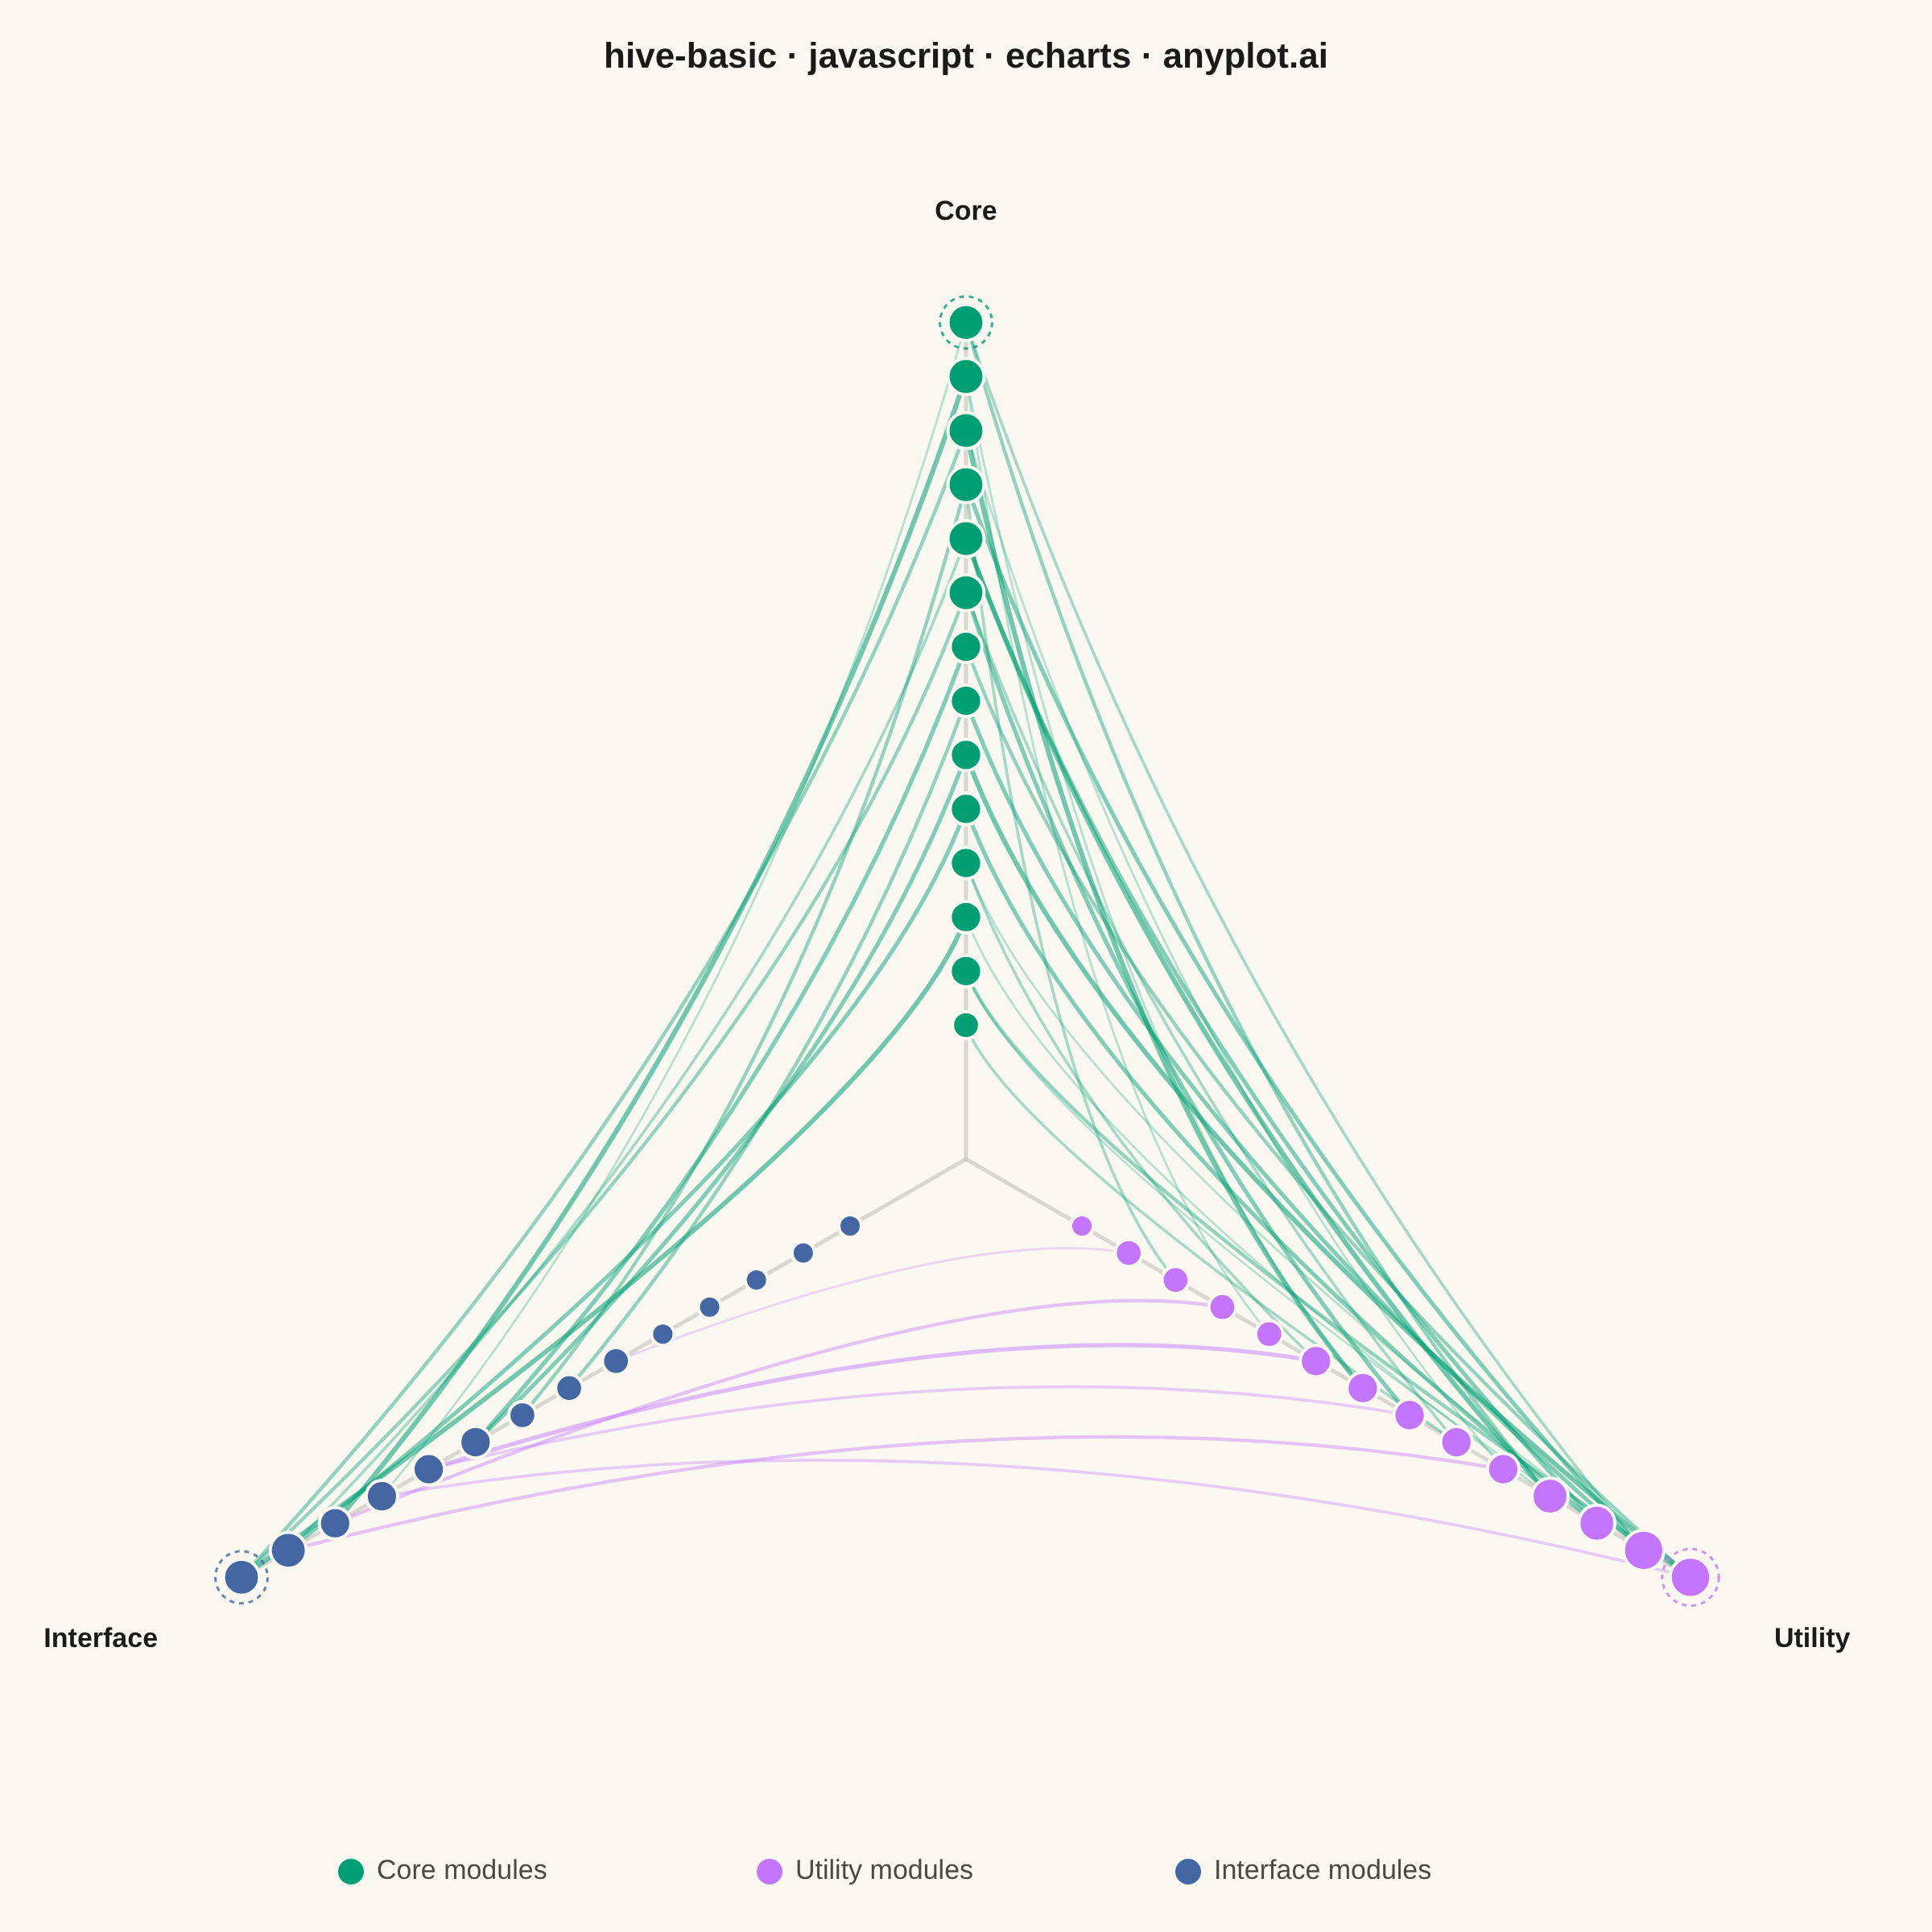
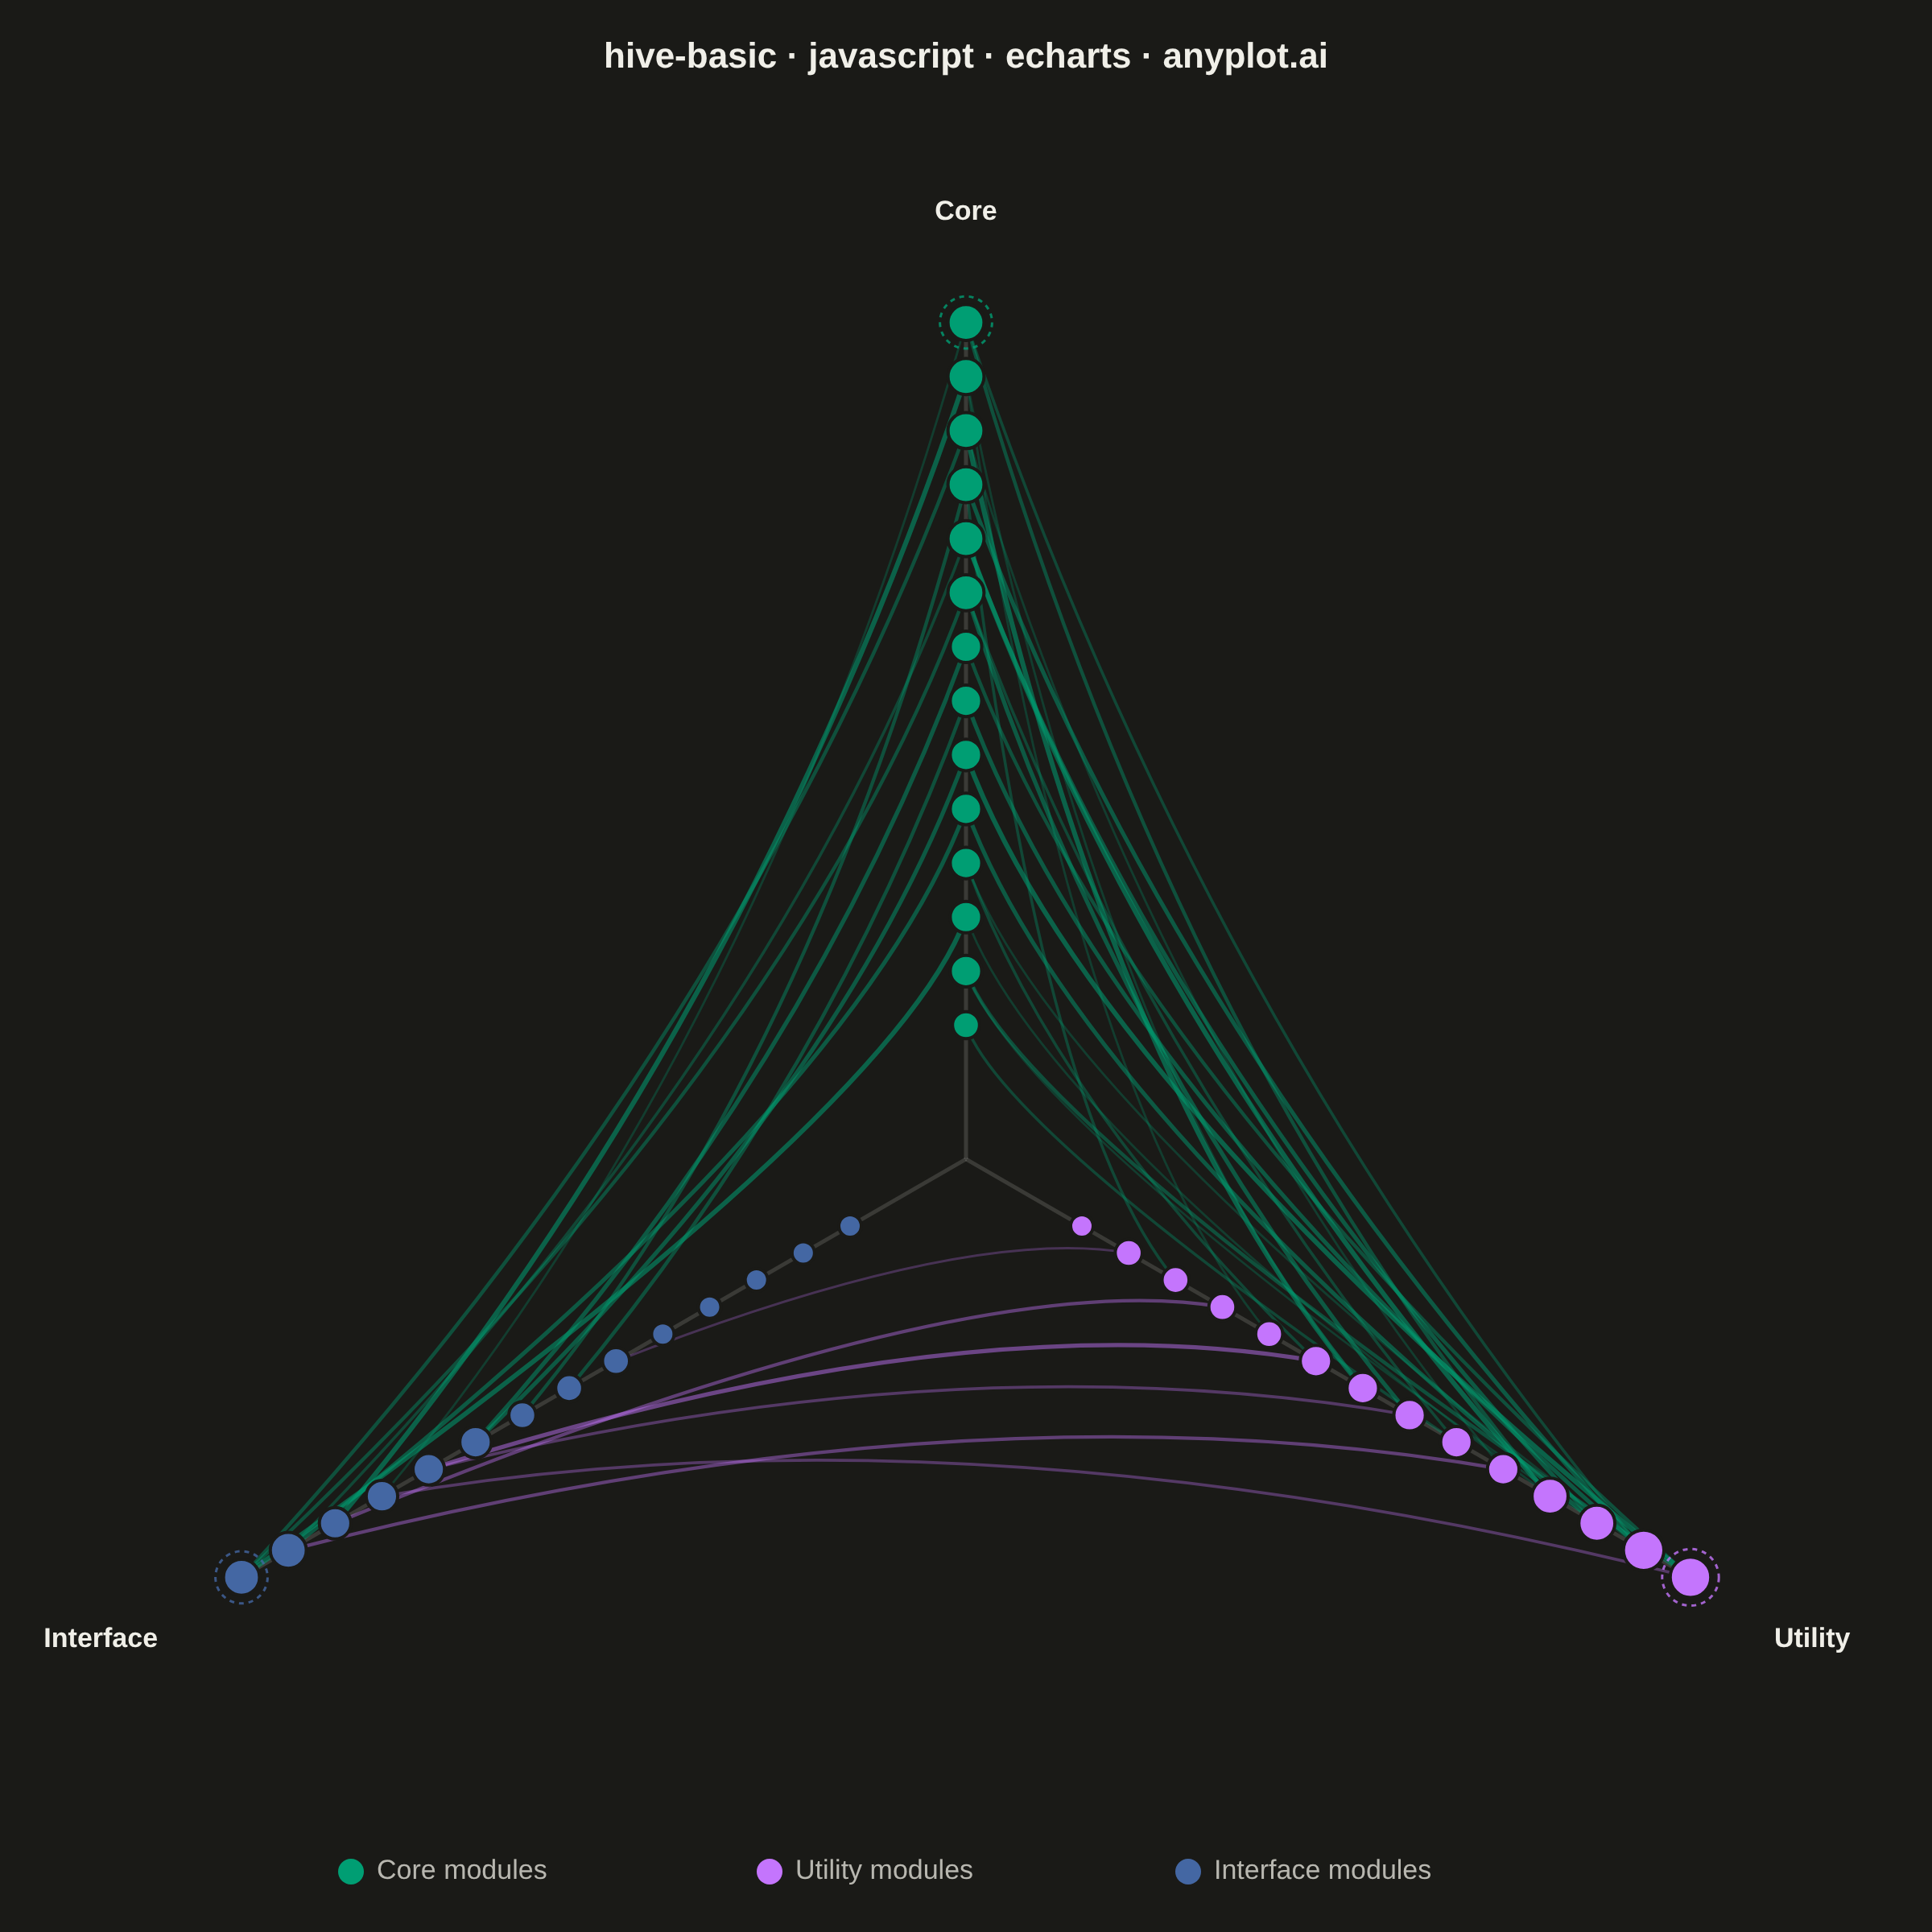
The same plot in 14 other libraries — JavaScript: Chart.js, D3.js, Highcharts, MUI X Charts; Python: Altair, Bokeh, lets-plot, Matplotlib, Plotly, plotnine, Pygal, Seaborn; R: ggplot2; Julia: Makie.jl. Compare all 15 side by side: Basic Hive Plot in Python, R, Julia and JavaScript.
A hive plot arranges network nodes on radial axes based on node properties (such as degree, category, or other attributes), enabling reproducible and directly comparable network visualizations. Unlike force-directed layouts which can produce different arrangements for identical networks, hive plots always render the same network identically, solving the "hairball" problem of traditional network graphs and making structural comparisons reliable.
// anyplot.ai
// hive-basic: Basic Hive Plot
// Library: echarts 6.1.0 | JavaScript 22.23.2
// Quality: 89/100 | Created: 2026-09-05
//# anyplot-orientation: square

const t = window.ANYPLOT_TOKENS;
const size = window.ANYPLOT_SIZE;

// --- Data: a software module dependency network -----------------------------
// Three axes group modules by type (core, utility, interface). Node position
// along its axis encodes total degree (few dependencies near the center, many
// near the rim) — this is what makes a hive plot reproducible: unlike a
// force-directed layout, the same network always lands in the same place.
let seed = 20260905 % 2147483647;
if (seed <= 0) seed += 2147483646;
function rand() {
  seed = (seed * 16807) % 2147483647;
  return (seed - 1) / 2147483646;
}

const CORE_NAMES = [
  "scheduler", "executor", "router", "dispatcher", "orchestrator", "planner",
  "coordinator", "allocator", "balancer", "monitor", "resolver", "validator",
  "session-mgr", "txn-mgr",
];
const UTILITY_NAMES = [
  "logging", "caching", "config", "metrics", "retry", "serializer",
  "compression", "encryption", "pooling", "throttling", "tracing",
  "formatting", "hashing", "timing",
];
const INTERFACE_NAMES = [
  "rest-api", "graphql-api", "grpc-api", "websocket-api", "cli", "admin-ui",
  "webhook", "event-bus", "plugin-sdk", "sdk-js", "sdk-python",
  "batch-import", "export-api", "health-check",
];

const AXES = [
  { key: "core", label: "Core", prefix: "core-", names: CORE_NAMES, angle: -90 },
  { key: "utility", label: "Utility", prefix: "util-", names: UTILITY_NAMES, angle: 30 },
  { key: "interface", label: "Interface", prefix: "iface-", names: INTERFACE_NAMES, angle: 150 },
];

const nodes = [];
const nodesByAxis = [[], [], []];
AXES.forEach((axis, axisIdx) => {
  axis.names.forEach((name) => {
    const globalIdx = nodes.length;
    nodes.push({ label: axis.prefix + name, axisIdx, degree: 0 });
    nodesByAxis[axisIdx].push(globalIdx);
  });
});

const edges = [];
function addEdge(sourceIdx, targetIdx, weight) {
  edges.push({ source: sourceIdx, target: targetIdx, weight });
  nodes[sourceIdx].degree += 1;
  nodes[targetIdx].degree += 1;
}

// Core modules depend on 1-2 utility modules, and often expose 0-1 interfaces.
nodesByAxis[0].forEach((coreIdx) => {
  const utilCount = 1 + Math.floor(rand() * 2);
  const chosen = new Set();
  while (chosen.size < utilCount) {
    chosen.add(nodesByAxis[1][Math.floor(rand() * nodesByAxis[1].length)]);
  }
  chosen.forEach((utilIdx) => addEdge(coreIdx, utilIdx, 1 + Math.floor(rand() * 5)));

  if (rand() < 0.7) {
    const ifaceIdx = nodesByAxis[2][Math.floor(rand() * nodesByAxis[2].length)];
    addEdge(coreIdx, ifaceIdx, 1 + Math.floor(rand() * 5));
  }
});

// Utility modules sometimes back an interface directly (e.g. a metrics endpoint).
nodesByAxis[1].forEach((utilIdx) => {
  if (rand() < 0.55) {
    const ifaceIdx = nodesByAxis[2][Math.floor(rand() * nodesByAxis[2].length)];
    addEdge(utilIdx, ifaceIdx, 1 + Math.floor(rand() * 5));
  }
});

// --- Radial layout: rank-order nodes on each axis by degree ------------------
// The three axes point up (Core) and down-left/down-right (Interface/Utility),
// so the triangle's vertical and horizontal reach differ — size and center the
// layout from the actual axis geometry rather than assuming a symmetric circle,
// so the canvas margins above/below/left/right come out even.
const axisAngleRad = AXES.map((axis) => (axis.angle * Math.PI) / 180);
const sins = axisAngleRad.map(Math.sin);
const coss = axisAngleRad.map(Math.cos);
const topFactor = -Math.min(...sins, 0);
const bottomFactor = Math.max(...sins, 0);
const leftFactor = -Math.min(...coss, 0);
const rightFactor = Math.max(...coss, 0);

const titleClearance = 120;
const legendClearance = 140;
const sideMargin = 150;
const availableHeight = size.height - titleClearance - legendClearance;

const cx = size.width / 2;
const maxRadius = Math.min(
  (size.width - 2 * sideMargin) / (leftFactor + rightFactor),
  availableHeight / (topFactor + bottomFactor),
);
const apexY = titleClearance + (availableHeight - (topFactor + bottomFactor) * maxRadius) / 2;
const cy = apexY + topFactor * maxRadius;
const innerRadius = maxRadius * 0.16;

const hubIndices = [];
nodesByAxis.forEach((indices) => {
  const ranked = [...indices].sort((a, b) => nodes[a].degree - nodes[b].degree);
  ranked.forEach((globalIdx, rank) => {
    const frac = ranked.length > 1 ? rank / (ranked.length - 1) : 0;
    nodes[globalIdx].radius = innerRadius + frac * (maxRadius - innerRadius);
  });
  hubIndices.push(ranked[ranked.length - 1]);
});
AXES.forEach((axis, axisIdx) => {
  nodesByAxis[axisIdx].forEach((globalIdx) => {
    nodes[globalIdx].angle = axisAngleRad[axisIdx];
  });
});

function toXY(radius, angle) {
  return [cx + radius * Math.cos(angle), cy + radius * Math.sin(angle)];
}
function circularMean(a, b) {
  const y = (Math.sin(a) + Math.sin(b)) / 2;
  const x = (Math.cos(a) + Math.cos(b)) / 2;
  return Math.atan2(y, x);
}
function nodeRadius(node) {
  return 7 + node.degree * 1.4;
}

// --- Render: axes, edges (bowed toward center), nodes ------------------------
function renderAxis(params) {
  const axis = AXES[params.dataIndex];
  const angleRad = (axis.angle * Math.PI) / 180;
  const [ex, ey] = toXY(maxRadius, angleRad);
  const [lx, ly] = toXY(maxRadius + 60, angleRad);
  const cosA = Math.cos(angleRad);
  const sinA = Math.sin(angleRad);
  return {
    type: "group",
    children: [
      {
        type: "line",
        shape: { x1: cx, y1: cy, x2: ex, y2: ey },
        style: { stroke: t.grid, lineWidth: 2.5 },
      },
      {
        type: "text",
        x: lx,
        y: ly,
        style: {
          text: axis.label,
          fill: t.ink,
          fontSize: 17,
          fontWeight: 600,
          align: cosA > 0.3 ? "left" : cosA < -0.3 ? "right" : "center",
          verticalAlign: sinA < -0.3 ? "bottom" : sinA > 0.3 ? "top" : "middle",
        },
      },
    ],
  };
}

function renderEdge(params) {
  const edge = edges[params.dataIndex];
  const source = nodes[edge.source];
  const target = nodes[edge.target];
  const [x1, y1] = toXY(source.radius, source.angle);
  const [x2, y2] = toXY(target.radius, target.angle);
  const midAngle = circularMean(source.angle, target.angle);
  const midRadius = Math.min(source.radius, target.radius) * 0.35;
  const [cpx, cpy] = toXY(midRadius, midAngle);
  return {
    type: "bezierCurve",
    shape: { x1, y1, x2, y2, cpx1: cpx, cpy1: cpy },
    style: {
      stroke: t.palette[source.axisIdx],
      fill: "none",
      lineWidth: 1 + (edge.weight / 5) * 2,
      opacity: 0.2 + (edge.weight / 5) * 0.35,
    },
  };
}

function renderNode(params) {
  const node = nodes[params.dataIndex];
  const [x, y] = toXY(node.radius, node.angle);
  return {
    type: "circle",
    shape: { cx: x, cy: y, r: nodeRadius(node) },
    style: { fill: t.palette[node.axisIdx], stroke: t.pageBg, lineWidth: 2 },
  };
}

// Highlight the busiest ("hub") module on each axis with a thin halo ring —
// sharpens the story of *which* node drives the axis's highest degree.
function renderHub(params) {
  const node = nodes[hubIndices[params.dataIndex]];
  const [x, y] = toXY(node.radius, node.angle);
  return {
    type: "circle",
    shape: { cx: x, cy: y, r: nodeRadius(node) + 5 },
    style: {
      fill: "none",
      stroke: t.palette[node.axisIdx],
      lineWidth: 1.5,
      lineDash: [3, 3],
      opacity: 0.8,
    },
  };
}

// --- Legend ------------------------------------------------------------------
const legendItemWidth = 260;
const legendY = size.height - 46;
const legendStartX = cx - (AXES.length * legendItemWidth) / 2;
const legend = AXES.map((axis, i) => ({
  type: "group",
  left: legendStartX + i * legendItemWidth,
  top: legendY,
  children: [
    { type: "circle", shape: { cx: 8, cy: 8, r: 8 }, style: { fill: t.palette[i] } },
    {
      type: "text",
      x: 24,
      y: 8,
      style: { text: `${axis.label} modules`, fill: t.inkSoft, fontSize: 17, verticalAlign: "middle" },
    },
  ],
}));

// --- Init + option ------------------------------------------------------------
const chart = echarts.init(document.getElementById("container"));

chart.setOption({
  animation: false,
  color: t.palette,
  backgroundColor: "transparent",
  title: {
    text: "hive-basic · javascript · echarts · anyplot.ai",
    left: "center",
    top: 20,
    textStyle: { color: t.ink, fontSize: 22 },
  },
  tooltip: {
    backgroundColor: t.elevatedBg,
    borderColor: t.grid,
    textStyle: { color: t.ink },
  },
  graphic: legend,
  series: [
    {
      type: "custom",
      coordinateSystem: "none",
      renderItem: renderAxis,
      data: AXES.map((_, i) => i),
      silent: true,
      z: 1,
    },
    {
      type: "custom",
      coordinateSystem: "none",
      renderItem: renderEdge,
      data: edges.map((_, i) => i),
      z: 2,
      tooltip: {
        formatter: (params) => {
          const edge = edges[params.dataIndex];
          return `${nodes[edge.source].label} → ${nodes[edge.target].label}<br/>Weight: ${edge.weight}`;
        },
      },
    },
    {
      type: "custom",
      coordinateSystem: "none",
      renderItem: renderNode,
      data: nodes.map((_, i) => i),
      z: 3,
      tooltip: {
        formatter: (params) => {
          const node = nodes[params.dataIndex];
          return `${node.label}<br/>Category: ${AXES[node.axisIdx].label}<br/>Connections: ${node.degree}`;
        },
      },
    },
    {
      type: "custom",
      coordinateSystem: "none",
      renderItem: renderHub,
      data: hubIndices.map((_, i) => i),
      z: 4,
      silent: true,
    },
  ],
});
Runnable source as JSON, for any HTTP client: https://api.anyplot.ai/specs/hive-basic/echarts/code. Any spec id and library id listed in llms-full.txt fit the same URL shape; every URL below is complete and callable.
{
  "spec_id": "hive-basic",
  "language": "javascript",
  "library": "echarts",
  "page": "https://anyplot.ai/hive-basic/javascript/echarts",
  "hub": "https://anyplot.ai/hive-basic",
  "code_json": "https://api.anyplot.ai/specs/hive-basic/echarts/code",
  "spec_json": "https://api.anyplot.ai/specs/hive-basic",
  "render_light_png": "https://storage.googleapis.com/anyplot-images/plots/hive-basic/javascript/echarts/plot-light.png",
  "render_dark_png": "https://storage.googleapis.com/anyplot-images/plots/hive-basic/javascript/echarts/plot-dark.png",
  "interactive_light_html": "https://storage.googleapis.com/anyplot-images/plots/hive-basic/javascript/echarts/plot-light.html",
  "interactive_dark_html": "https://storage.googleapis.com/anyplot-images/plots/hive-basic/javascript/echarts/plot-dark.html",
  "quality_score": 89.0,
  "license": "MIT",
  "guide": "https://anyplot.ai/llms.txt"
}
Part of Basic Hive Plot on anyplot.ai.