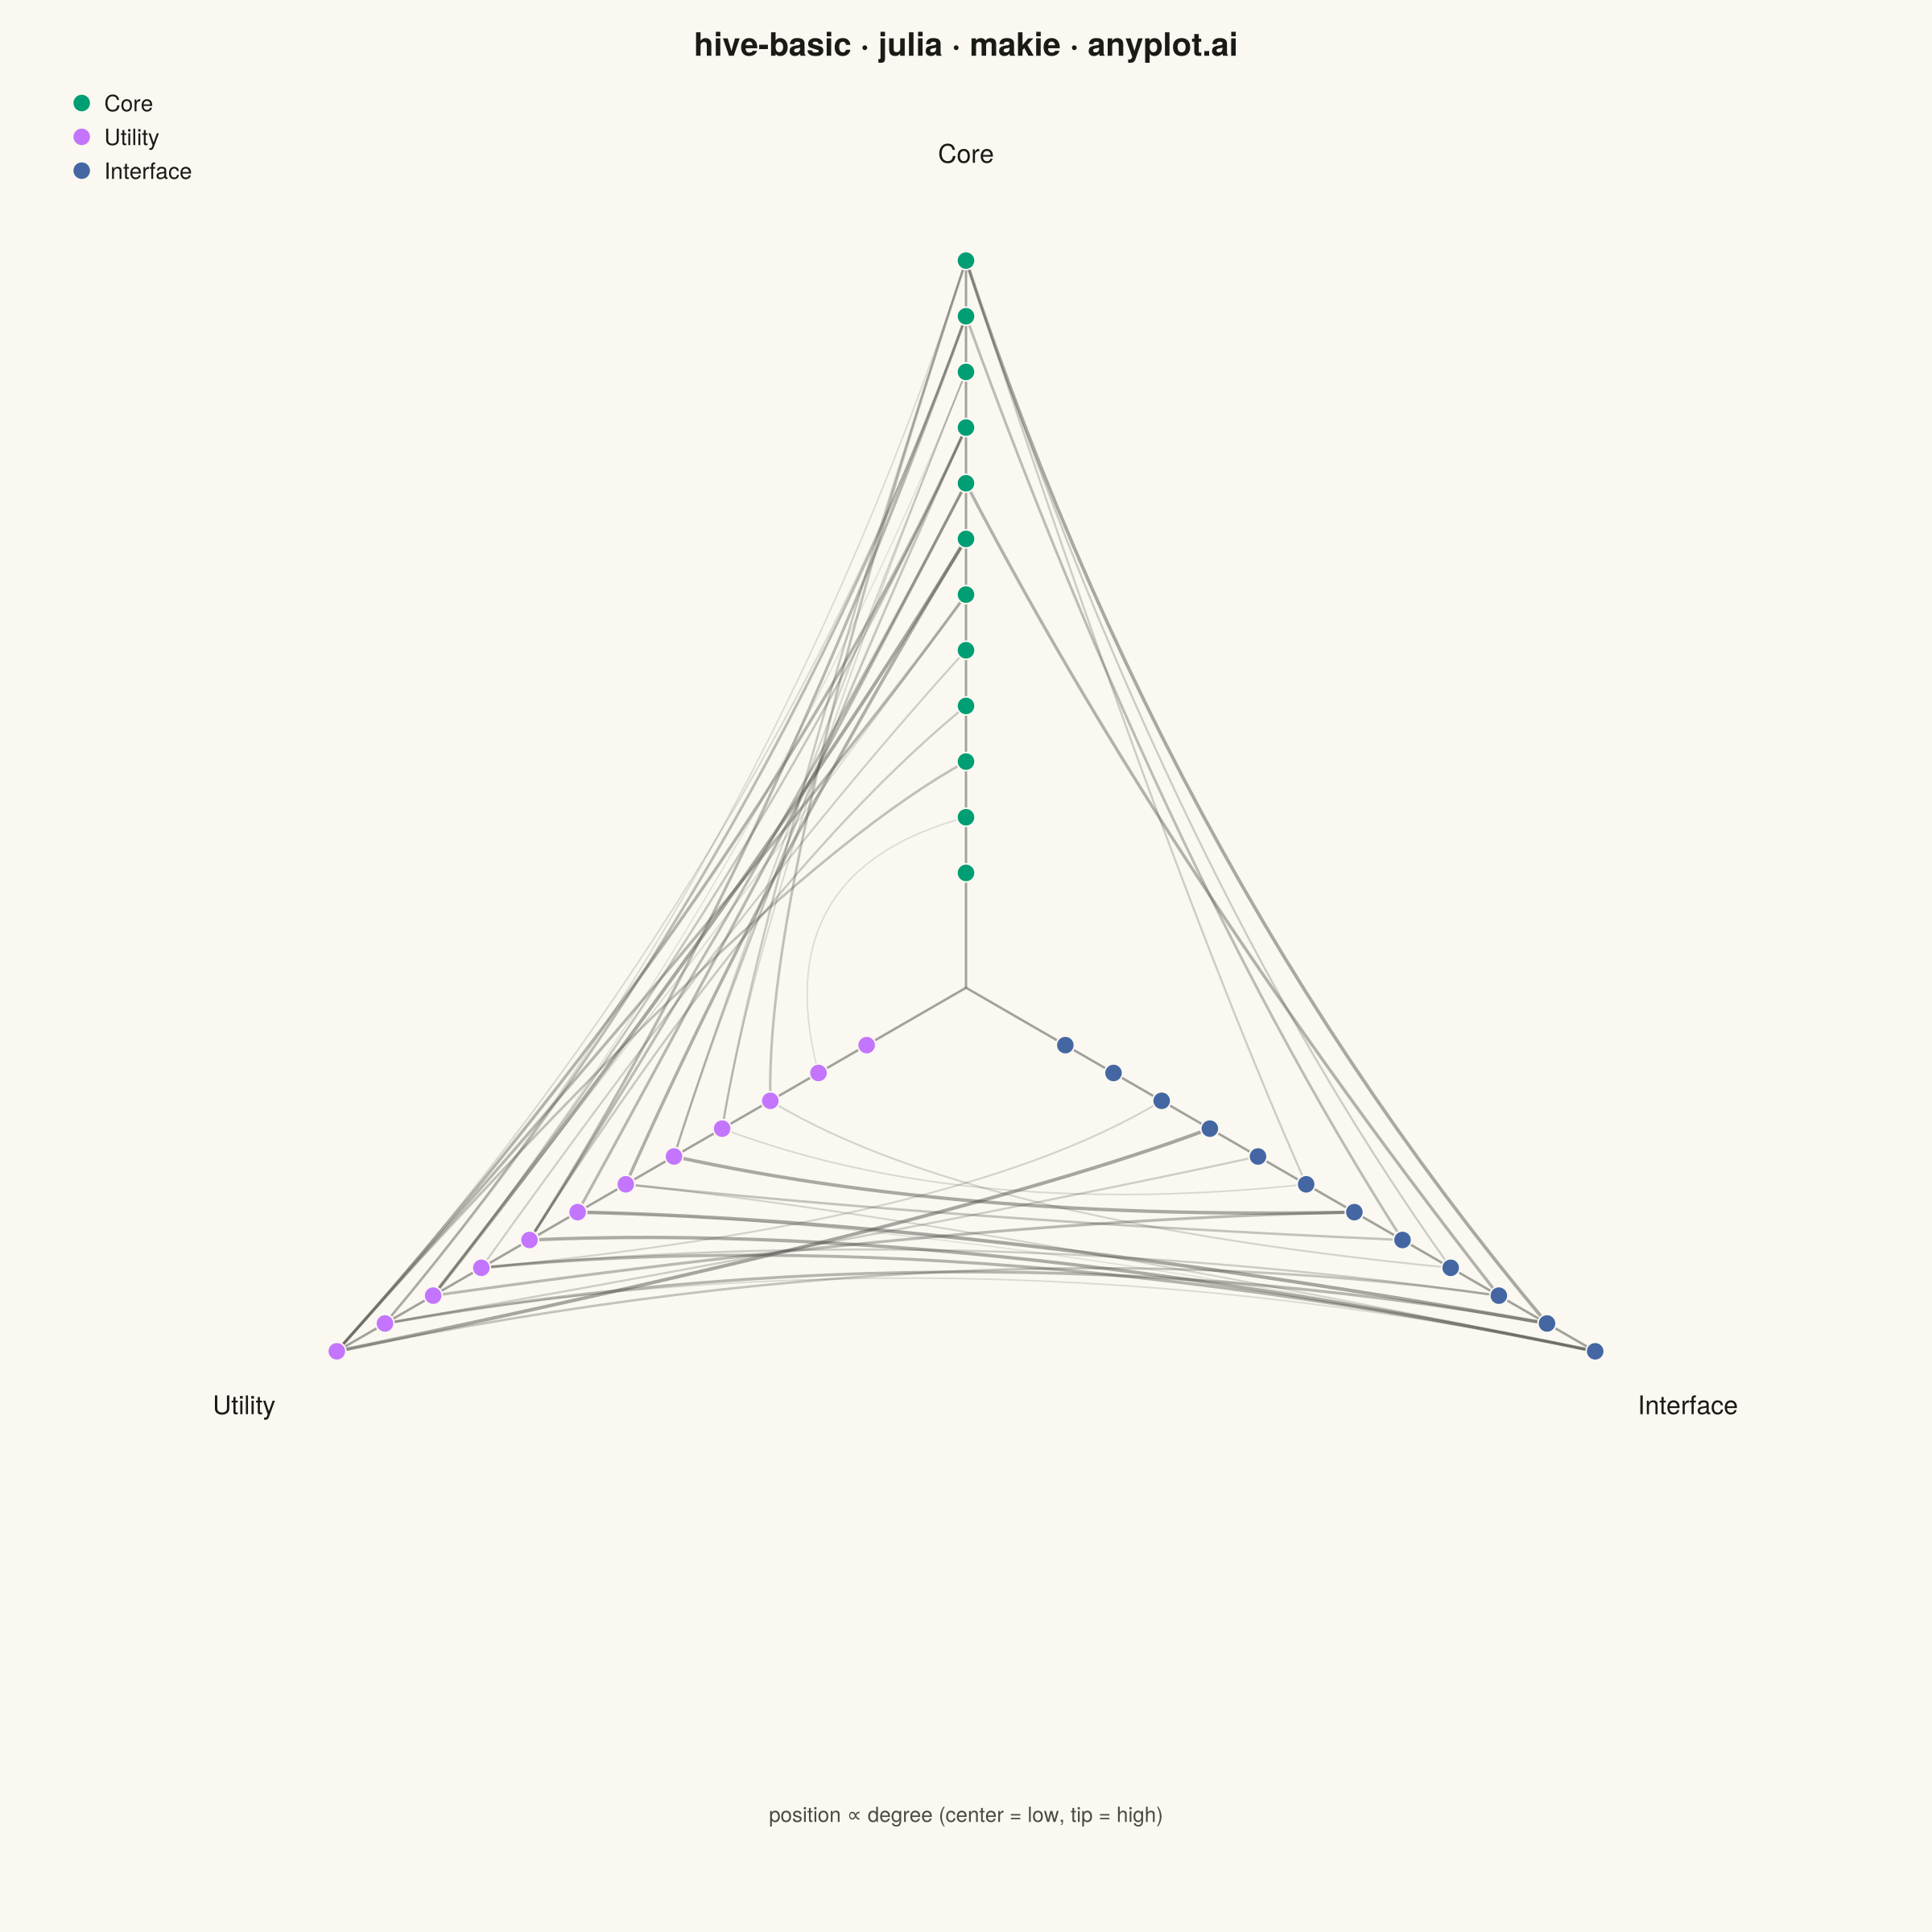
The same plot in 14 other libraries — Python: Altair, Bokeh, lets-plot, Matplotlib, Plotly, plotnine, Pygal, Seaborn; R: ggplot2; JavaScript: Chart.js, D3.js, Apache ECharts, Highcharts, MUI X Charts. Compare all 15 side by side: Basic Hive Plot in Python, R, Julia and JavaScript.
A hive plot arranges network nodes on radial axes based on node properties (such as degree, category, or other attributes), enabling reproducible and directly comparable network visualizations. Unlike force-directed layouts which can produce different arrangements for identical networks, hive plots always render the same network identically, solving the "hairball" problem of traditional network graphs and making structural comparisons reliable.
# anyplot.ai
# hive-basic: Basic Hive Plot
# Library: makie 0.21.9 | Julia 1.11.9
# Quality: 87/100 | Created: 2026-09-05

using CairoMakie
using Colors
using Random

Random.seed!(42)

# --- Theme tokens (see prompts/default-style-guide.md "Theme-adaptive Chrome") ----
const THEME    = get(ENV, "ANYPLOT_THEME", "light")
const PAGE_BG  = THEME == "light" ? colorant"#FAF8F1" : colorant"#1A1A17"
const INK      = THEME == "light" ? colorant"#1A1A17" : colorant"#F0EFE8"
const INK_SOFT = THEME == "light" ? colorant"#4A4A44" : colorant"#B8B7B0"
const IMPRINT_PALETTE = [
    colorant"#009E73",  # 1 — Core (brand green, always first series)
    colorant"#C475FD",  # 2 — Utility (lavender)
    colorant"#4467A3",  # 3 — Interface (blue)
]

# --- Data: a software module dependency network -----------------------------
# 3 radial axes grouped by module type; node position along its axis encodes
# in-network degree so structurally similar modules always land at the same
# radius, making the plot directly comparable across versions/runs.
axis_names = ["Core", "Utility", "Interface"]
n_per_axis = 12
n_nodes = n_per_axis * length(axis_names)
node_axis = repeat(1:length(axis_names), inner = n_per_axis)  # 1=Core 2=Utility 3=Interface

# Dependency edges only connect modules on *different* axes — the classic
# hive-plot convention where axis membership, not adjacency, tells the story.
# Each edge also carries a strength `weight` (optional per spec), later shown
# via line width/opacity — probabilities are kept modest to limit crossing
# density near the Utility–Interface base.
edges = Tuple{Int, Int, Float64}[]
for i in 1:n_nodes, j in (i + 1):n_nodes
    if node_axis[i] != node_axis[j]
        pair = sort([node_axis[i], node_axis[j]])
        edge_probability = pair == [1, 2] ? 0.16 : pair == [2, 3] ? 0.12 : 0.06
        if rand() < edge_probability
            weight = 1.0 + 4.0 * rand()  # dependency strength, 1 (weak) – 5 (strong)
            push!(edges, (i, j, weight))
        end
    end
end

degree = zeros(Int, n_nodes)
for (source, target, _) in edges
    degree[source] += 1
    degree[target] += 1
end

# --- Radial layout (shared scale across all 3 axes) --------------------------
const MIN_R = 0.15
const MAX_R = 0.95
axis_angles = deg2rad.([90.0, 210.0, 330.0])  # up, lower-left, lower-right

node_x = zeros(n_nodes)
node_y = zeros(n_nodes)
for axis_idx in 1:length(axis_names)
    members = findall(==(axis_idx), node_axis)
    ranked = sort(members, by = n -> (degree[n], n))  # low → high degree, stable tie-break
    radii = range(MIN_R, MAX_R, length = length(ranked))
    angle = axis_angles[axis_idx]
    for (rank, n) in enumerate(ranked)
        node_x[n] = radii[rank] * cos(angle)
        node_y[n] = radii[rank] * sin(angle)
    end
end

# --- Plot ---------------------------------------------------------------------
title_text = "hive-basic · julia · makie · anyplot.ai"

fig = Figure(
    size = (1200, 1200),
    fontsize = 14,
    backgroundcolor = PAGE_BG,
)

ax = Axis(
    fig[1, 1];
    title = title_text,
    titlesize = 20,
    titlecolor = INK,
    backgroundcolor = PAGE_BG,
    aspect = DataAspect(),
)
hidedecorations!(ax)
hidespines!(ax)
limits!(ax, -1.2, 1.2, -1.2, 1.2)

# Axis reference lines (subtle, structural — not data)
for angle in axis_angles
    lines!(
        ax, [0.0, MAX_R * cos(angle)], [0.0, MAX_R * sin(angle)];
        color = (INK_SOFT, 0.5), linewidth = 1.5,
    )
end

# Axis tip labels
label_r = MAX_R + 0.14
for (i, angle) in enumerate(axis_angles)
    text!(
        ax, label_r * cos(angle), label_r * sin(angle);
        text = axis_names[i], color = INK, fontsize = 16,
        align = (:center, :center),
    )
end

# Caption spelling out what radial position means — without it, the
# center→tip degree ordering (the whole point of a hive plot) is invisible
text!(
    ax, 0.0, -1.08;
    text = "position ∝ degree (center = low, tip = high)",
    color = INK_SOFT, fontsize = 13, align = (:center, :center),
)

# Edges — quadratic Bezier curves bowed toward the origin (never through
# nodes on the third axis). Weak edges drawn first and kept faint/thin,
# strong edges drawn last and bolder — both de-clutters the base region and
# visualizes the optional edge-weight field via width/opacity.
for (source, target, weight) in sort(edges, by = e -> e[3])
    angle_a = axis_angles[node_axis[source]]
    angle_b = axis_angles[node_axis[target]]
    control_angle = atan(sin(angle_a) + sin(angle_b), cos(angle_a) + cos(angle_b))
    control_r = 0.32 * MAX_R
    p0x, p0y = node_x[source], node_y[source]
    p1x, p1y = control_r * cos(control_angle), control_r * sin(control_angle)
    p2x, p2y = node_x[target], node_y[target]
    t = range(0.0, 1.0, length = 30)
    curve_x = @. (1 - t)^2 * p0x + 2 * (1 - t) * t * p1x + t^2 * p2x
    curve_y = @. (1 - t)^2 * p0y + 2 * (1 - t) * t * p1y + t^2 * p2y
    weight_frac = (weight - 1.0) / 4.0  # 0 (weak) .. 1 (strong)
    edge_alpha = 0.14 + 0.34 * weight_frac
    edge_width = 0.8 + 1.4 * weight_frac
    lines!(ax, curve_x, curve_y; color = (INK_SOFT, edge_alpha), linewidth = edge_width)
end

# Nodes — colored by axis category (Imprint palette, first series always brand green)
for (i, name) in enumerate(axis_names)
    members = findall(==(i), node_axis)
    scatter!(
        ax, node_x[members], node_y[members];
        color = IMPRINT_PALETTE[i], markersize = 16,
        strokewidth = 1, strokecolor = PAGE_BG, label = name,
    )
end

axislegend(ax; position = :lt, framevisible = false, labelcolor = INK, patchsize = (18, 18))

# --- Save -----------------------------------------------------------------
save("plot-$(THEME).png", fig; px_per_unit = 2)
Runnable source as JSON, for any HTTP client: https://api.anyplot.ai/specs/hive-basic/makie/code. Any spec id and library id listed in llms-full.txt fit the same URL shape; every URL below is complete and callable.
{
  "spec_id": "hive-basic",
  "language": "julia",
  "library": "makie",
  "page": "https://anyplot.ai/hive-basic/julia/makie",
  "hub": "https://anyplot.ai/hive-basic",
  "code_json": "https://api.anyplot.ai/specs/hive-basic/makie/code",
  "spec_json": "https://api.anyplot.ai/specs/hive-basic",
  "render_light_png": "https://storage.googleapis.com/anyplot-images/plots/hive-basic/julia/makie/plot-light.png",
  "render_dark_png": "https://storage.googleapis.com/anyplot-images/plots/hive-basic/julia/makie/plot-dark.png",
  "quality_score": 87.0,
  "license": "MIT",
  "guide": "https://anyplot.ai/llms.txt"
}
Part of Basic Hive Plot on anyplot.ai.