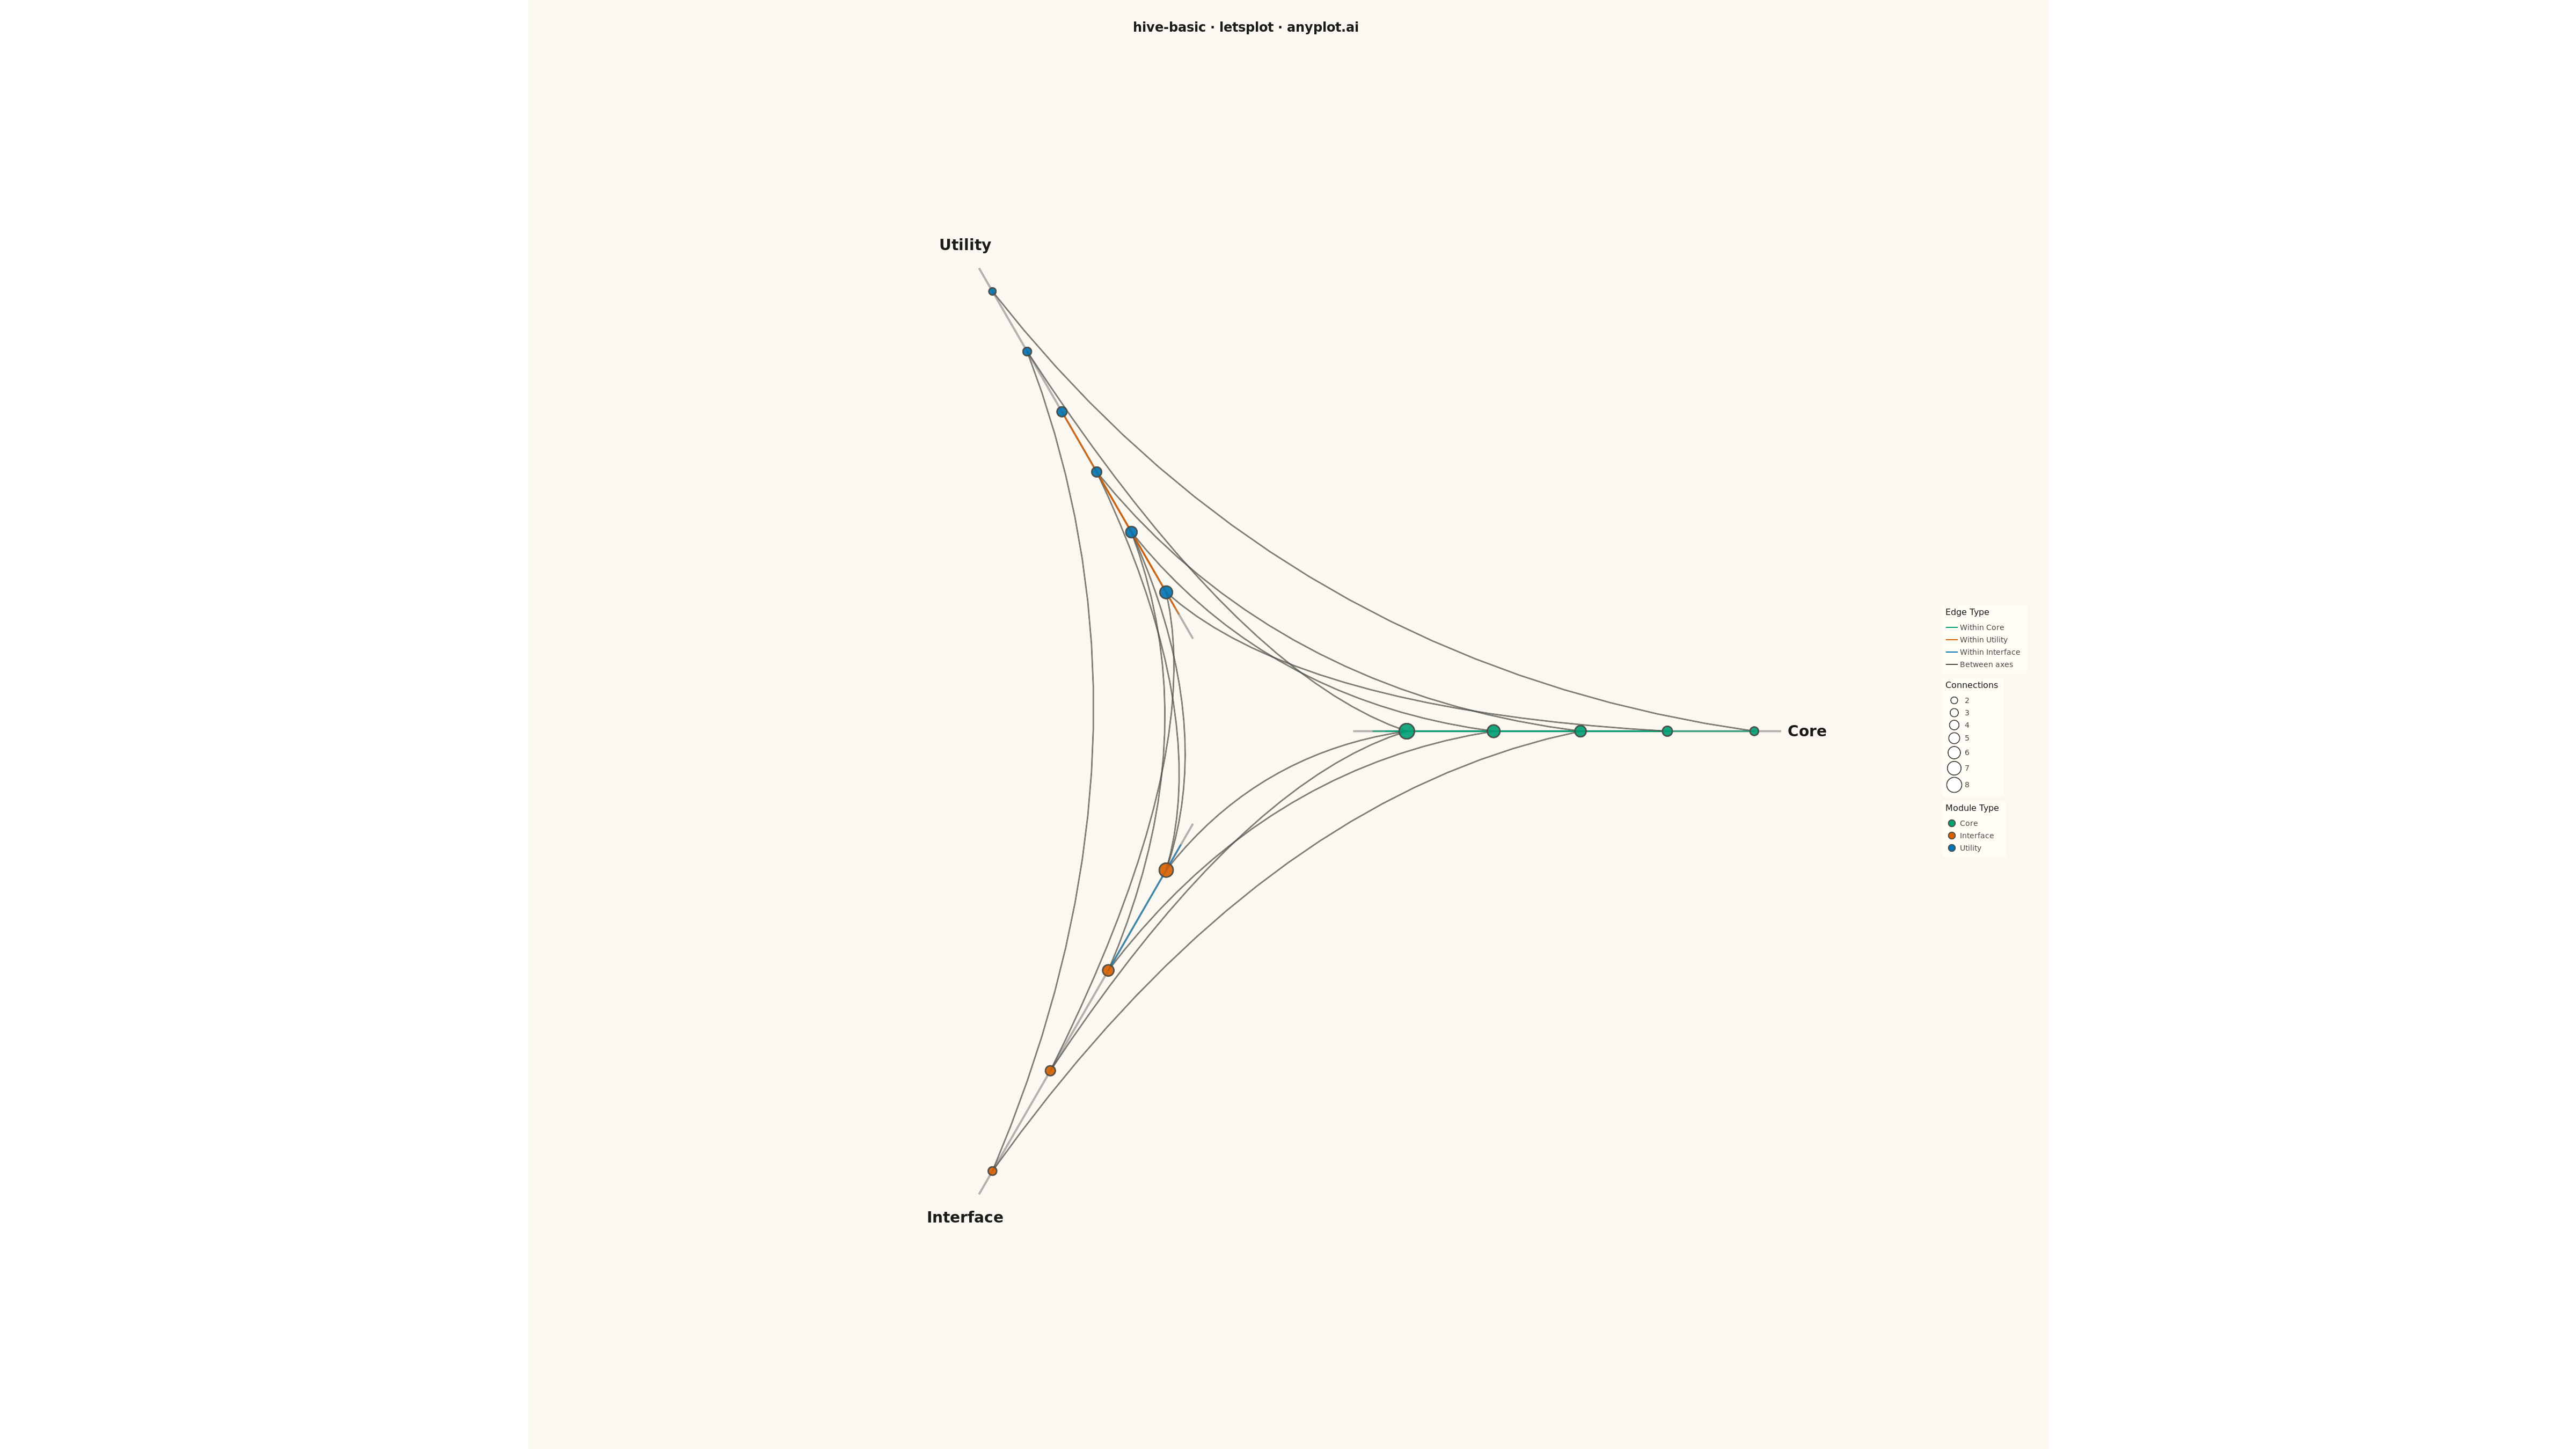
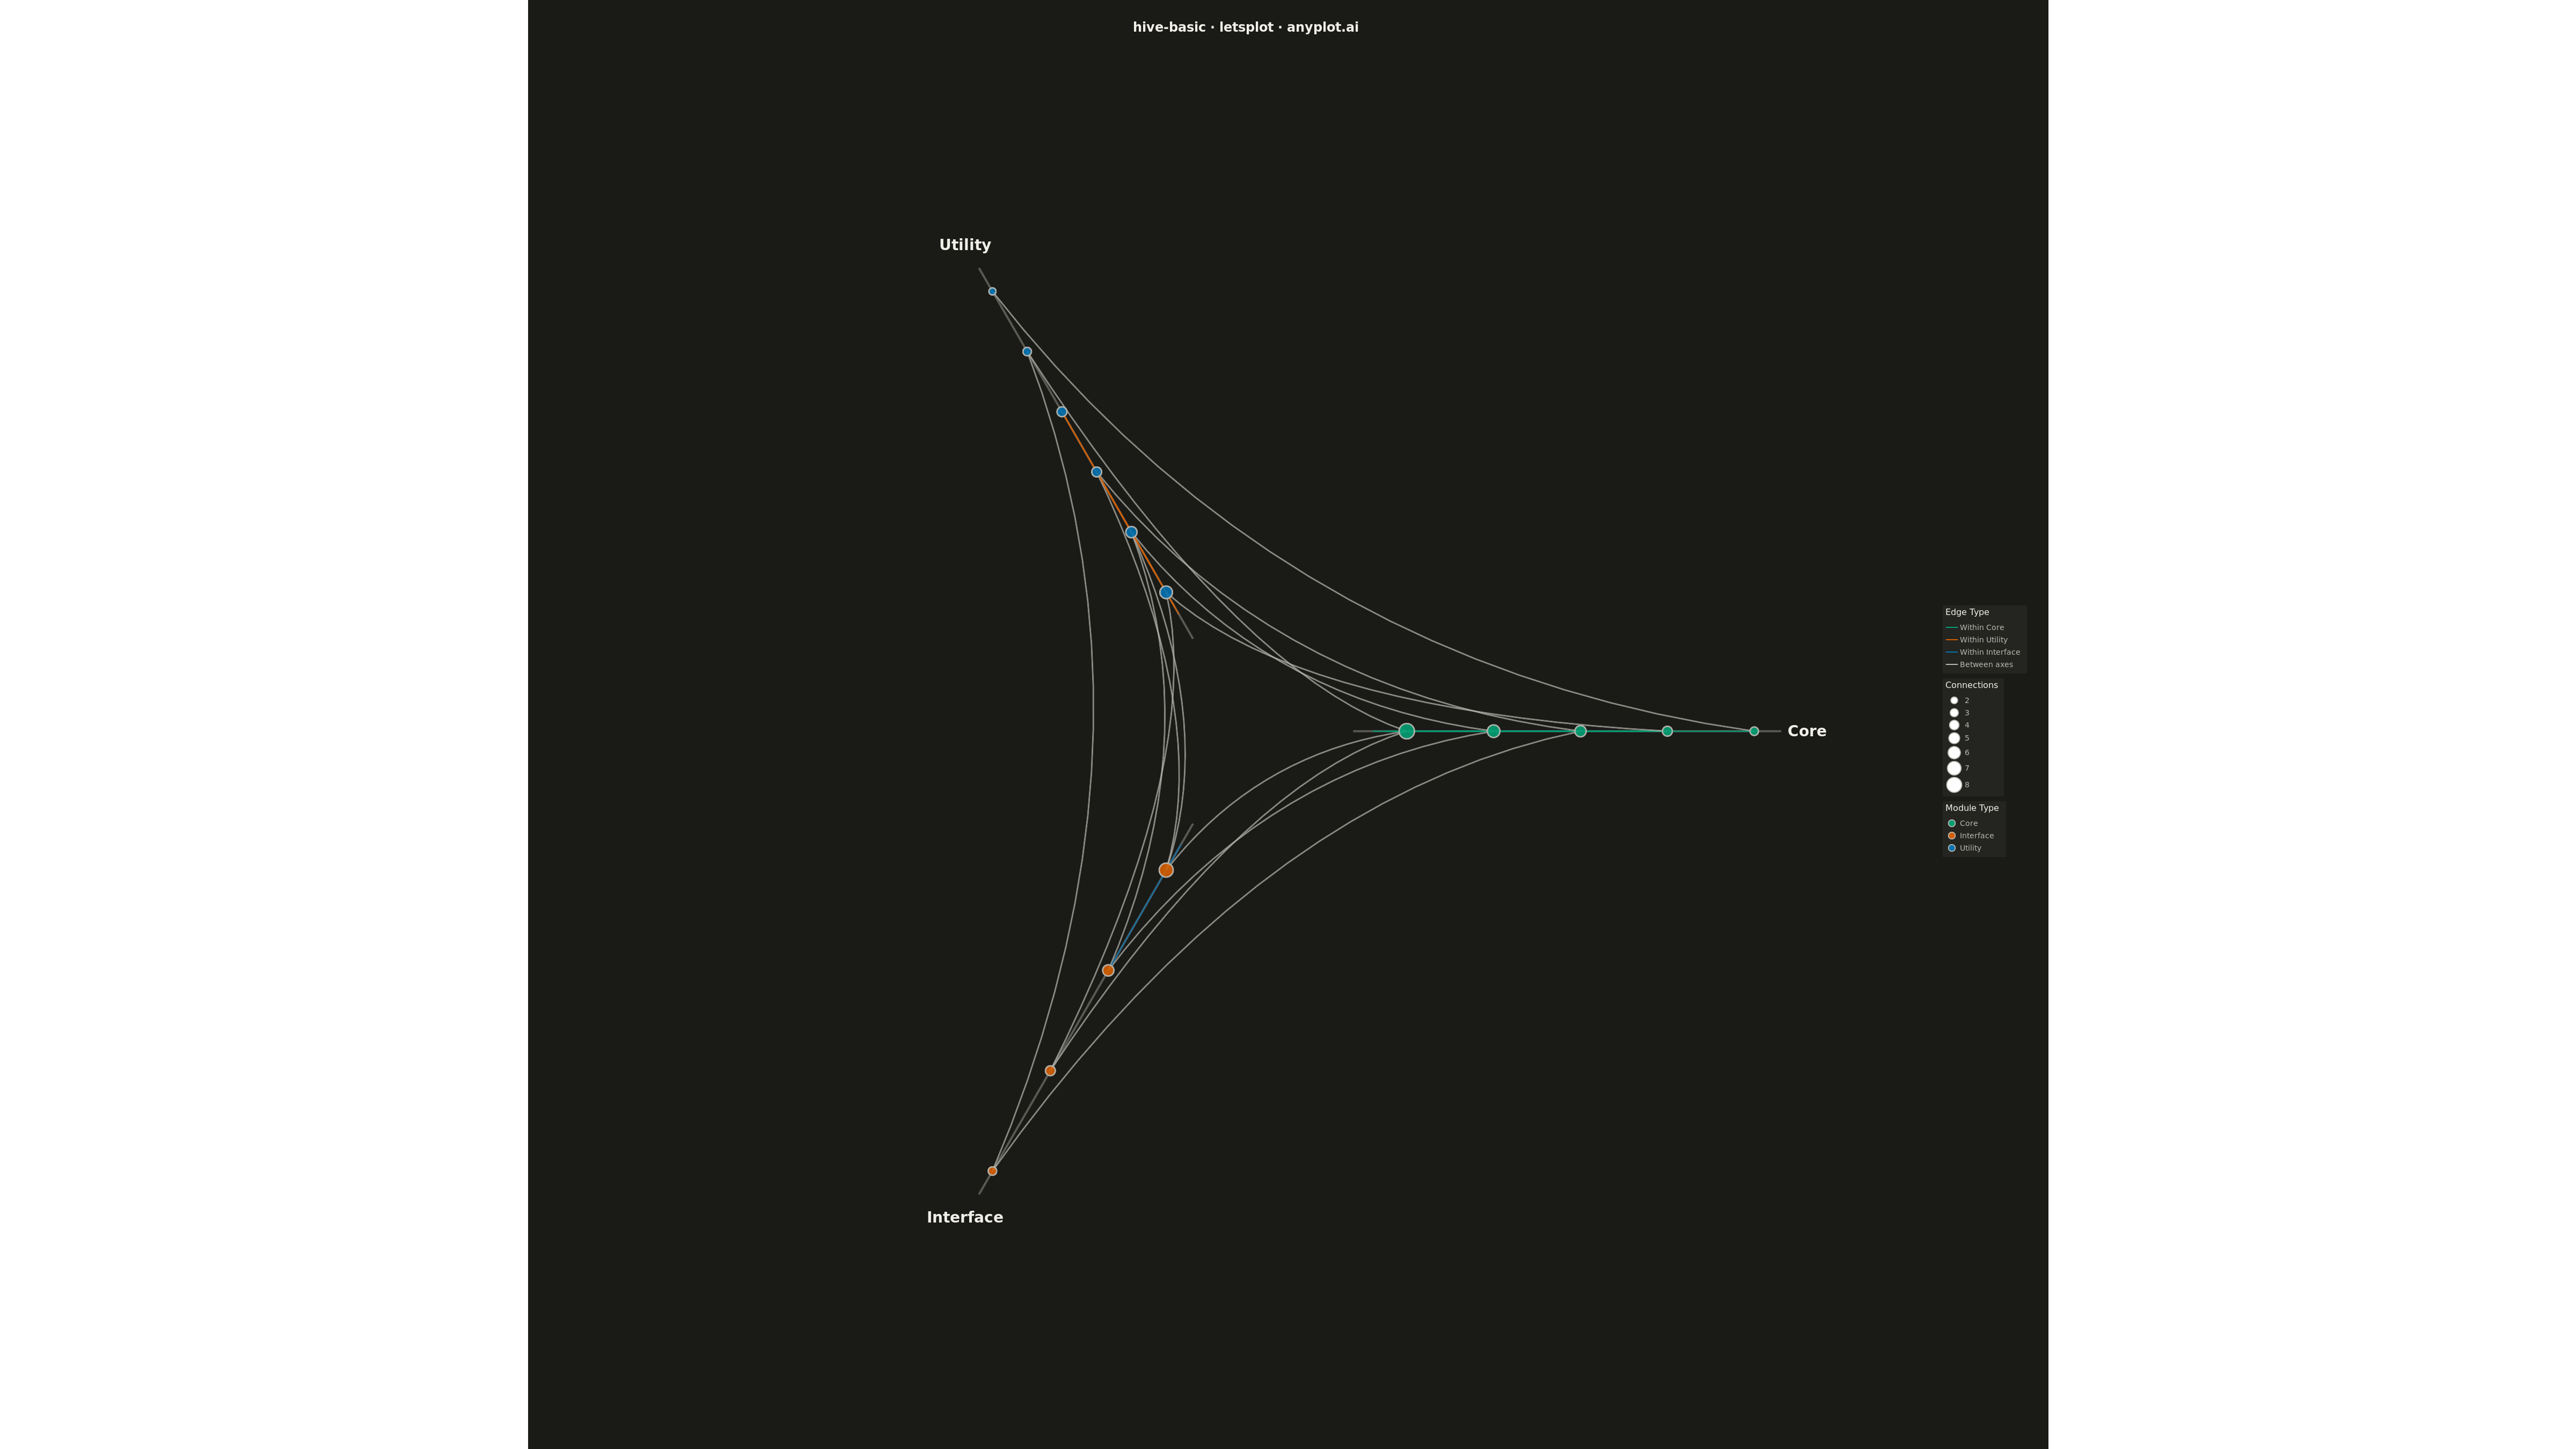
A hive plot arranges network nodes on radial axes based on node properties (such as degree, category, or other attributes), enabling reproducible and directly comparable network visualizations. Unlike force-directed layouts which can produce different arrangements for identical networks, hive plots always render the same network identically, solving the "hairball" problem of traditional network graphs and making structural comparisons reliable.
# ruff: noqa: F403, F405
"""anyplot.ai
hive-basic: Basic Hive Plot
Library: lets-plot | Python 3.13
Quality: pending | Created: 2025-12-24
"""

import os

import numpy as np
import pandas as pd
from lets_plot import *


LetsPlot.setup_html()

# Theme tokens (see prompts/default-style-guide.md)
THEME = os.getenv("ANYPLOT_THEME", "light")
PAGE_BG = "#FAF8F1" if THEME == "light" else "#1A1A17"
ELEVATED_BG = "#FFFDF6" if THEME == "light" else "#242420"
INK = "#1A1A17" if THEME == "light" else "#F0EFE8"
INK_SOFT = "#4A4A44" if THEME == "light" else "#B8B7B0"

# Okabe-Ito palette for categorical node types (positions 1-3)
IMPRINT = ["#009E73", "#C475FD", "#4467A3"]

# Data: Software module dependency network with 3 module types
np.random.seed(42)

# Define nodes with axis assignments (core, utility, interface modules)
nodes = [
    # Core modules (axis 0)
    {"id": "core_main", "axis": "Core", "degree": 8},
    {"id": "core_data", "axis": "Core", "degree": 6},
    {"id": "core_config", "axis": "Core", "degree": 5},
    {"id": "core_logger", "axis": "Core", "degree": 4},
    {"id": "core_cache", "axis": "Core", "degree": 3},
    # Utility modules (axis 1)
    {"id": "util_parser", "axis": "Utility", "degree": 5},
    {"id": "util_validator", "axis": "Utility", "degree": 4},
    {"id": "util_formatter", "axis": "Utility", "degree": 6},
    {"id": "util_crypto", "axis": "Utility", "degree": 3},
    {"id": "util_compress", "axis": "Utility", "degree": 2},
    {"id": "util_encode", "axis": "Utility", "degree": 4},
    # Interface modules (axis 2)
    {"id": "api_rest", "axis": "Interface", "degree": 7},
    {"id": "api_graphql", "axis": "Interface", "degree": 5},
    {"id": "api_websocket", "axis": "Interface", "degree": 4},
    {"id": "api_grpc", "axis": "Interface", "degree": 3},
]

# Define edges between modules
edges = [
    ("core_main", "core_data"),
    ("core_main", "core_config"),
    ("core_main", "core_logger"),
    ("core_data", "core_cache"),
    ("core_config", "core_logger"),
    ("util_parser", "core_data"),
    ("util_validator", "core_config"),
    ("util_formatter", "core_logger"),
    ("util_crypto", "core_main"),
    ("util_compress", "core_cache"),
    ("util_encode", "util_parser"),
    ("util_validator", "util_formatter"),
    ("api_rest", "core_main"),
    ("api_rest", "util_parser"),
    ("api_rest", "util_validator"),
    ("api_graphql", "core_data"),
    ("api_graphql", "util_parser"),
    ("api_websocket", "core_main"),
    ("api_websocket", "util_formatter"),
    ("api_grpc", "core_config"),
    ("api_grpc", "util_crypto"),
    ("api_rest", "api_graphql"),
    ("util_formatter", "util_encode"),
]

# Convert nodes to DataFrame and assign positions
nodes_df = pd.DataFrame(nodes)

# Define axis angles (radial positions for 3 axes, evenly spaced)
axis_angles = {"Core": 0, "Utility": 2 * np.pi / 3, "Interface": 4 * np.pi / 3}
axis_to_color_idx = {"Core": 0, "Utility": 1, "Interface": 2}

# Sort nodes by degree within each axis and assign radial position
nodes_df = nodes_df.sort_values(["axis", "degree"], ascending=[True, False])
nodes_df["radial_pos"] = 0.0

for axis in axis_angles.keys():
    mask = nodes_df["axis"] == axis
    n_nodes = mask.sum()
    # Position nodes along radius (0.3 to 1.0 to leave center space)
    nodes_df.loc[mask, "radial_pos"] = np.linspace(0.3, 0.95, n_nodes)

# Calculate x, y coordinates for each node
nodes_df["angle"] = nodes_df["axis"].map(axis_angles)
nodes_df["x"] = nodes_df["radial_pos"] * np.cos(nodes_df["angle"])
nodes_df["y"] = nodes_df["radial_pos"] * np.sin(nodes_df["angle"])

# Create node position lookup
node_positions = nodes_df.set_index("id")[["x", "y"]].to_dict("index")

# Create edge data with Bezier curve approximation (quadratic)
edge_data = []
for source, target in edges:
    if source not in node_positions or target not in node_positions:
        continue
    src_pos = node_positions[source]
    tgt_pos = node_positions[target]

    # Get axis info
    src_axis = nodes_df.loc[nodes_df["id"] == source, "axis"].values[0]
    tgt_axis = nodes_df.loc[nodes_df["id"] == target, "axis"].values[0]

    # Create curved path using quadratic Bezier through center offset
    # Control point closer to center for nice curves
    ctrl_x = (src_pos["x"] + tgt_pos["x"]) * 0.15
    ctrl_y = (src_pos["y"] + tgt_pos["y"]) * 0.15

    # Generate points along the Bezier curve
    t = np.linspace(0, 1, 20)
    bx = (1 - t) ** 2 * src_pos["x"] + 2 * (1 - t) * t * ctrl_x + t**2 * tgt_pos["x"]
    by = (1 - t) ** 2 * src_pos["y"] + 2 * (1 - t) * t * ctrl_y + t**2 * tgt_pos["y"]

    # Determine edge type for coloring
    if src_axis == tgt_axis:
        edge_type = f"Within {src_axis}"
    else:
        edge_type = "Between axes"

    for i in range(len(t)):
        edge_data.append({"x": bx[i], "y": by[i], "edge_id": f"{source}-{target}", "edge_type": edge_type})

edges_df = pd.DataFrame(edge_data)

# Create axis lines data
axis_lines = []
for axis, angle in axis_angles.items():
    # Line from center to outer edge (start at 0.2 to extend past nodes)
    r_vals = np.linspace(0.2, 1.0, 50)
    x_vals = r_vals * np.cos(angle)
    y_vals = r_vals * np.sin(angle)
    for i in range(len(r_vals)):
        axis_lines.append({"x": x_vals[i], "y": y_vals[i], "axis": axis})
axis_lines_df = pd.DataFrame(axis_lines)

# Create axis labels data - position labels further from center to avoid clipping
label_positions = []
for axis, angle in axis_angles.items():
    # Position labels at outer edge, with adjustments for visibility
    r = 1.05
    x = r * np.cos(angle)
    y = r * np.sin(angle)
    label_positions.append({"x": x, "y": y, "label": axis, "axis": axis})
labels_df = pd.DataFrame(label_positions)

# Map edges to colors using Okabe-Ito palette
edge_color_map = {}
for axis in axis_angles.keys():
    edge_color_map[f"Within {axis}"] = IMPRINT[axis_to_color_idx[axis]]
edge_color_map["Between axes"] = INK_SOFT

# Build the plot
plot = (
    ggplot()
    # Axis lines (theme-adaptive gray)
    + geom_path(aes(x="x", y="y", group="axis"), data=axis_lines_df, color=INK_SOFT, size=1.5, alpha=0.4)
    # Edges with curves (reduced alpha for better center visibility)
    + geom_path(aes(x="x", y="y", group="edge_id", color="edge_type"), data=edges_df, size=1.0, alpha=0.5)
    # Nodes
    + geom_point(
        aes(x="x", y="y", fill="axis", size="degree"), data=nodes_df, color=INK_SOFT, stroke=1.0, shape=21, alpha=0.9
    )
    # Axis labels (separate layer, not in legend)
    + geom_text(
        aes(x="x", y="y", label="label"), data=labels_df, size=14, fontface="bold", color=INK, show_legend=False
    )
    # Color scales using Okabe-Ito palette
    + scale_fill_manual(values=IMPRINT)
    + scale_color_manual(values=edge_color_map)
    + scale_size(range=[5, 12])
    # Styling - expand limits to show axis labels
    + coord_fixed(ratio=1, xlim=(-1.3, 1.3), ylim=(-1.3, 1.3))
    + labs(title="hive-basic · letsplot · anyplot.ai", fill="Module Type", size="Connections", color="Edge Type")
    + theme_void()
    + theme(
        plot_title=element_text(size=24, hjust=0.5, face="bold", color=INK),
        legend_title=element_text(size=16, color=INK),
        legend_text=element_text(size=14, color=INK_SOFT),
        legend_position="right",
        legend_background=element_rect(fill=ELEVATED_BG, color=INK_SOFT),
        plot_background=element_rect(fill=PAGE_BG, color=PAGE_BG),
        plot_margin=[40, 40, 40, 40],
    )
    + ggsize(1600, 900)
)

# Save as PNG (4800 × 2700 px with scale factor)
ggsave(plot, f"plot-{THEME}.png", scale=3)

# Save as HTML for interactive version
ggsave(plot, f"plot-{THEME}.html")
Runnable source as JSON, for any HTTP client: https://api.anyplot.ai/specs/hive-basic/letsplot/code. Any spec id and library id listed in llms-full.txt fit the same URL shape; every URL below is complete and callable.
{
  "spec_id": "hive-basic",
  "language": "python",
  "library": "letsplot",
  "page": "https://anyplot.ai/hive-basic/python/letsplot",
  "hub": "https://anyplot.ai/hive-basic",
  "code_json": "https://api.anyplot.ai/specs/hive-basic/letsplot/code",
  "spec_json": "https://api.anyplot.ai/specs/hive-basic",
  "render_light_png": "https://storage.googleapis.com/anyplot-images/plots/hive-basic/python/letsplot/plot-light.png",
  "render_dark_png": "https://storage.googleapis.com/anyplot-images/plots/hive-basic/python/letsplot/plot-dark.png",
  "interactive_light_html": "https://storage.googleapis.com/anyplot-images/plots/hive-basic/python/letsplot/plot-light.html",
  "interactive_dark_html": "https://storage.googleapis.com/anyplot-images/plots/hive-basic/python/letsplot/plot-dark.html",
  "quality_score": 86.0,
  "license": "MIT",
  "guide": "https://anyplot.ai/llms.txt"
}
Part of Basic Hive Plot on anyplot.ai.