Source code in 15 libraries — Python: Altair, Bokeh, lets-plot, Matplotlib, Plotly, plotnine, Pygal, Seaborn; R: ggplot2; Julia: Makie.jl; JavaScript: Chart.js, D3.js, Apache ECharts, Highcharts, MUI X Charts.
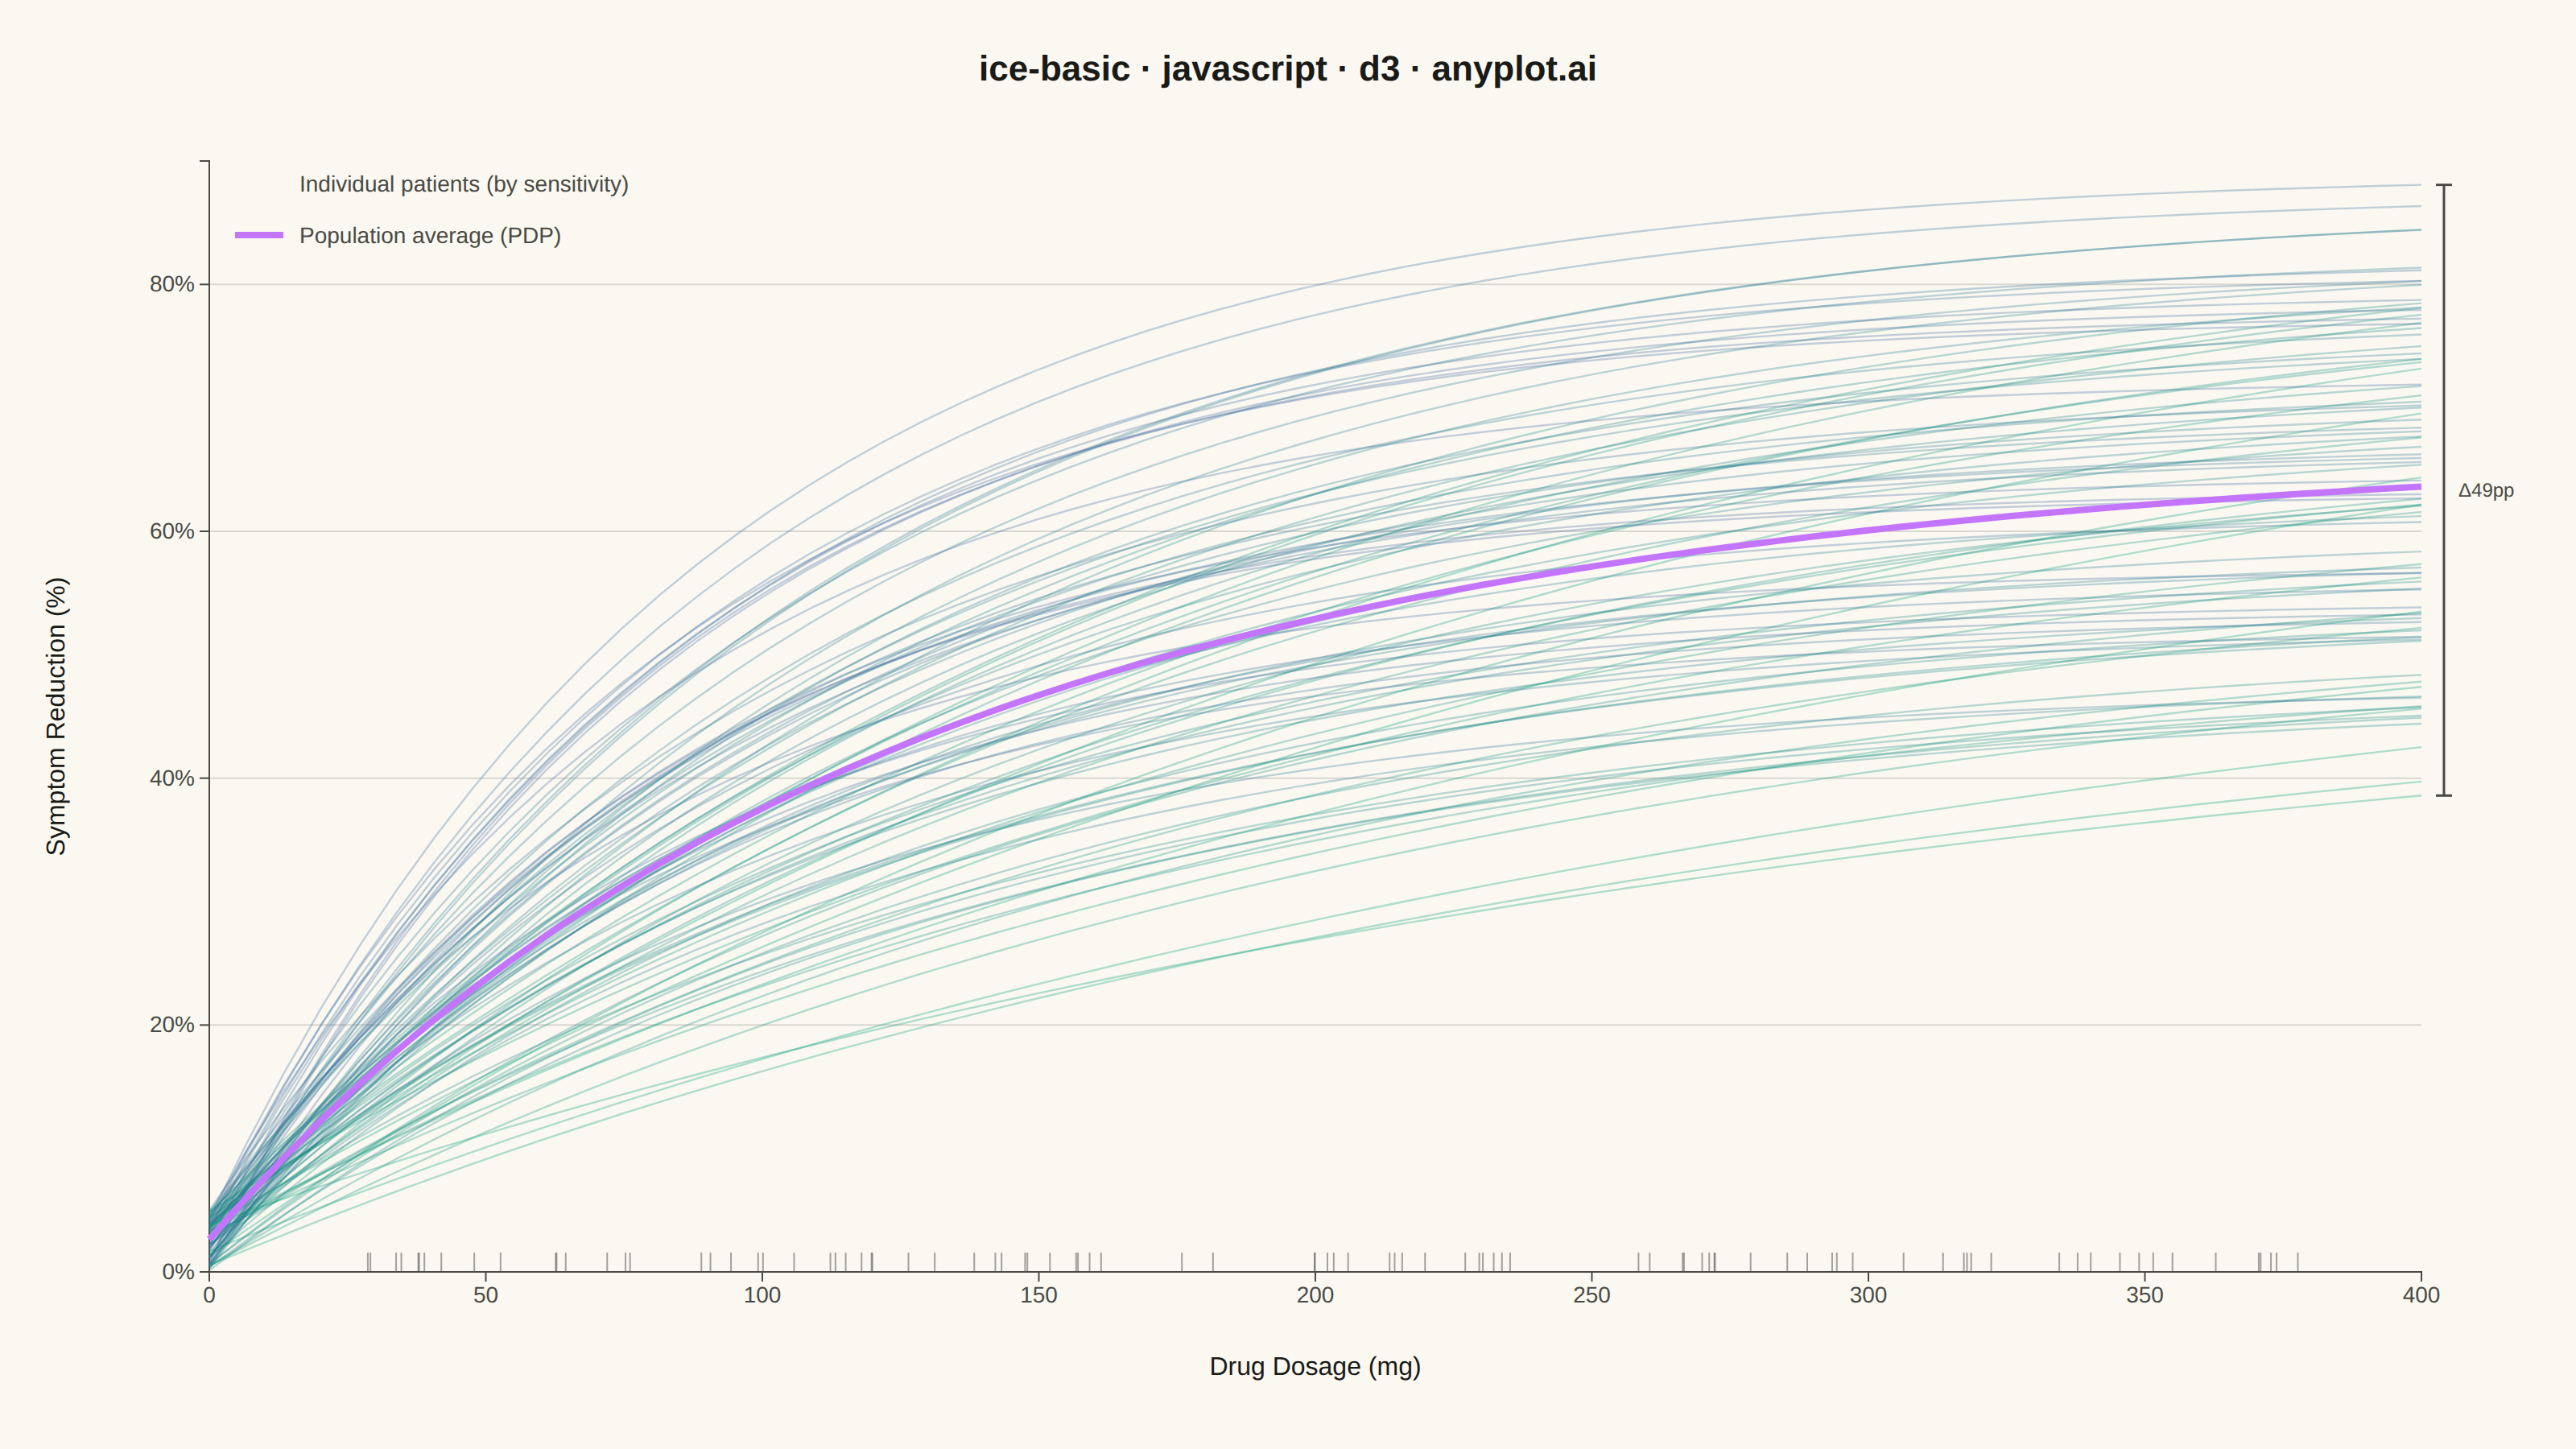
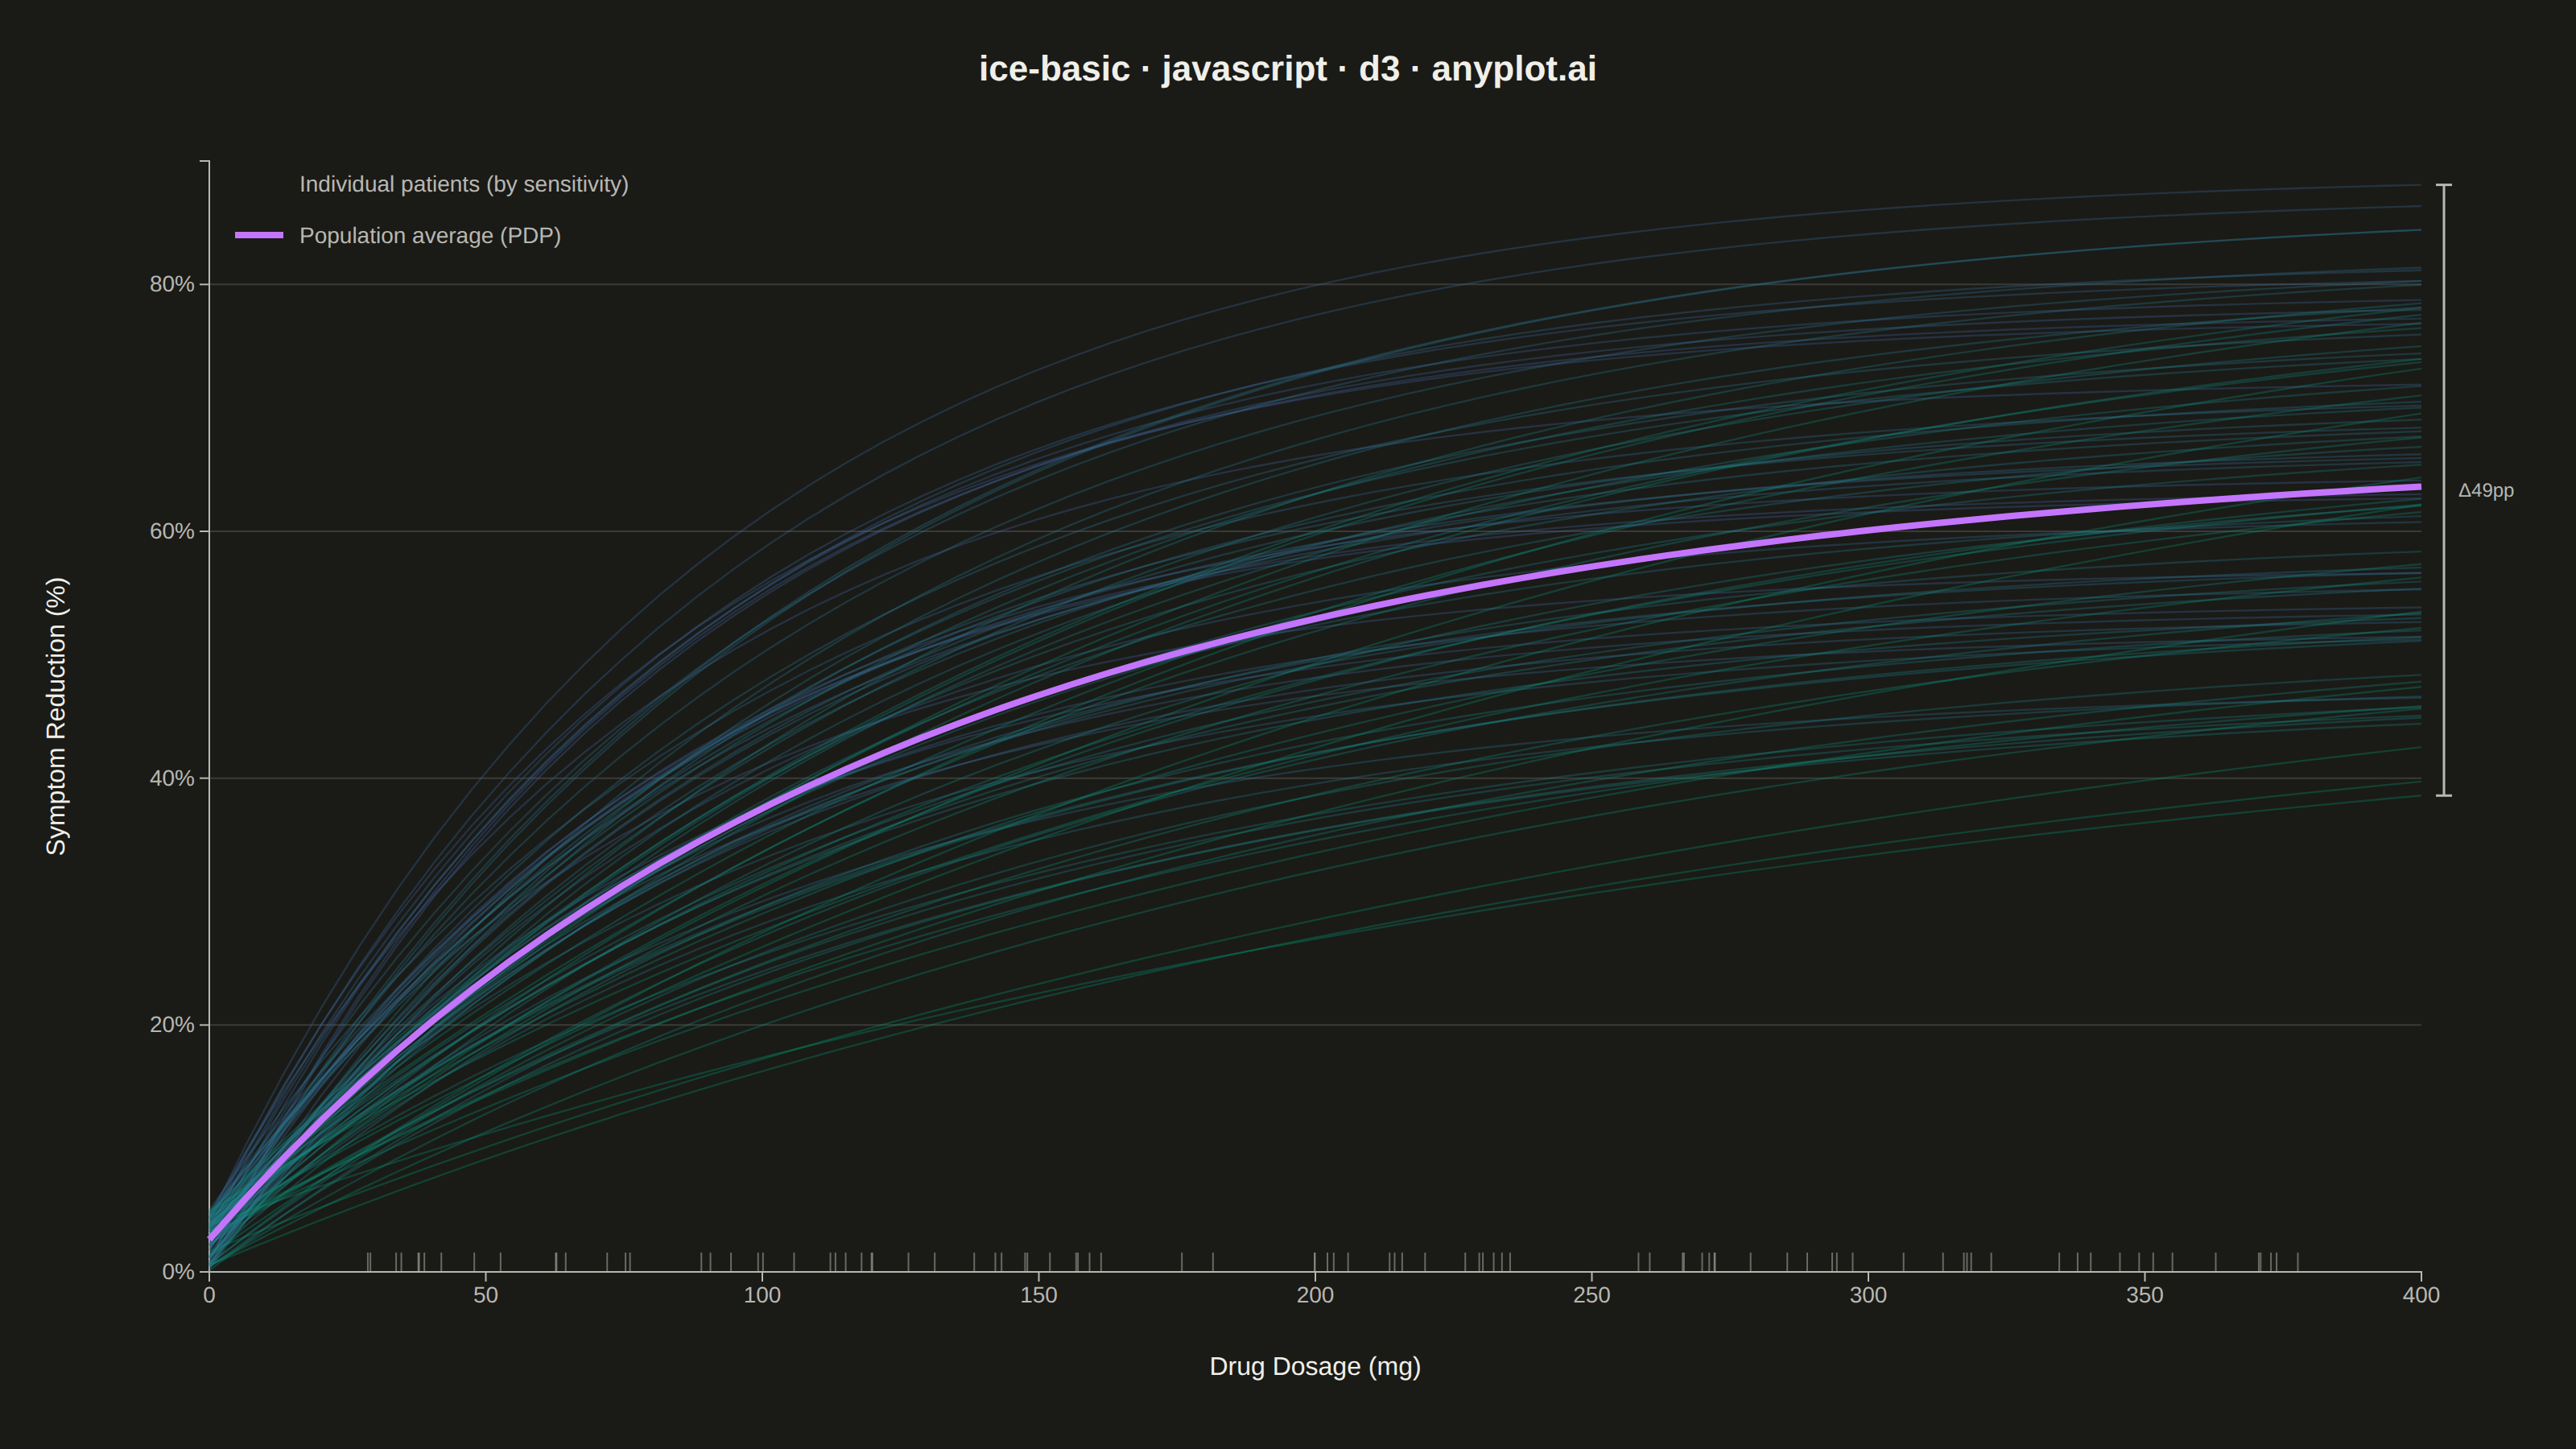
An Individual Conditional Expectation (ICE) plot visualizes how the predicted outcome of a machine learning model changes for each individual observation as a single feature varies across its range. Unlike partial dependence plots (PDP) that show the average marginal effect, ICE plots display one line per observation, revealing heterogeneous effects, feature interactions, and subgroup-specific behaviors that would be hidden by averaging. This makes ICE plots essential for detecting when a feature's effect varies across the population.
Preview render from the D3.js implementation.