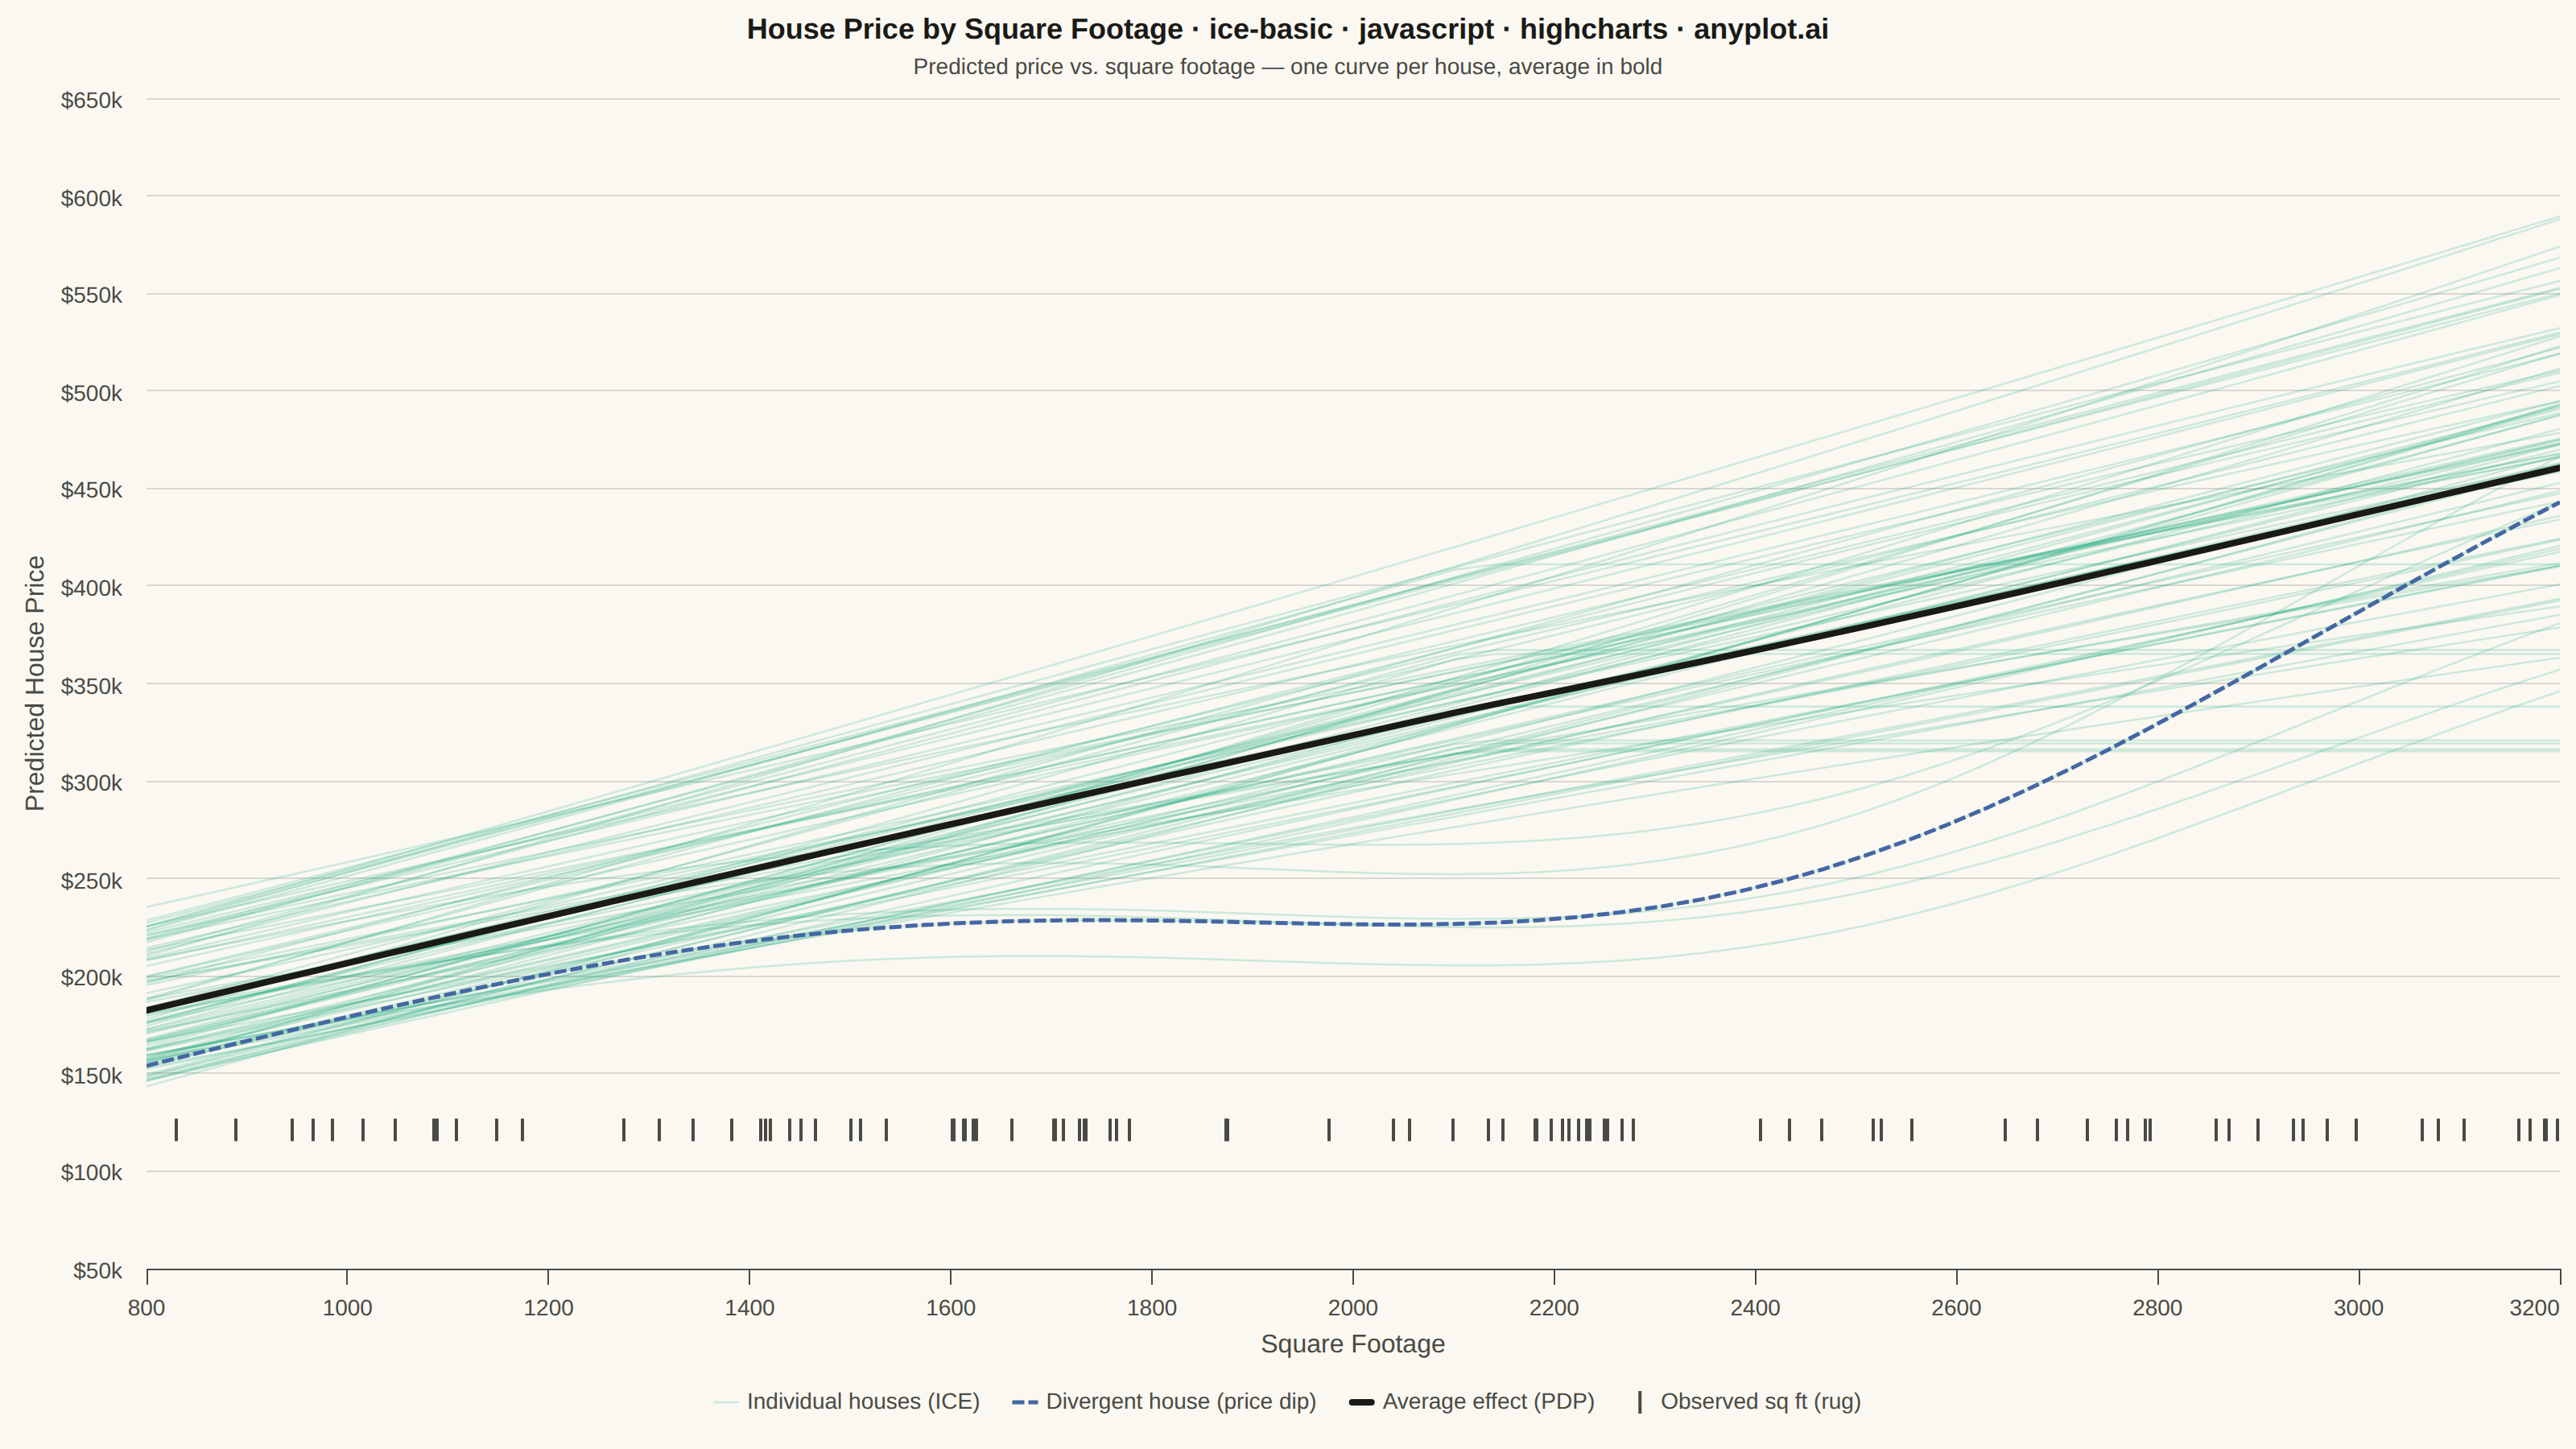
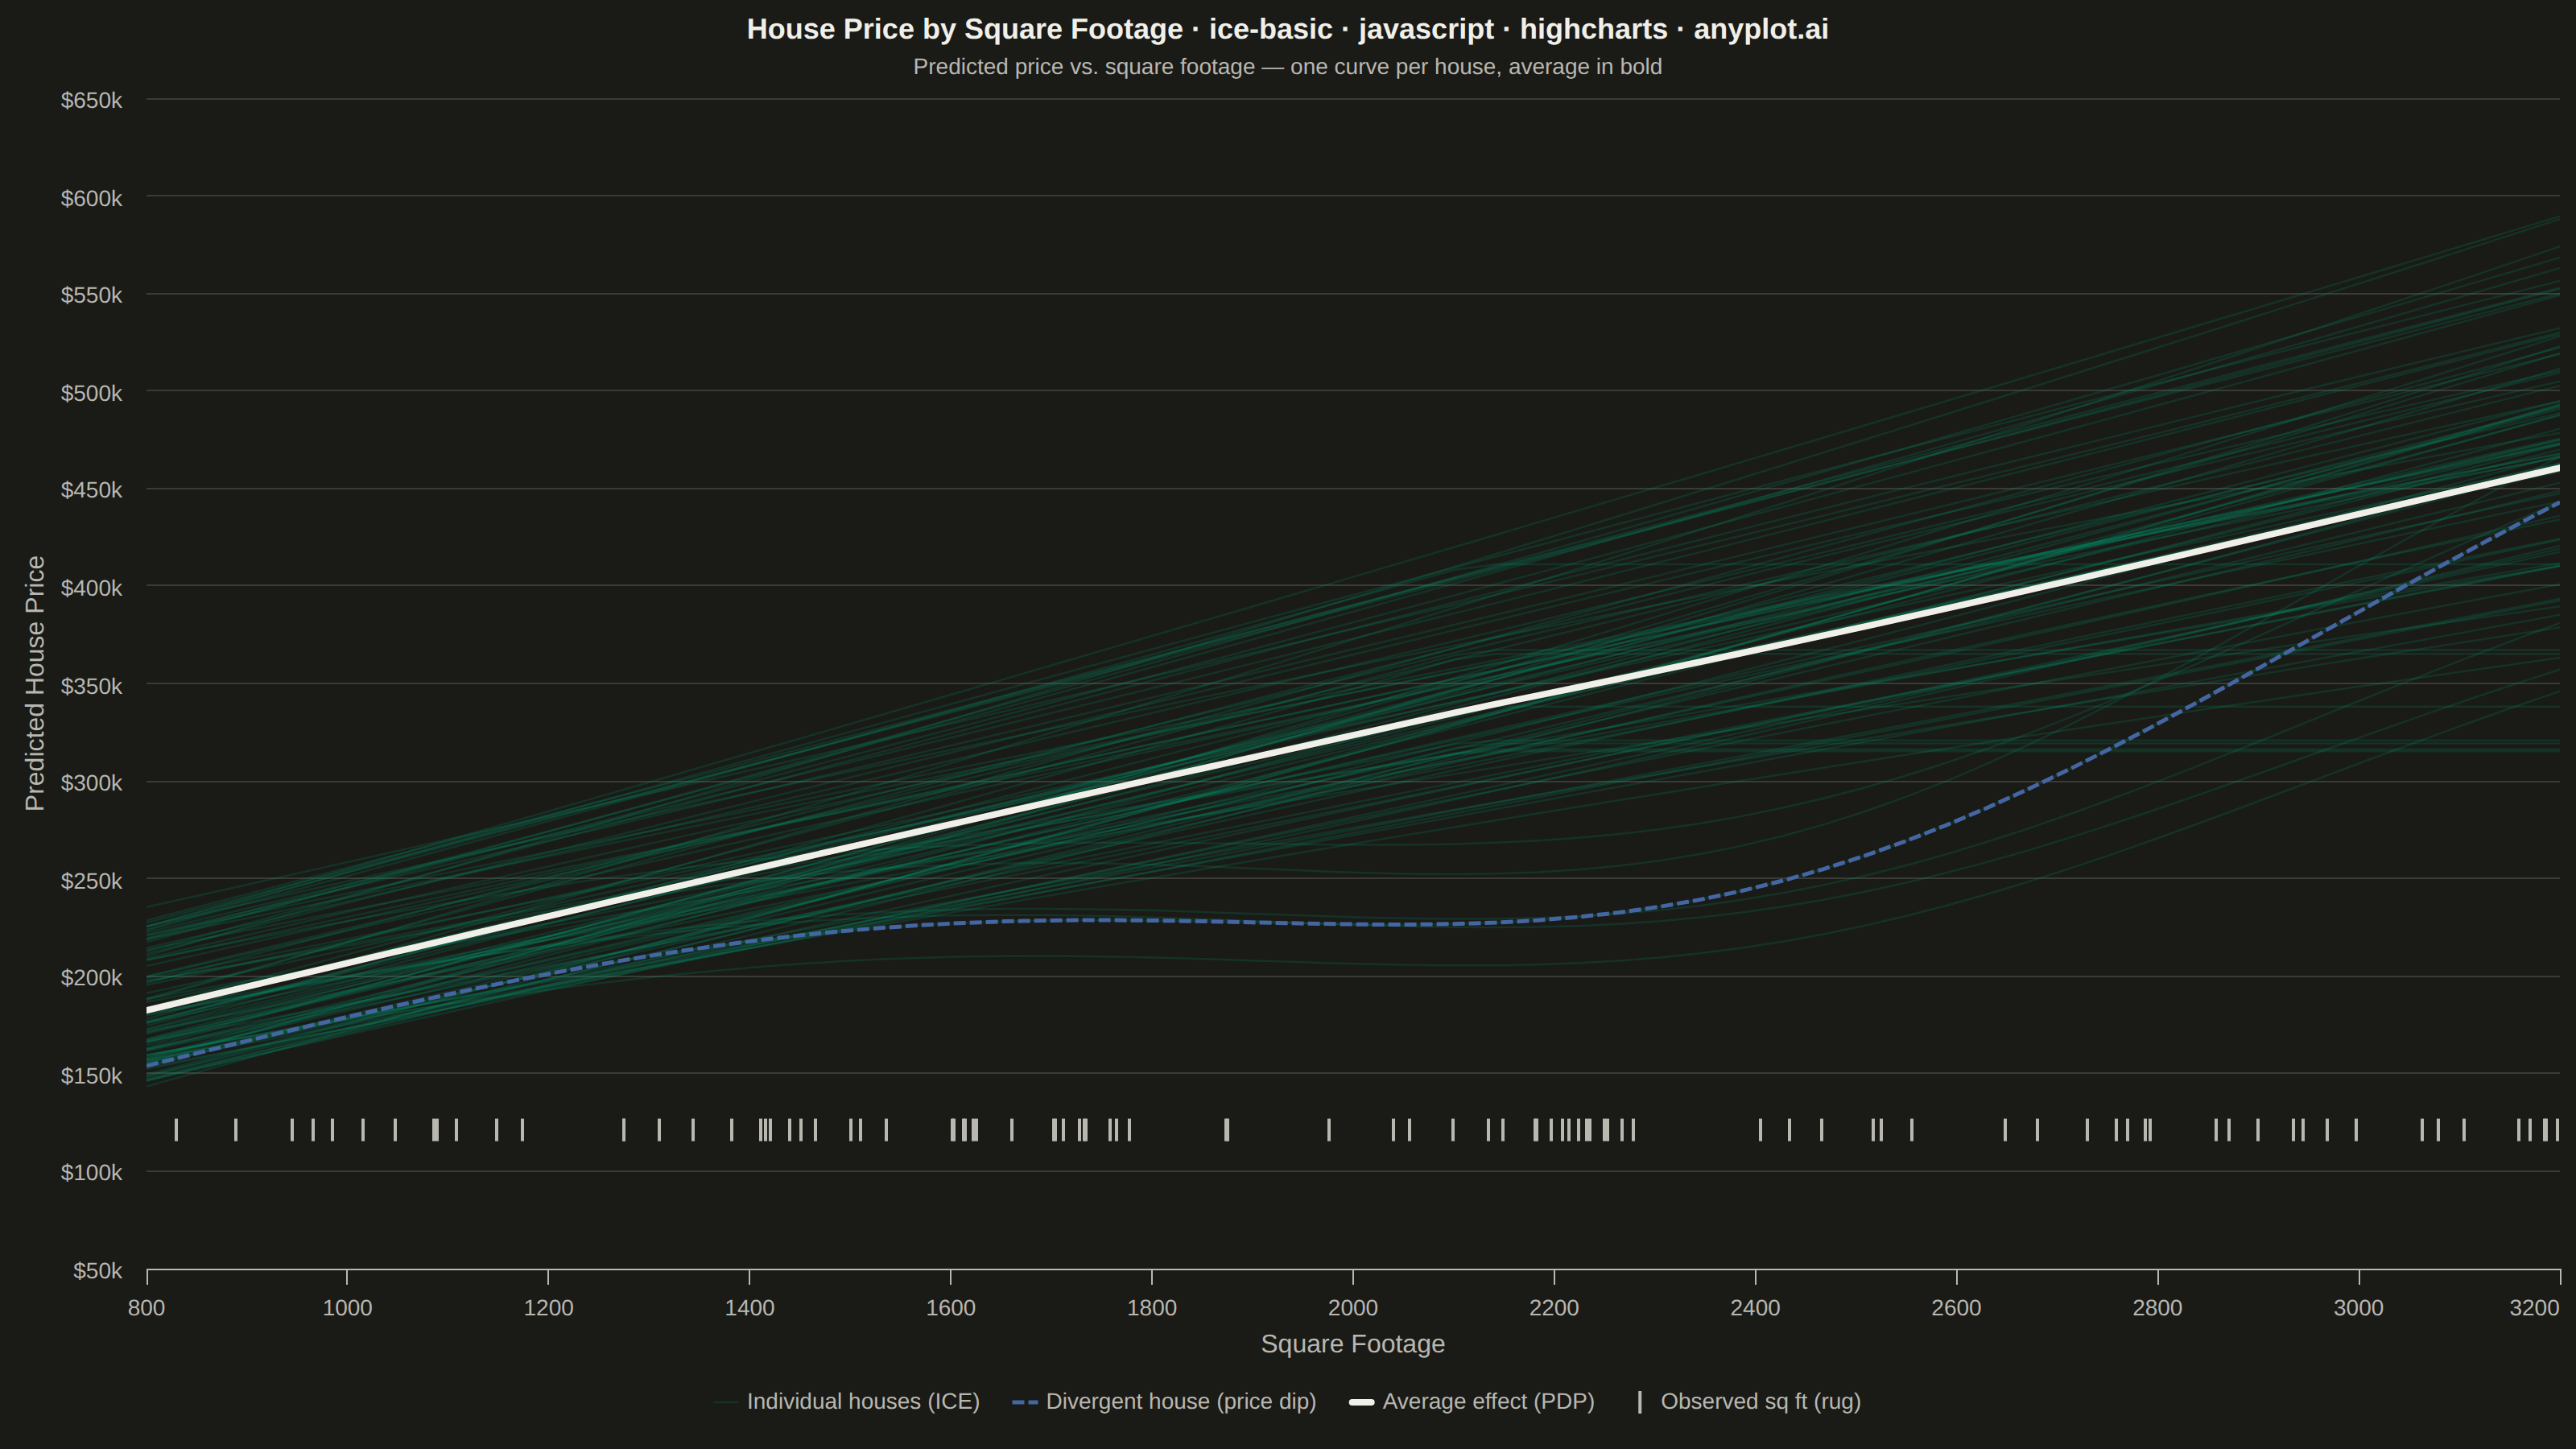
The same plot in 14 other libraries — JavaScript: Chart.js, D3.js, Apache ECharts, MUI X Charts; Python: Altair, Bokeh, lets-plot, Matplotlib, Plotly, plotnine, Pygal, Seaborn; R: ggplot2; Julia: Makie.jl. Compare all 15 side by side: Individual Conditional Expectation (ICE) Plot in Python, R, Julia and JavaScript.
An Individual Conditional Expectation (ICE) plot visualizes how the predicted outcome of a machine learning model changes for each individual observation as a single feature varies across its range. Unlike partial dependence plots (PDP) that show the average marginal effect, ICE plots display one line per observation, revealing heterogeneous effects, feature interactions, and subgroup-specific behaviors that would be hidden by averaging. This makes ICE plots essential for detecting when a feature's effect varies across the population.
// anyplot.ai
// ice-basic: Individual Conditional Expectation (ICE) Plot
// Library: highcharts 12.6.0 | JavaScript 22.23.2
// Quality: 95/100 | Created: 2026-08-17

//# anyplot-orientation: landscape
const t = window.ANYPLOT_TOKENS;

// --- Data (in-memory, deterministic LCG) ------------------------------------
let seed = 42;
function rand() {
  seed = (seed * 1664525 + 1013904223) % 4294967296;
  return seed / 4294967296;
}

const N_HOUSES = 90;
const N_GRID = 60;
const SQFT_MIN = 800;
const SQFT_MAX = 3200;
const RANGE = SQFT_MAX - SQFT_MIN;

const grid = Array.from(
  { length: N_GRID },
  (_, i) => SQFT_MIN + (i / (N_GRID - 1)) * RANGE
);

// Each house gets its own base price, slope and curvature — a stand-in for a
// GradientBoostingRegressor's individual conditional expectation curve. A
// minority of houses plateau (renovation-capped neighborhoods) or dip
// (oversized-for-block penalty) instead of climbing monotonically, so the
// fan demonstrates the interaction/subgroup-detection use case, not just
// varying slope magnitude.
const iceCurves = [];
const observedSqft = [];
let highlightIndex = -1;
for (let h = 0; h < N_HOUSES; h++) {
  const basePrice = 140000 + rand() * 90000;
  const pricePerSqft = 90 + rand() * 60;
  const curvature = -6 + rand() * 12; // diminishing vs. accelerating returns
  const noise = (rand() - 0.5) * 12000;
  observedSqft.push(SQFT_MIN + rand() * RANGE);

  const isPlateau = h % 12 === 4;
  const isDip = h % 15 === 9;
  if (isDip && highlightIndex === -1) highlightIndex = h;

  const curve = grid.map((sqft) => {
    const dx = sqft - SQFT_MIN;
    if (isPlateau) {
      // Price growth caps past ~55% of the range — a subgroup where extra
      // square footage stops adding value (e.g. a HOA size cap).
      const cappedDx = Math.min(dx, RANGE * 0.55);
      const price = basePrice + pricePerSqft * cappedDx + curvature * 0.001 * cappedDx * cappedDx + noise;
      return [sqft, Math.round(price)];
    }
    let price = basePrice + pricePerSqft * dx + curvature * 0.001 * dx * dx + noise;
    if (isDip) {
      // A localized dip around the upper-middle of the range — a subgroup
      // where oversized homes read as "too big for the block" to buyers.
      const dipCenter = RANGE * 0.68;
      const dipWidth = RANGE * 0.22;
      const dipDepth = pricePerSqft * RANGE * 0.4;
      price -= dipDepth * Math.exp(-((dx - dipCenter) ** 2) / (2 * dipWidth * dipWidth));
    }
    return [sqft, Math.round(price)];
  });
  iceCurves.push(curve);
}
const highlightCurve = iceCurves[highlightIndex];

// Partial dependence (PDP) — the average of all ICE curves at each grid point.
const pdp = grid.map((sqft, gi) => {
  const avg = iceCurves.reduce((sum, curve) => sum + curve[gi][1], 0) / N_HOUSES;
  return [sqft, Math.round(avg)];
});

const allPrices = iceCurves.flat().map((p) => p[1]);
const priceMin = Math.min(...allPrices);
const priceMax = Math.max(...allPrices);
const priceRange = priceMax - priceMin;
// Keep the rug band well clear of the axis line and tick labels below it.
const rugY = priceMin - priceRange * 0.05;
const rug = observedSqft.map((sqft) => [sqft, rugY]);

// --- Custom marker: a short vertical tick for the rug plot ------------------
Highcharts.SVGRenderer.prototype.symbols.rugtick = (x, y, w, h) => [
  "M", x + w / 2, y,
  "L", x + w / 2, y + h,
];

// --- Chart -------------------------------------------------------------------
Highcharts.chart("container", {
  chart: {
    type: "line",
    backgroundColor: "transparent",
    animation: false,
    style: { fontFamily: "inherit" },
  },
  credits: { enabled: false },
  colors: t.palette,
  title: {
    text: "House Price by Square Footage · ice-basic · javascript · highcharts · anyplot.ai",
    style: { color: t.ink, fontSize: "18px", fontWeight: "600" },
  },
  subtitle: {
    text: "Predicted price vs. square footage — one curve per house, average in bold",
    style: { color: t.inkSoft, fontSize: "14px" },
  },
  xAxis: {
    title: { text: "Square Footage", style: { color: t.inkSoft, fontSize: "16px" } },
    lineColor: t.inkSoft,
    tickColor: t.inkSoft,
    gridLineColor: t.grid,
    labels: { style: { color: t.inkSoft, fontSize: "14px" } },
    min: SQFT_MIN,
    max: SQFT_MAX,
  },
  yAxis: {
    title: { text: "Predicted House Price", style: { color: t.inkSoft, fontSize: "16px" } },
    gridLineColor: t.grid,
    labels: {
      style: { color: t.inkSoft, fontSize: "14px" },
      formatter() {
        return "$" + Math.round(this.value / 1000) + "k";
      },
    },
    min: priceMin - priceRange * 0.14,
  },
  legend: {
    itemStyle: { color: t.inkSoft, fontSize: "14px" },
    itemHoverStyle: { color: t.ink },
  },
  tooltip: {
    backgroundColor: t.elevatedBg,
    style: { color: t.ink },
    formatter() {
      return `${Math.round(this.x)} sq ft<br/><b>$${Math.round(this.y).toLocaleString()}</b>`;
    },
  },
  plotOptions: {
    series: { animation: false, marker: { enabled: false } },
    line: { enableMouseTracking: false },
  },
  series: [
    ...iceCurves.map((curve, i) => ({
      type: "line",
      name: i === 0 ? "Individual houses (ICE)" : undefined,
      showInLegend: i === 0,
      data: curve,
      color: "rgba(0, 158, 115, 0.18)",
      lineWidth: 1.25,
    })),
    {
      type: "line",
      name: "Divergent house (price dip)",
      data: highlightCurve,
      color: "#4467A3",
      lineWidth: 2.5,
      dashStyle: "ShortDash",
      enableMouseTracking: true,
      zIndex: 4,
    },
    {
      type: "line",
      name: "Average effect (PDP)",
      data: pdp,
      color: t.ink,
      lineWidth: 4,
      enableMouseTracking: true,
      zIndex: 5,
    },
    {
      type: "scatter",
      name: "Observed sq ft (rug)",
      data: rug,
      color: t.inkSoft,
      marker: {
        enabled: true,
        symbol: "rugtick",
        radius: 7,
        fillColor: "none",
        lineColor: t.inkSoft,
        lineWidth: 2,
      },
      enableMouseTracking: false,
    },
  ],
});
Runnable source as JSON, for any HTTP client: https://api.anyplot.ai/specs/ice-basic/highcharts/code. Any spec id and library id listed in llms-full.txt fit the same URL shape; every URL below is complete and callable.
{
  "spec_id": "ice-basic",
  "language": "javascript",
  "library": "highcharts",
  "page": "https://anyplot.ai/ice-basic/javascript/highcharts",
  "hub": "https://anyplot.ai/ice-basic",
  "code_json": "https://api.anyplot.ai/specs/ice-basic/highcharts/code",
  "spec_json": "https://api.anyplot.ai/specs/ice-basic",
  "render_light_png": "https://storage.googleapis.com/anyplot-images/plots/ice-basic/javascript/highcharts/plot-light.png",
  "render_dark_png": "https://storage.googleapis.com/anyplot-images/plots/ice-basic/javascript/highcharts/plot-dark.png",
  "interactive_light_html": "https://storage.googleapis.com/anyplot-images/plots/ice-basic/javascript/highcharts/plot-light.html",
  "interactive_dark_html": "https://storage.googleapis.com/anyplot-images/plots/ice-basic/javascript/highcharts/plot-dark.html",
  "quality_score": 95.0,
  "license": "MIT",
  "guide": "https://anyplot.ai/llms.txt"
}
Part of Individual Conditional Expectation (ICE) Plot on anyplot.ai.