The same plot in 14 other libraries — JavaScript: Chart.js, D3.js, Apache ECharts, Highcharts; Python: Altair, Bokeh, lets-plot, Matplotlib, Plotly, plotnine, Pygal, Seaborn; R: ggplot2; Julia: Makie.jl. Compare all 15 side by side: Individual Conditional Expectation (ICE) Plot in Python, R, Julia and JavaScript.
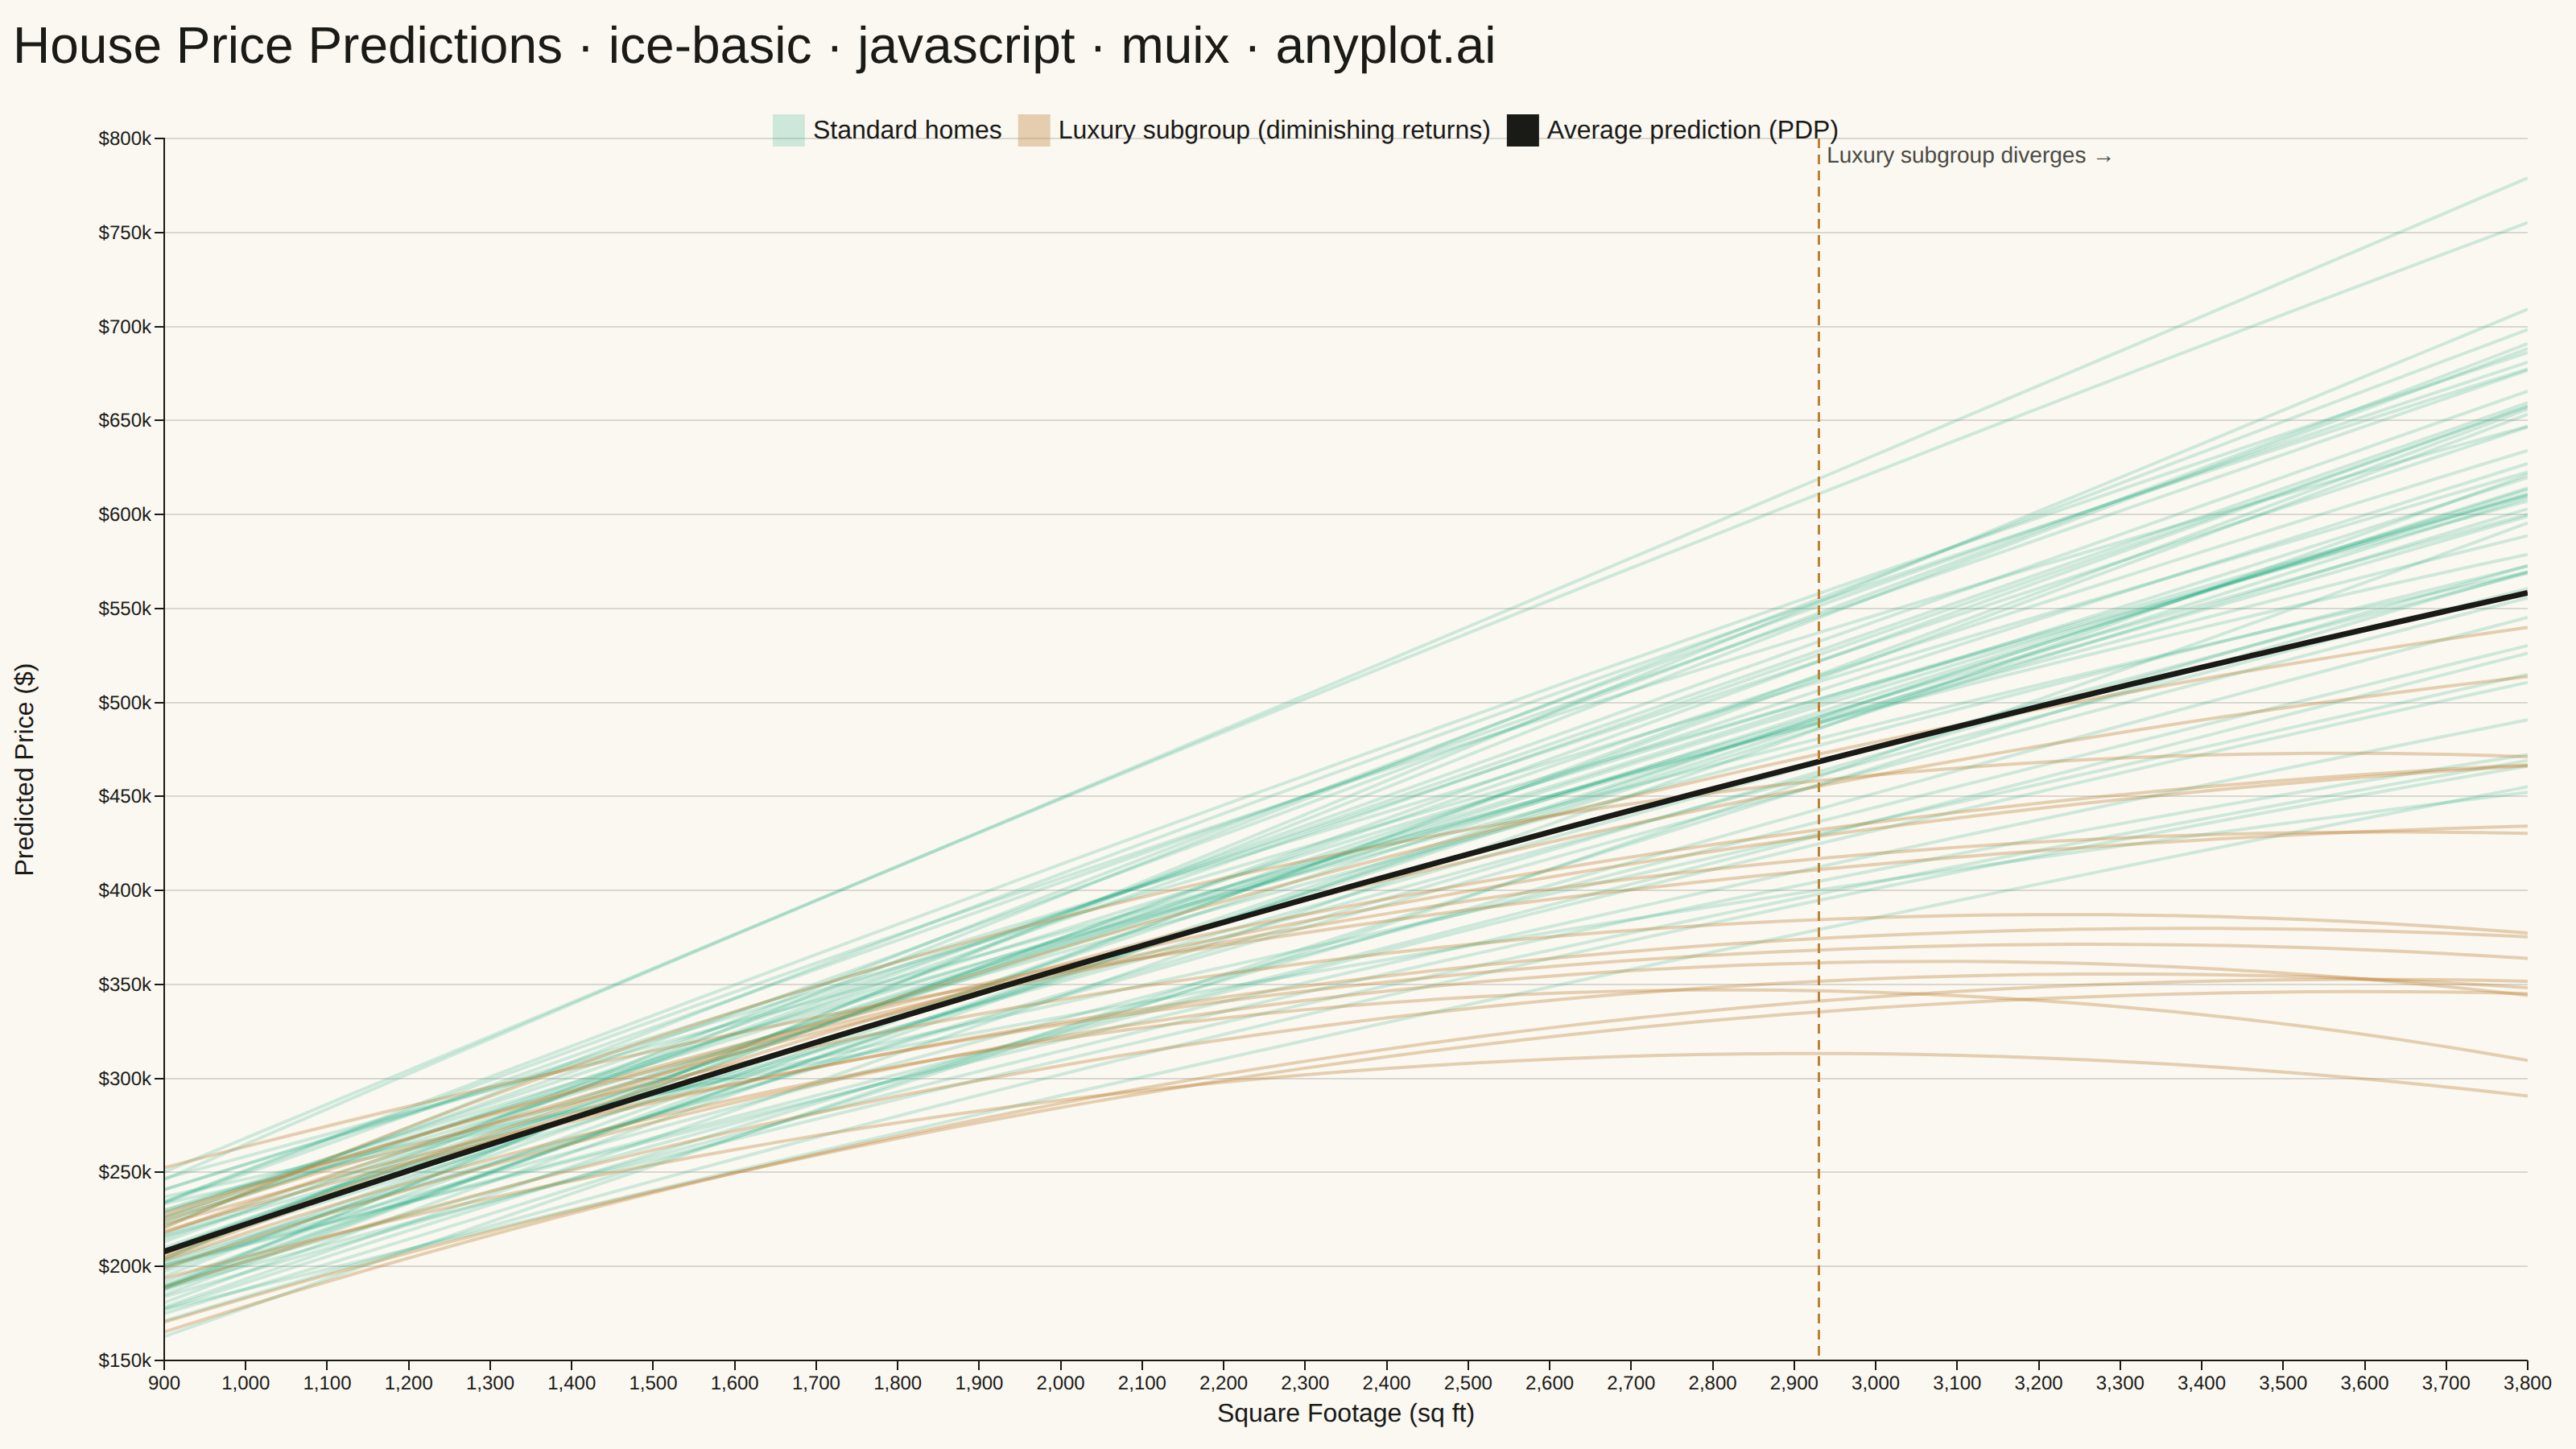
An Individual Conditional Expectation (ICE) plot visualizes how the predicted outcome of a machine learning model changes for each individual observation as a single feature varies across its range. Unlike partial dependence plots (PDP) that show the average marginal effect, ICE plots display one line per observation, revealing heterogeneous effects, feature interactions, and subgroup-specific behaviors that would be hidden by averaging. This makes ICE plots essential for detecting when a feature's effect varies across the population.
// anyplot.ai
// ice-basic: Individual Conditional Expectation (ICE) Plot
// Library: muix 7.29.1 | JavaScript 22.23.2
// Quality: 92/100 | Created: 2026-08-17
//# anyplot-orientation: landscape
// anyplot.ai
// ice-basic: Individual Conditional Expectation (ICE) Plot
// Library: MUI X Charts | React | Node 22
// License: @mui/x-charts — MIT (community). Pro/Premium are out of scope.
// Quality: pending | Created: 2026-08-17
import { LineChart } from "@mui/x-charts/LineChart";
import { ChartsReferenceLine } from "@mui/x-charts/ChartsReferenceLine";

const t = window.ANYPLOT_TOKENS;

// --- Data (in-memory, deterministic) ---------------------------------------
// GradientBoostingRegressor-style house-price model: one ICE curve per house
// shows how the predicted price responds to square footage for that specific
// house, holding its other features fixed. A minority "luxury" subgroup
// exhibits diminishing returns at large square footage (a feature
// interaction the averaged PDP line alone would hide).
function mulberry32(seed) {
  return function rng() {
    seed |= 0;
    seed = (seed + 0x6d2b79f5) | 0;
    let x = Math.imul(seed ^ (seed >>> 15), 1 | seed);
    x = (x + Math.imul(x ^ (x >>> 7), 61 | x)) ^ x;
    return ((x ^ (x >>> 14)) >>> 0) / 4294967296;
  };
}

function gaussian(rng, mean, std) {
  const u1 = Math.max(rng(), 1e-9);
  const u2 = rng();
  const z = Math.sqrt(-2 * Math.log(u1)) * Math.cos(2 * Math.PI * u2);
  return mean + z * std;
}

function hexToRgba(hex, alpha) {
  const r = parseInt(hex.slice(1, 3), 16);
  const g = parseInt(hex.slice(3, 5), 16);
  const b = parseInt(hex.slice(5, 7), 16);
  return `rgba(${r}, ${g}, ${b}, ${alpha})`;
}

const rng = mulberry32(42);
const N_OBSERVATIONS = 70;
const N_GRID_POINTS = 55;
const SQFT_MIN = 900;
const SQFT_MAX = 3800;

const featureGrid = Array.from(
  { length: N_GRID_POINTS },
  (_, i) => SQFT_MIN + (i * (SQFT_MAX - SQFT_MIN)) / (N_GRID_POINTS - 1),
);

const iceCurves = Array.from({ length: N_OBSERVATIONS }, (_, houseId) => {
  const basePrice = gaussian(rng, 210000, 22000);
  const pricePerSqft = gaussian(rng, 145, 22);
  const isLuxurySubgroup = rng() < 0.25;
  const curvature = isLuxurySubgroup
    ? gaussian(rng, -0.028, 0.006)
    : gaussian(rng, -0.003, 0.004);

  const predictions = featureGrid.map((sqft) => {
    const delta = sqft - SQFT_MIN;
    return basePrice + pricePerSqft * delta + curvature * delta * delta;
  });

  return { houseId, isLuxurySubgroup, predictions };
});

const partialDependence = featureGrid.map((_, gridIndex) => {
  const sum = iceCurves.reduce((acc, curve) => acc + curve.predictions[gridIndex], 0);
  return sum / iceCurves.length;
});

// Color-code the ~25% luxury subgroup (ochre) against the standard majority
// (brand green) so the diminishing-returns interaction is visible directly
// from line color, not only inferable from where curves happen to diverge.
const STANDARD_COLOR = hexToRgba(t.palette[0], 0.18);
const LUXURY_COLOR = hexToRgba(t.palette[3], 0.35);
// Sorted standard-before-luxury so series[0] stays brand green, matching the
// style guide's "first series is always #009E73" rule.
const orderedCurves = [
  ...iceCurves.filter((curve) => !curve.isLuxurySubgroup),
  ...iceCurves.filter((curve) => curve.isLuxurySubgroup),
];
const firstStandardIndex = orderedCurves.findIndex((curve) => !curve.isLuxurySubgroup);
const firstLuxuryIndex = orderedCurves.findIndex((curve) => curve.isLuxurySubgroup);
// Reference-line x position: where the luxury subgroup's diminishing-returns
// curvature starts to visibly pull away from the standard trend.
const DIVERGENCE_SQFT = SQFT_MIN + 0.7 * (SQFT_MAX - SQFT_MIN);

// --- Title (mandated format, fontsize scaled to length) ---------------------
const TITLE = "House Price Predictions · ice-basic · javascript · muix · anyplot.ai";
// Base of 32 (vs. the generic 22px JS-library default) because this title is
// rendered in a plain flex div, not SVG-measured MUI X chrome — the plain-div
// layout reads visually smaller at the same fontsize than the library's own
// title component, so it needs a larger base to hit the expected ~70-85% of
// canvas width.
const TITLE_FONT_SIZE = Math.round(32 * Math.min(1, 67 / TITLE.length));
const TITLE_ROW_HEIGHT = 56;
const FONT_FAMILY = "Roboto, Helvetica, Arial, sans-serif";
const AXIS_LABEL_FONT_SIZE = 16;
// MUI X positions the native yAxis label at a fixed offset from the axis
// line, not from the (variable-width) tick label text, so a wide tick label
// like "$800k" collides with it. Render the y-axis title ourselves in a
// dedicated column instead.
const Y_LABEL_COLUMN_WIDTH = 32;

// --- Chart (default-exported component — the harness mounts it) -------------
export default function Chart() {
  const chartHeight = window.ANYPLOT_SIZE.height - TITLE_ROW_HEIGHT;
  const chartWidth = window.ANYPLOT_SIZE.width - Y_LABEL_COLUMN_WIDTH;

  const series = [
    ...orderedCurves.map((curve, index) => ({
      id: `house-${curve.houseId}`,
      data: curve.predictions,
      color: curve.isLuxurySubgroup ? LUXURY_COLOR : STANDARD_COLOR,
      showMark: false,
      // Only the first curve of each subgroup carries a legend label — the
      // other ~68 stay unlabeled so the legend shows 3 entries, not 70.
      ...(index === firstStandardIndex ? { label: "Standard homes" } : {}),
      ...(index === firstLuxuryIndex ? { label: "Luxury subgroup (diminishing returns)" } : {}),
    })),
    {
      id: "pdp",
      data: partialDependence,
      color: t.ink,
      label: "Average prediction (PDP)",
      showMark: false,
    },
  ];

  return (
    <div style={{ width: window.ANYPLOT_SIZE.width, height: window.ANYPLOT_SIZE.height }}>
      <div
        style={{
          height: TITLE_ROW_HEIGHT,
          display: "flex",
          alignItems: "center",
          paddingLeft: 8,
          fontSize: TITLE_FONT_SIZE,
          fontWeight: 500,
          color: t.ink,
          fontFamily: FONT_FAMILY,
        }}
      >
        {TITLE}
      </div>
      <div style={{ display: "flex", width: window.ANYPLOT_SIZE.width, height: chartHeight }}>
        <div
          style={{
            width: Y_LABEL_COLUMN_WIDTH,
            display: "flex",
            alignItems: "center",
            justifyContent: "center",
          }}
        >
          <span
            style={{
              display: "inline-block",
              transform: "rotate(-90deg)",
              whiteSpace: "nowrap",
              color: t.ink,
              fontSize: AXIS_LABEL_FONT_SIZE,
              fontFamily: FONT_FAMILY,
            }}
          >
            Predicted Price ($)
          </span>
        </div>
        <LineChart
          width={chartWidth}
          height={chartHeight}
          series={series}
          skipAnimation
          xAxis={[
            {
              data: featureGrid,
              scaleType: "linear",
              label: "Square Footage (sq ft)",
              labelStyle: { fontSize: AXIS_LABEL_FONT_SIZE },
            },
          ]}
          yAxis={[
            {
              valueFormatter: (price) => `$${Math.round(price / 1000)}k`,
            },
          ]}
          grid={{ horizontal: true }}
          tooltip={{ trigger: "item" }}
          margin={{ top: 30, right: 30, bottom: 55, left: 70 }}
          sx={{
            "& .MuiChartsGrid-line": { stroke: t.grid },
            "& .MuiLineElement-series-pdp": { strokeWidth: 3.5 },
          }}
        >
          <ChartsReferenceLine
            x={DIVERGENCE_SQFT}
            label="Luxury subgroup diverges →"
            labelAlign="start"
            labelStyle={{ fill: t.inkSoft, fontSize: 14, fontFamily: FONT_FAMILY }}
            lineStyle={{ stroke: t.palette[3], strokeDasharray: "6 4", strokeWidth: 1.5 }}
          />
        </LineChart>
      </div>
    </div>
  );
}
Runnable source as JSON, for any HTTP client: https://api.anyplot.ai/specs/ice-basic/muix/code. Any spec id and library id listed in llms-full.txt fit the same URL shape; every URL below is complete and callable.
{
  "spec_id": "ice-basic",
  "language": "javascript",
  "library": "muix",
  "page": "https://anyplot.ai/ice-basic/javascript/muix",
  "hub": "https://anyplot.ai/ice-basic",
  "code_json": "https://api.anyplot.ai/specs/ice-basic/muix/code",
  "spec_json": "https://api.anyplot.ai/specs/ice-basic",
  "render_light_png": "https://storage.googleapis.com/anyplot-images/plots/ice-basic/javascript/muix/plot-light.png",
  "render_dark_png": "https://storage.googleapis.com/anyplot-images/plots/ice-basic/javascript/muix/plot-dark.png",
  "interactive_light_html": "https://storage.googleapis.com/anyplot-images/plots/ice-basic/javascript/muix/plot-light.html",
  "interactive_dark_html": "https://storage.googleapis.com/anyplot-images/plots/ice-basic/javascript/muix/plot-dark.html",
  "quality_score": 92.0,
  "license": "MIT",
  "guide": "https://anyplot.ai/llms.txt"
}
Part of Individual Conditional Expectation (ICE) Plot on anyplot.ai.