The same plot in 14 other libraries — JavaScript: Chart.js, Apache ECharts, Highcharts, MUI X Charts; Python: Altair, Bokeh, lets-plot, Matplotlib, Plotly, plotnine, Pygal, Seaborn; R: ggplot2; Julia: Makie.jl. Compare all 15 side by side: Individual Conditional Expectation (ICE) Plot in Python, R, Julia and JavaScript.
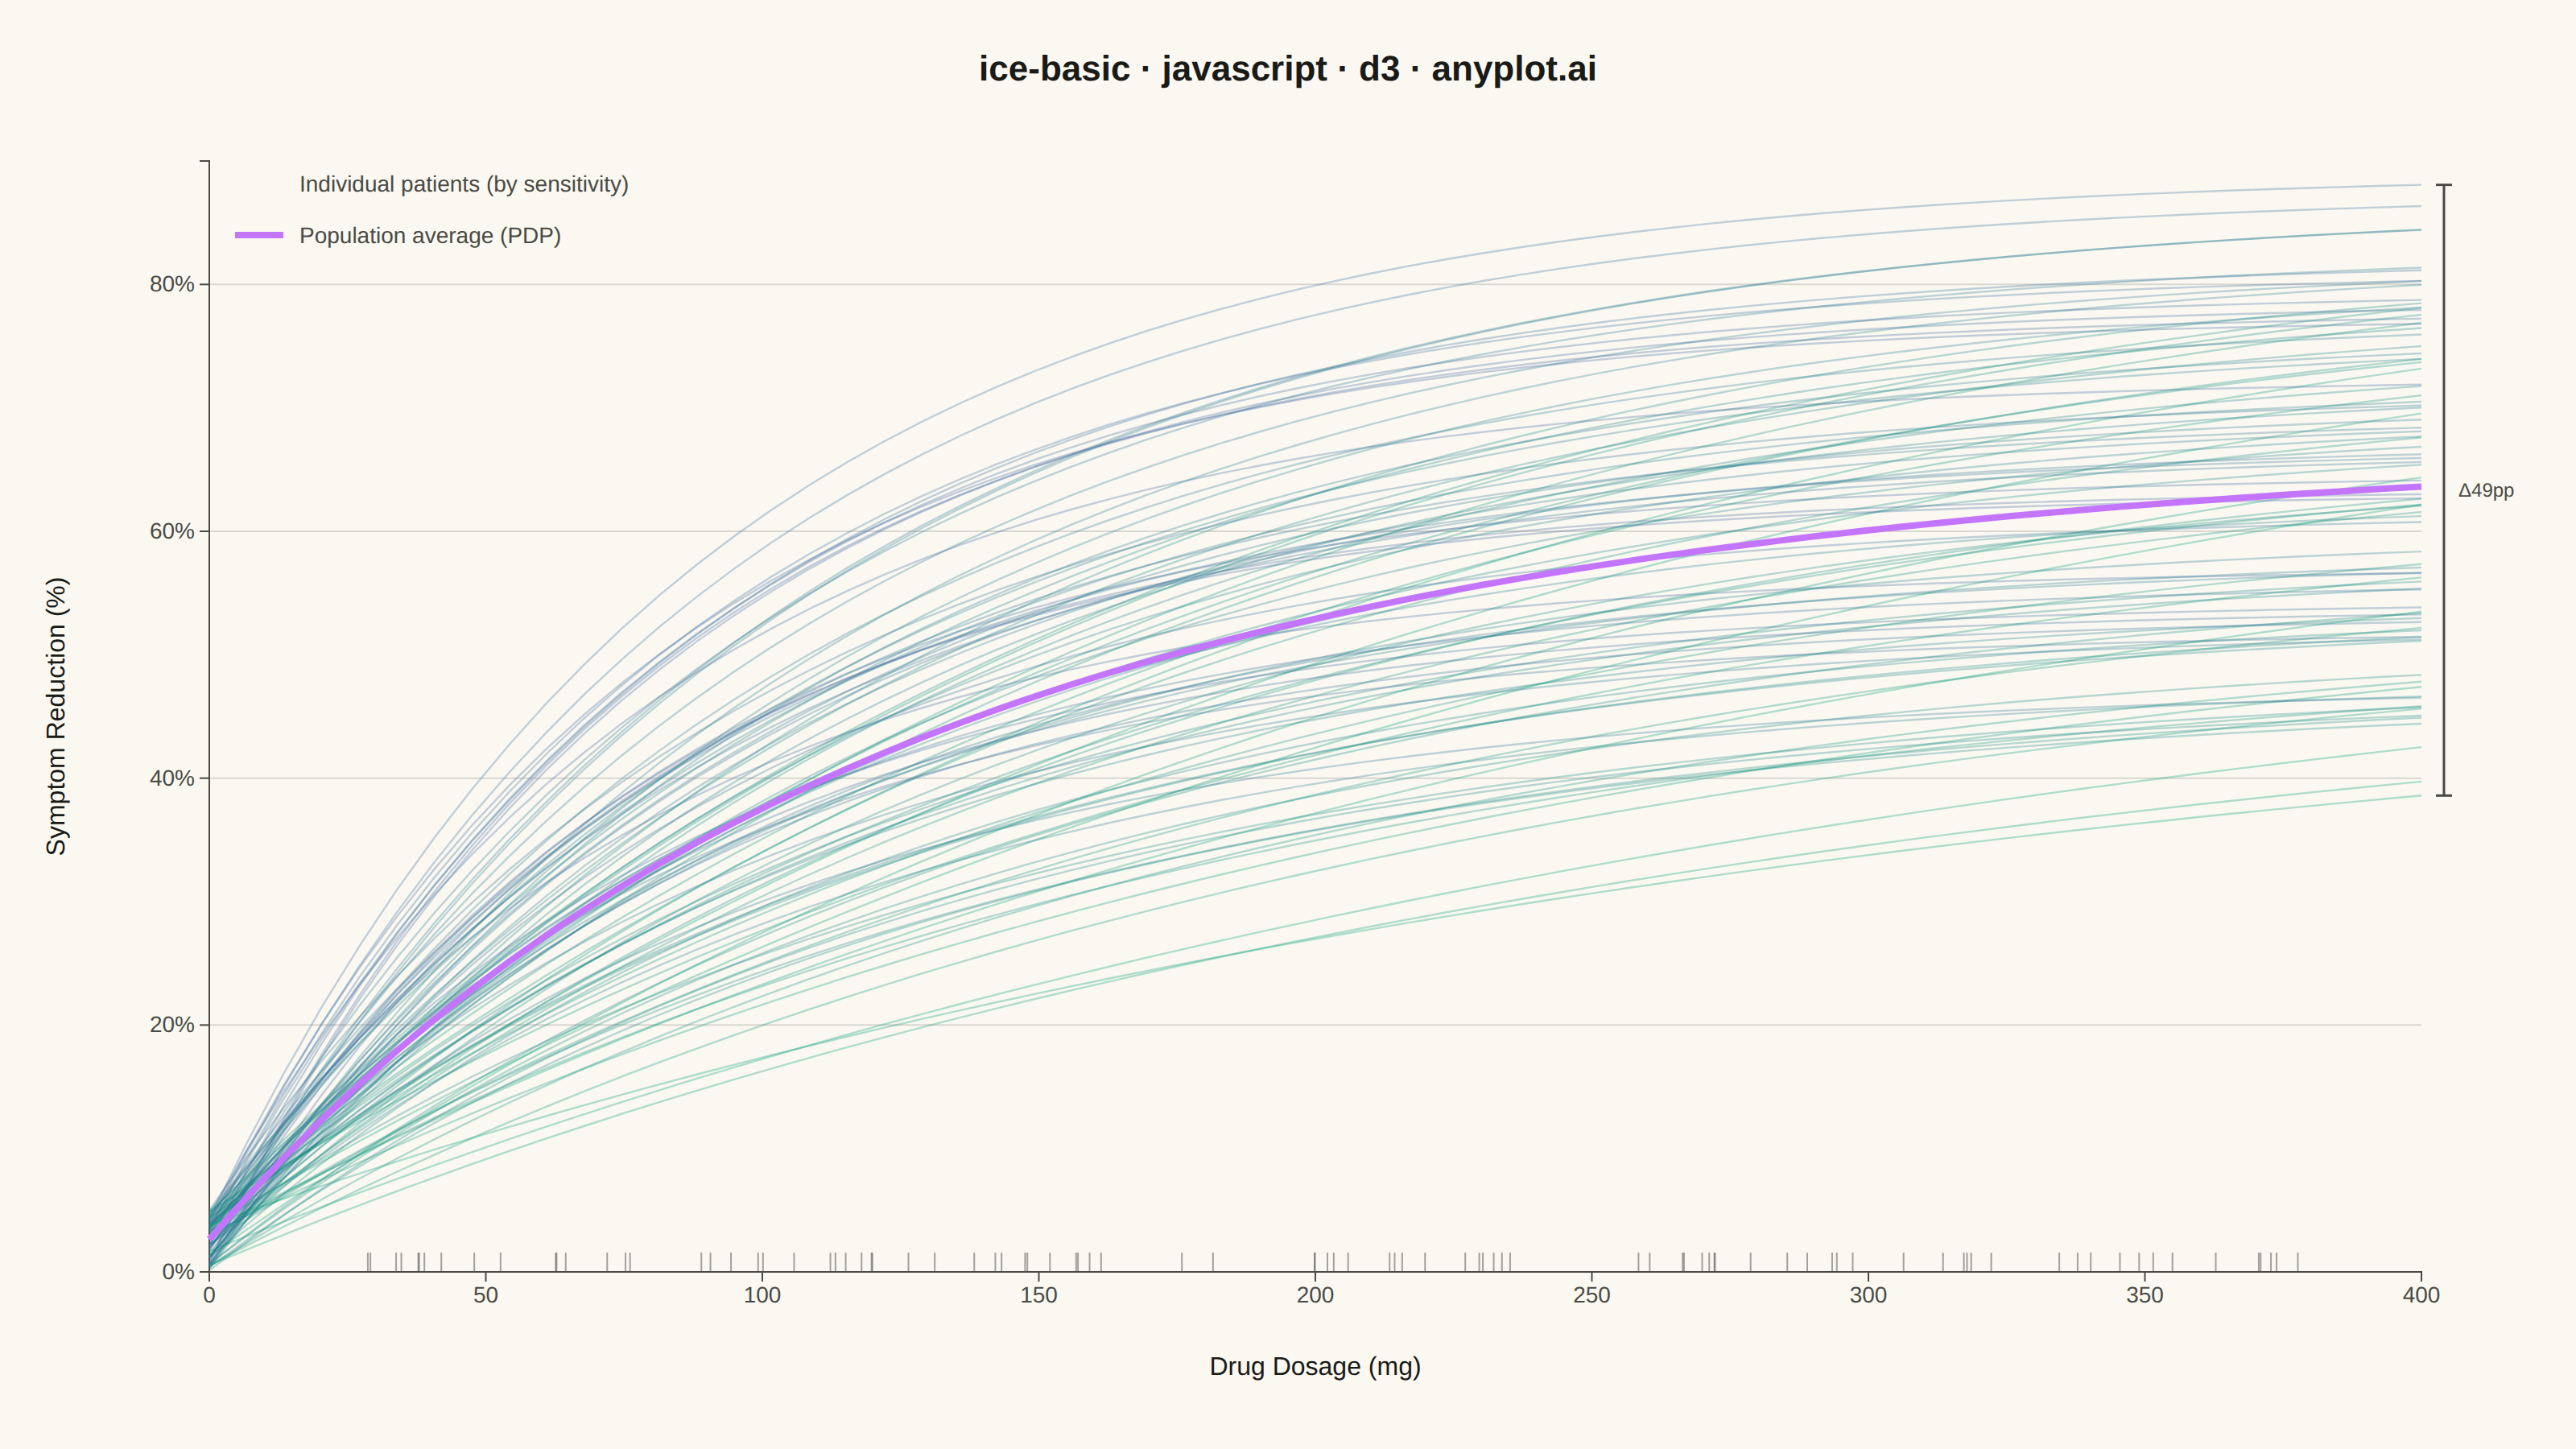
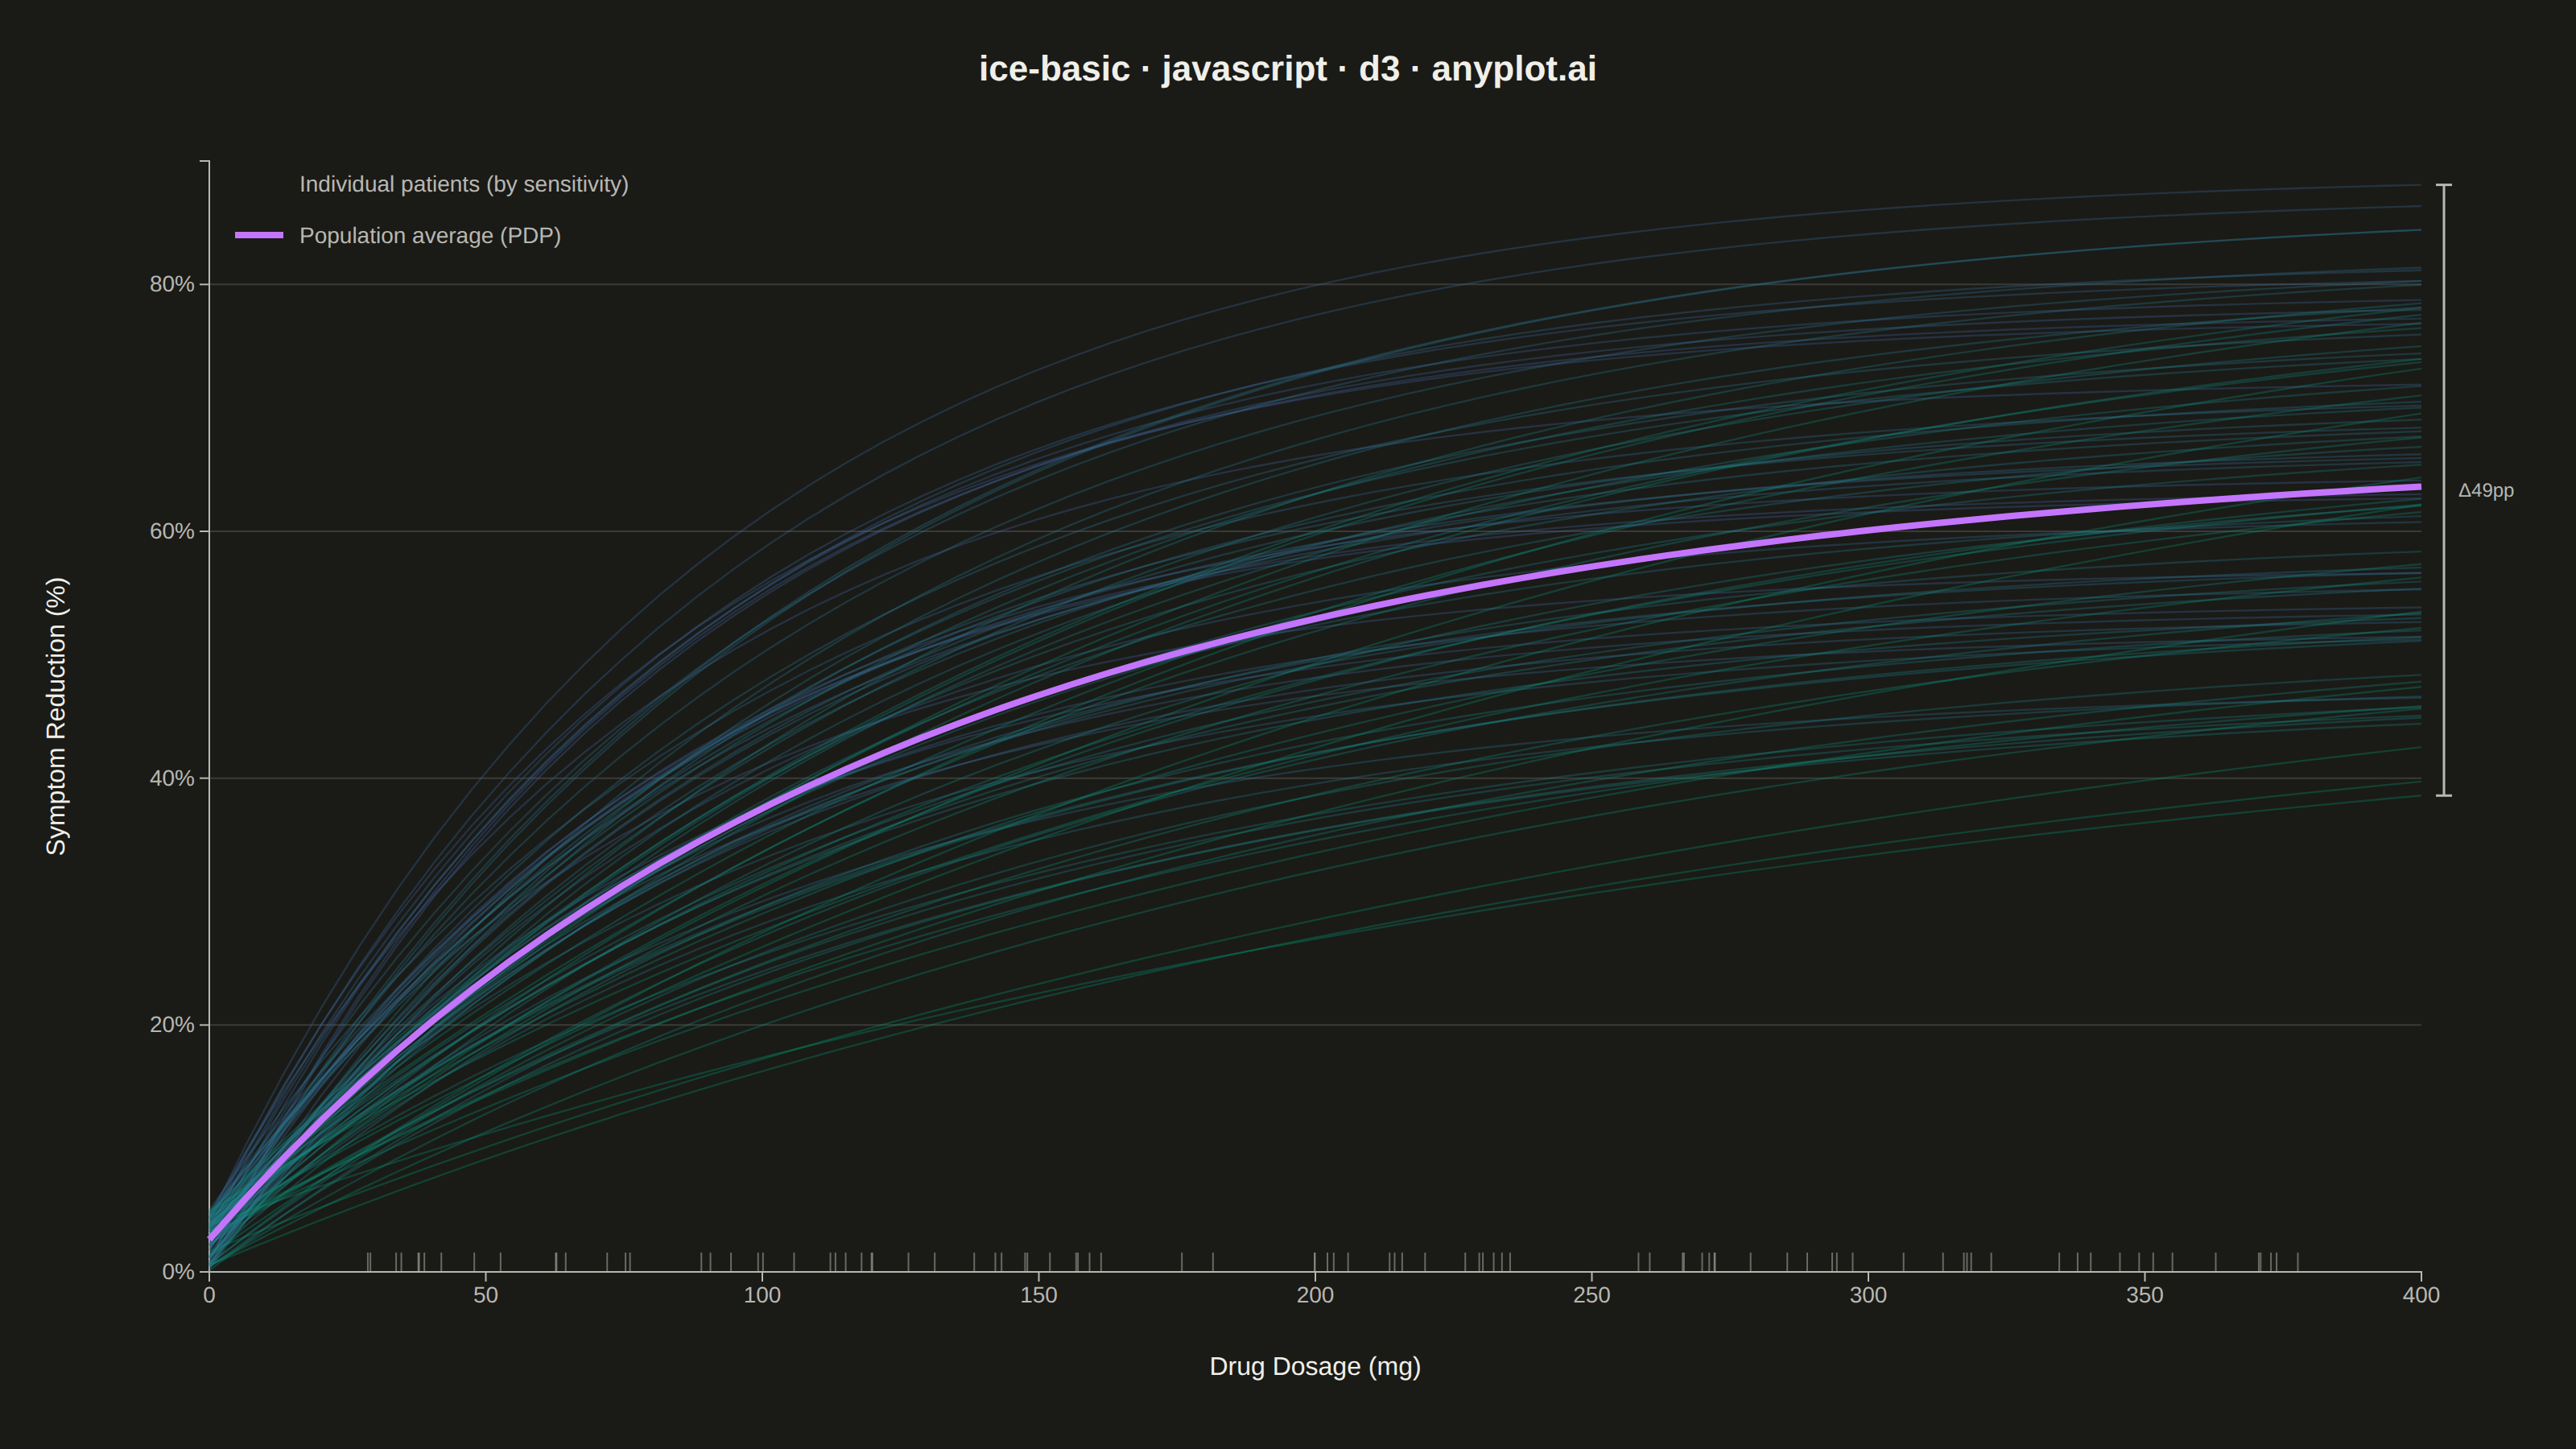
An Individual Conditional Expectation (ICE) plot visualizes how the predicted outcome of a machine learning model changes for each individual observation as a single feature varies across its range. Unlike partial dependence plots (PDP) that show the average marginal effect, ICE plots display one line per observation, revealing heterogeneous effects, feature interactions, and subgroup-specific behaviors that would be hidden by averaging. This makes ICE plots essential for detecting when a feature's effect varies across the population.
// anyplot.ai
// ice-basic: Individual Conditional Expectation (ICE) Plot
// Library: d3 7.9.0 | JavaScript 22.23.2
// Quality: 96/100 | Created: 2026-08-17
//# anyplot-orientation: landscape

const t = window.ANYPLOT_TOKENS;
const { width, height } = window.ANYPLOT_SIZE;
const margin = { top: 100, right: 96, bottom: 110, left: 130 };
const iw = width - margin.left - margin.right;
const ih = height - margin.top - margin.bottom;

// --- Data: synthetic Emax dose-response model, one ICE curve per patient ---
// Simulates a black-box model's prediction of symptom reduction as drug
// dosage varies, holding each patient's latent response profile fixed —
// patients differ in metabolism rate (curve steepness) and effect ceiling.
function lcg(seed) {
  let state = seed >>> 0;
  return () => {
    state = (state * 1664525 + 1013904223) >>> 0;
    return state / 4294967296;
  };
}
const rand = lcg(42);

const nPatients = 90;
const doseGrid = d3.range(60).map((i) => (i / 59) * 400);

const patients = d3.range(nPatients).map((id) => {
  const sensitivity = 0.4 + rand() * 1.2; // response rate — fast vs slow metabolizers
  const maxEffect = 45 + rand() * 40; // ceiling symptom reduction (%)
  const noise = rand() * 5; // small per-patient baseline jitter
  const observedDose = 20 + rand() * 360; // this patient's actual prescribed dose
  const curve = doseGrid.map(
    (dose) => maxEffect * (1 - Math.exp((-sensitivity * dose) / 130)) + noise,
  );
  return { id, observedDose, sensitivity, curve };
});

const pdpCurve = doseGrid.map((_, j) => d3.mean(patients, (p) => p.curve[j]));

// --- Scales ------------------------------------------------------------
const x = d3.scaleLinear().domain(d3.extent(doseGrid)).range([0, iw]);
const yMax = d3.max(patients, (p) => d3.max(p.curve));
const y = d3.scaleLinear().domain([0, yMax]).nice().range([ih, 0]);

// Continuous color encoding: ICE-line hue reveals sensitivity (metabolism
// rate) as a second feature, exposing which patient subgroup drives the
// steepest early response — an interaction effect hidden by the flat PDP.
const sensitivityExtent = d3.extent(patients, (p) => p.sensitivity);
const seqColor = d3
  .scaleSequential(d3.interpolateRgbBasis(t.seq))
  .domain(sensitivityExtent);

// --- SVG mount -----------------------------------------------------------
const svg = d3
  .select("#container")
  .append("svg")
  .attr("width", width)
  .attr("height", height);
const g = svg
  .append("g")
  .attr("transform", `translate(${margin.left},${margin.top})`);

// --- Y gridlines (line charts use y-axis grid only) ------------------------
g.append("g")
  .call(d3.axisLeft(y).ticks(6).tickSize(-iw).tickFormat(""))
  .call((axisGroup) => axisGroup.select(".domain").remove())
  .selectAll("line")
  .attr("stroke", t.grid);

// --- Axes ------------------------------------------------------------------
const xAxis = g
  .append("g")
  .attr("transform", `translate(0,${ih})`)
  .call(
    d3
      .axisBottom(x)
      .ticks(8)
      .tickFormat((d) => `${d}`),
  );
const yAxis = g.append("g").call(
  d3
    .axisLeft(y)
    .ticks(6)
    .tickFormat((d) => `${d}%`),
);
for (const axis of [xAxis, yAxis]) {
  axis.selectAll("text").attr("fill", t.inkSoft).style("font-size", "14px");
  axis.selectAll("line").attr("stroke", t.inkSoft);
  axis.select(".domain").attr("stroke", t.inkSoft);
}

// --- Individual ICE curves — low alpha to reveal density and divergence ----
const lineGen = d3
  .line()
  .x((d, i) => x(doseGrid[i]))
  .y((d) => y(d));
g.selectAll(".ice-line")
  .data(patients)
  .join("path")
  .attr("class", "ice-line")
  .attr("fill", "none")
  .attr("stroke", (p) => seqColor(p.sensitivity))
  .attr("stroke-width", 1.2)
  .attr("stroke-opacity", 0.3)
  .attr("d", (p) => lineGen(p.curve));

// --- PDP average overlay — bold, opaque -------------------------------------
g.append("path")
  .datum(pdpCurve)
  .attr("fill", "none")
  .attr("stroke", t.palette[1])
  .attr("stroke-width", 4)
  .attr("d", lineGen);

// --- Divergence annotation — bracket calling out the spread at max dose ----
const lastIdx = doseGrid.length - 1;
const finalValues = patients.map((p) => p.curve[lastIdx]);
const [spreadMin, spreadMax] = d3.extent(finalValues);
const bracketX = iw + 14;
const bracket = g.append("g");
bracket
  .append("line")
  .attr("x1", bracketX)
  .attr("x2", bracketX)
  .attr("y1", y(spreadMin))
  .attr("y2", y(spreadMax))
  .attr("stroke", t.inkSoft)
  .attr("stroke-width", 1.5);
for (const v of [spreadMin, spreadMax]) {
  bracket
    .append("line")
    .attr("x1", bracketX - 5)
    .attr("x2", bracketX + 5)
    .attr("y1", y(v))
    .attr("y2", y(v))
    .attr("stroke", t.inkSoft)
    .attr("stroke-width", 1.5);
}
bracket
  .append("text")
  .attr("x", bracketX + 9)
  .attr("y", (y(spreadMin) + y(spreadMax)) / 2)
  .attr("dy", "0.35em")
  .attr("fill", t.inkSoft)
  .style("font-size", "12px")
  .text(`Δ${Math.round(spreadMax - spreadMin)}pp`);

// --- Rug plot: distribution of observed dosages along the x-axis -----------
g.selectAll(".rug")
  .data(patients)
  .join("line")
  .attr("class", "rug")
  .attr("x1", (p) => x(p.observedDose))
  .attr("x2", (p) => x(p.observedDose))
  .attr("y1", ih)
  .attr("y2", ih - 12)
  .attr("stroke", t.inkSoft)
  .attr("stroke-opacity", 0.5)
  .attr("stroke-width", 1);

// --- Legend — placed in the empty low-dose/low-effect corner ---------------
const gradientId = "ice-sensitivity-gradient";
svg
  .append("defs")
  .append("linearGradient")
  .attr("id", gradientId)
  .attr("x1", "0%")
  .attr("x2", "100%")
  .selectAll("stop")
  .data(d3.range(0, 1.001, 0.1))
  .join("stop")
  .attr("offset", (d) => `${d * 100}%`)
  .attr("stop-color", (d) =>
    seqColor(
      sensitivityExtent[0] + d * (sensitivityExtent[1] - sensitivityExtent[0]),
    ),
  );

const legend = g.append("g").attr("transform", "translate(16, 14)");
const legendItems = [
  {
    label: "Individual patients (by sensitivity)",
    color: `url(#${gradientId})`,
    opacity: 0.8,
    width: 3,
  },
  {
    label: "Population average (PDP)",
    color: t.palette[1],
    opacity: 1,
    width: 4,
  },
];
legendItems.forEach((item, i) => {
  const row = legend.append("g").attr("transform", `translate(0, ${i * 32})`);
  row
    .append("line")
    .attr("x1", 0)
    .attr("x2", 30)
    .attr("y1", 0)
    .attr("y2", 0)
    .attr("stroke", item.color)
    .attr("stroke-width", item.width)
    .attr("stroke-opacity", item.opacity);
  row
    .append("text")
    .attr("x", 40)
    .attr("y", 5)
    .attr("fill", t.inkSoft)
    .style("font-size", "14px")
    .text(item.label);
});

// --- Axis labels -------------------------------------------------------
g.append("text")
  .attr("x", iw / 2)
  .attr("y", ih + 64)
  .attr("text-anchor", "middle")
  .attr("fill", t.ink)
  .style("font-size", "16px")
  .text("Drug Dosage (mg)");

g.append("text")
  .attr("transform", "rotate(-90)")
  .attr("x", -ih / 2)
  .attr("y", -90)
  .attr("text-anchor", "middle")
  .attr("fill", t.ink)
  .style("font-size", "16px")
  .text("Symptom Reduction (%)");

// --- Title -------------------------------------------------------------
svg
  .append("text")
  .attr("x", width / 2)
  .attr("y", 50)
  .attr("text-anchor", "middle")
  .attr("fill", t.ink)
  .style("font-size", "22px")
  .style("font-weight", "600")
  .text("ice-basic · javascript · d3 · anyplot.ai");
Runnable source as JSON, for any HTTP client: https://api.anyplot.ai/specs/ice-basic/d3/code. Any spec id and library id listed in llms-full.txt fit the same URL shape; every URL below is complete and callable.
{
  "spec_id": "ice-basic",
  "language": "javascript",
  "library": "d3",
  "page": "https://anyplot.ai/ice-basic/javascript/d3",
  "hub": "https://anyplot.ai/ice-basic",
  "code_json": "https://api.anyplot.ai/specs/ice-basic/d3/code",
  "spec_json": "https://api.anyplot.ai/specs/ice-basic",
  "render_light_png": "https://storage.googleapis.com/anyplot-images/plots/ice-basic/javascript/d3/plot-light.png",
  "render_dark_png": "https://storage.googleapis.com/anyplot-images/plots/ice-basic/javascript/d3/plot-dark.png",
  "interactive_light_html": "https://storage.googleapis.com/anyplot-images/plots/ice-basic/javascript/d3/plot-light.html",
  "interactive_dark_html": "https://storage.googleapis.com/anyplot-images/plots/ice-basic/javascript/d3/plot-dark.html",
  "quality_score": 96.0,
  "license": "MIT",
  "guide": "https://anyplot.ai/llms.txt"
}
Part of Individual Conditional Expectation (ICE) Plot on anyplot.ai.