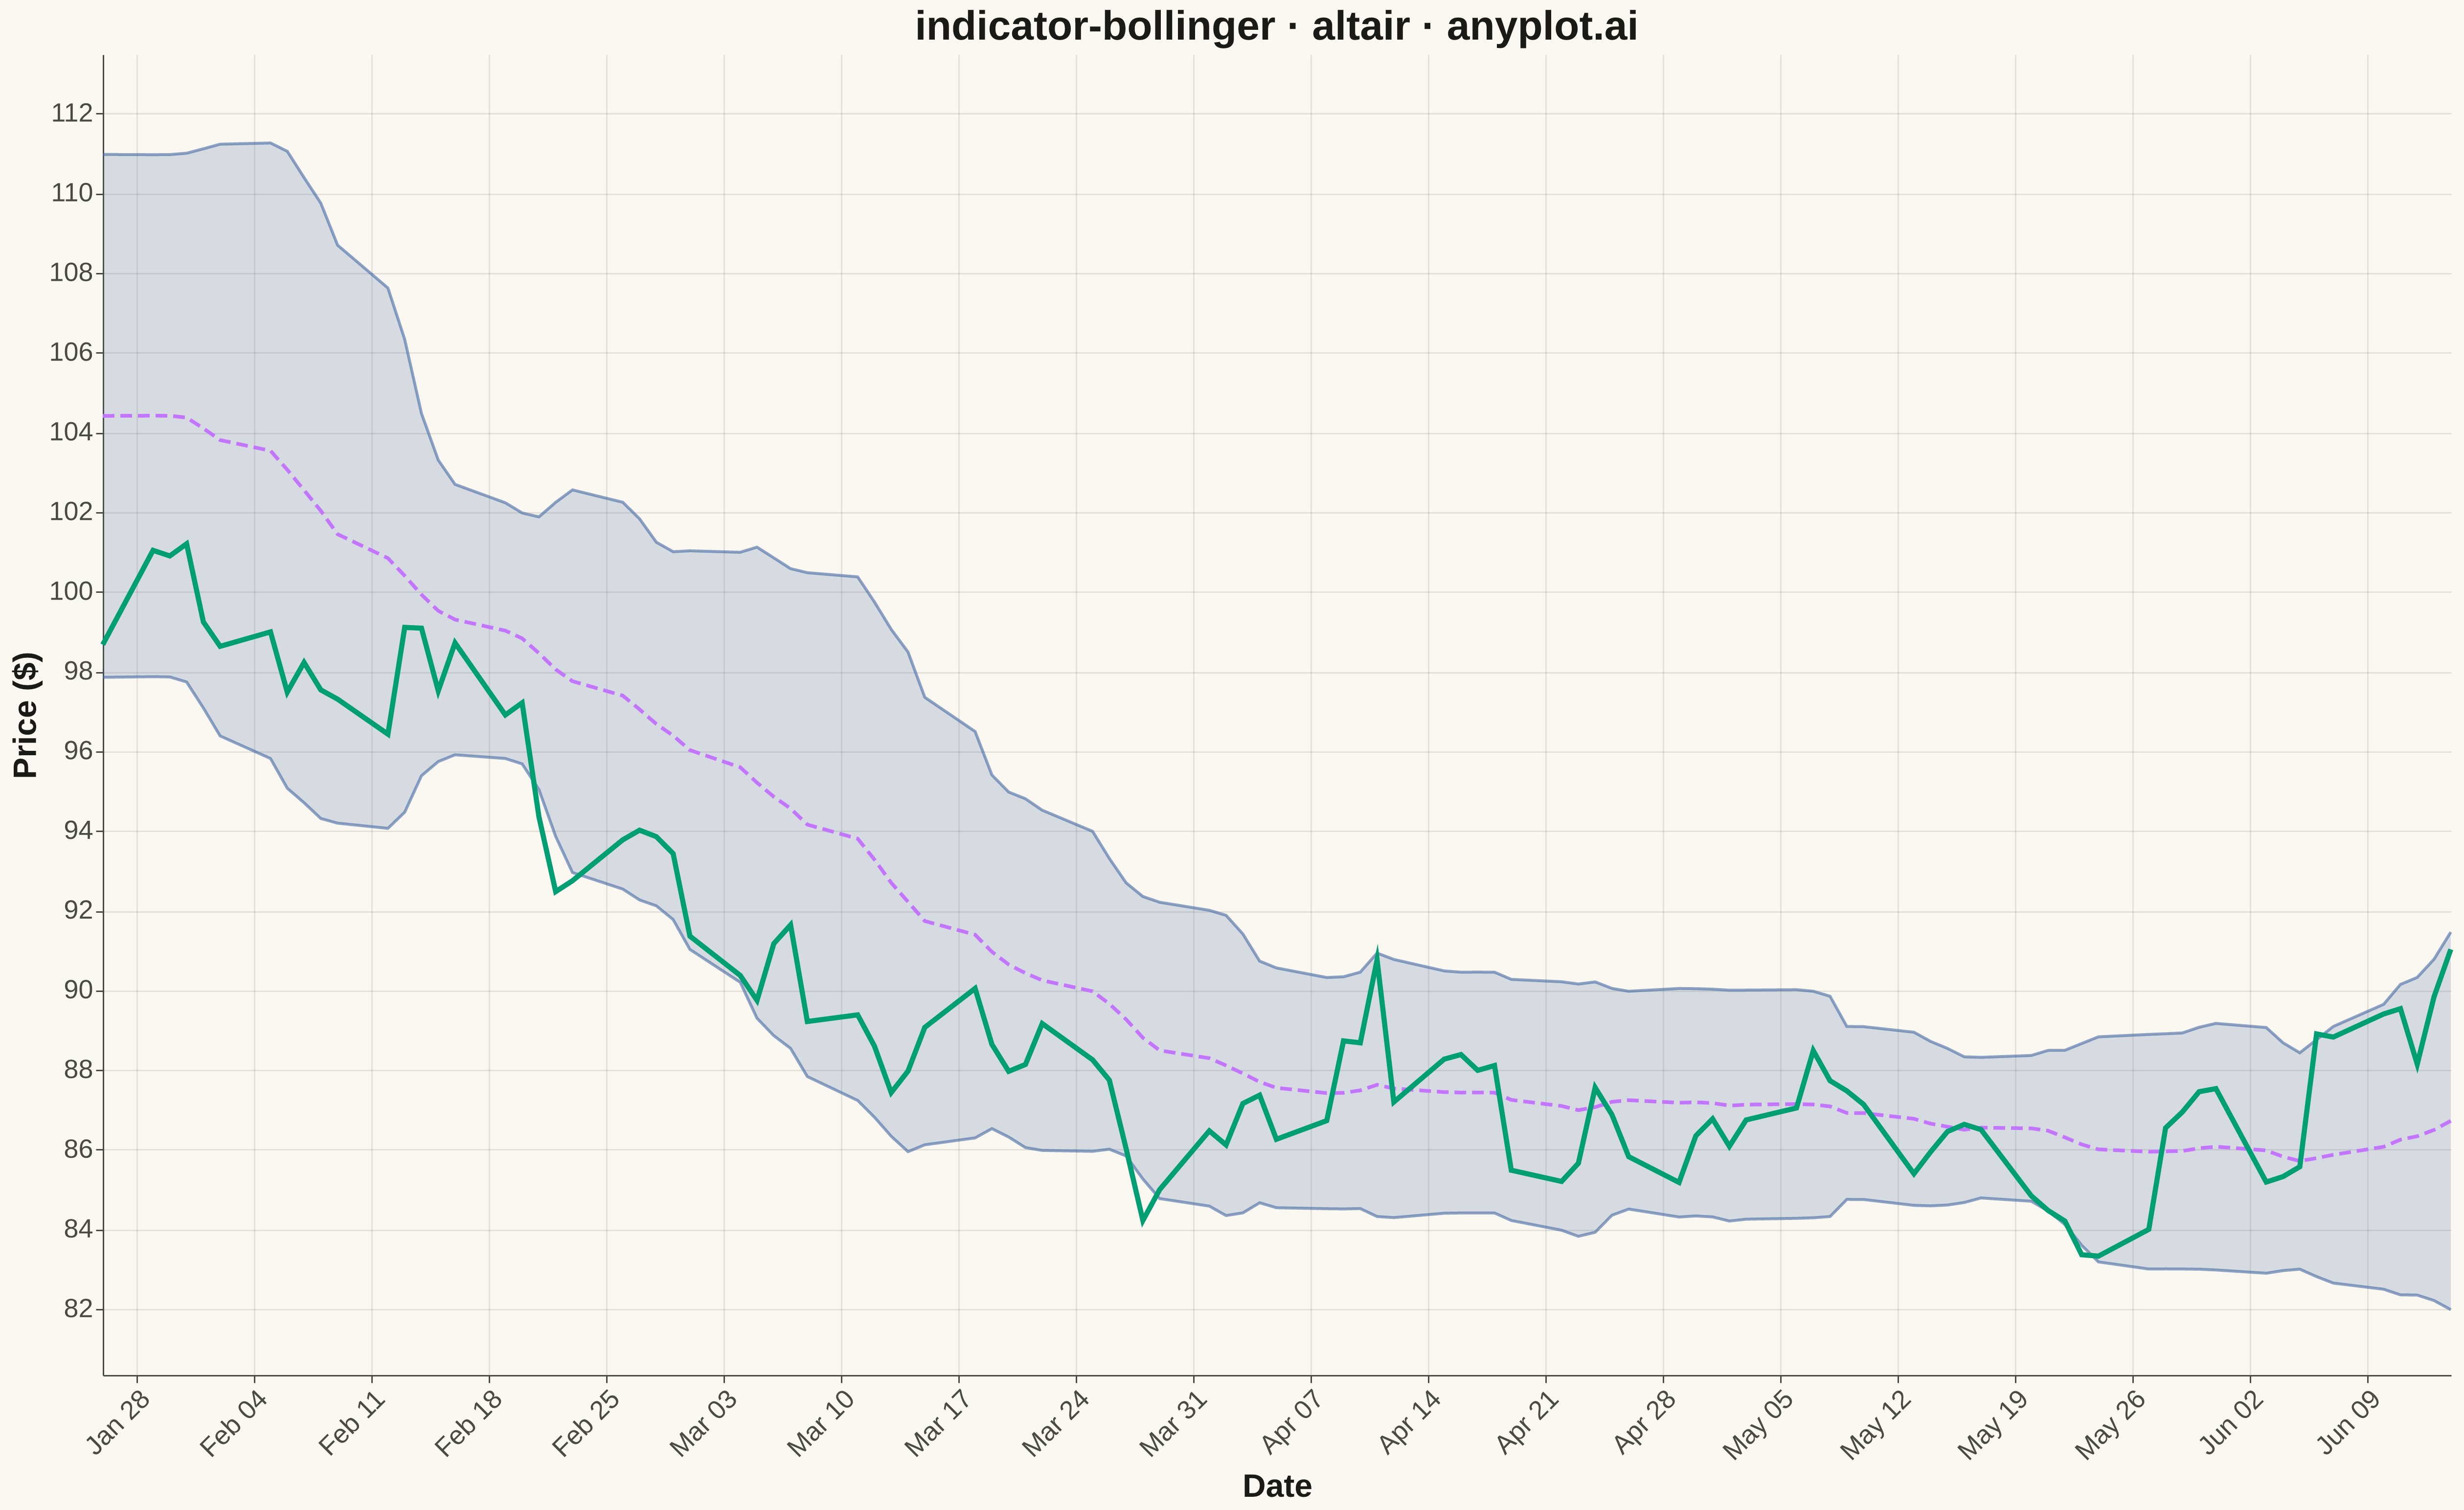
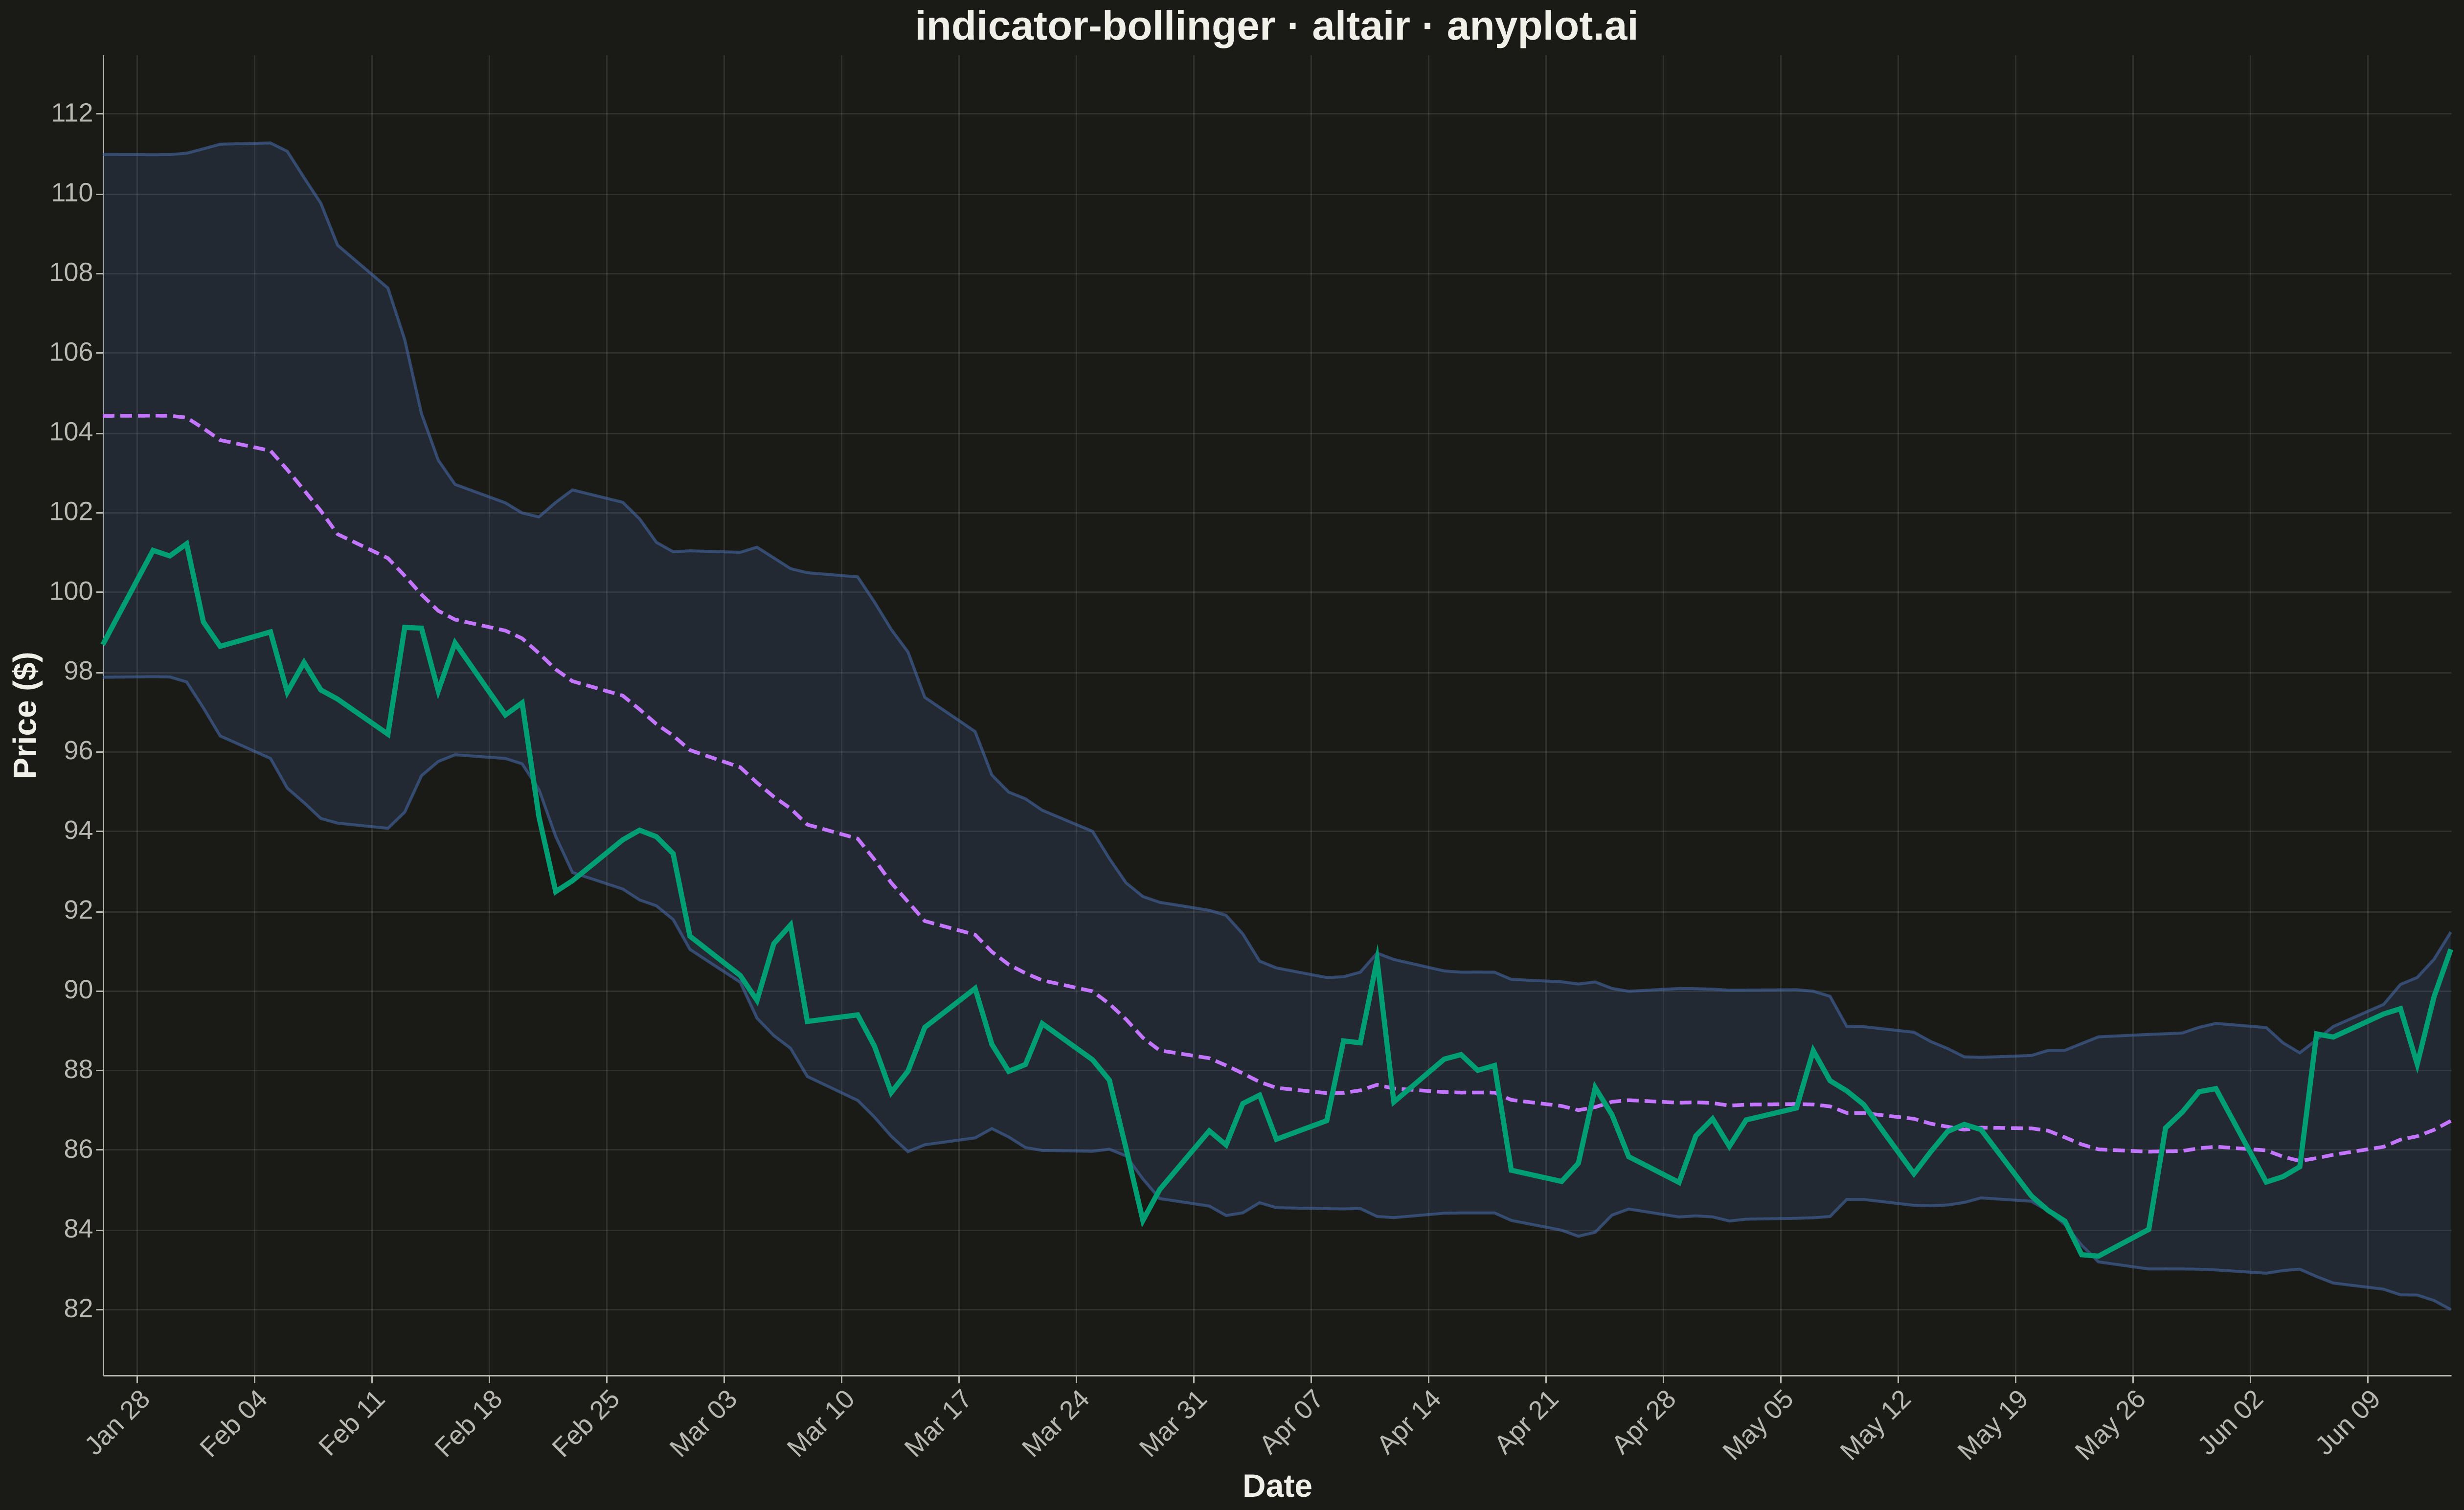
A Bollinger Bands chart displays price data with a volatility envelope consisting of three lines: a middle band (simple moving average), an upper band (SMA plus 2 standard deviations), and a lower band (SMA minus 2 standard deviations). This technical indicator helps traders identify overbought/oversold conditions, volatility patterns, and potential price breakouts by showing how prices relate to their recent statistical range.
Preview render from the Altair implementation.