The same plot in 14 other libraries — JavaScript: D3.js, Apache ECharts, Highcharts, MUI X Charts; Python: Altair, Bokeh, lets-plot, Matplotlib, Plotly, plotnine, Pygal, Seaborn; R: ggplot2; Julia: Makie.jl. Compare all 15 side by side: Bollinger Bands Indicator Chart in Python, R, Julia and JavaScript.
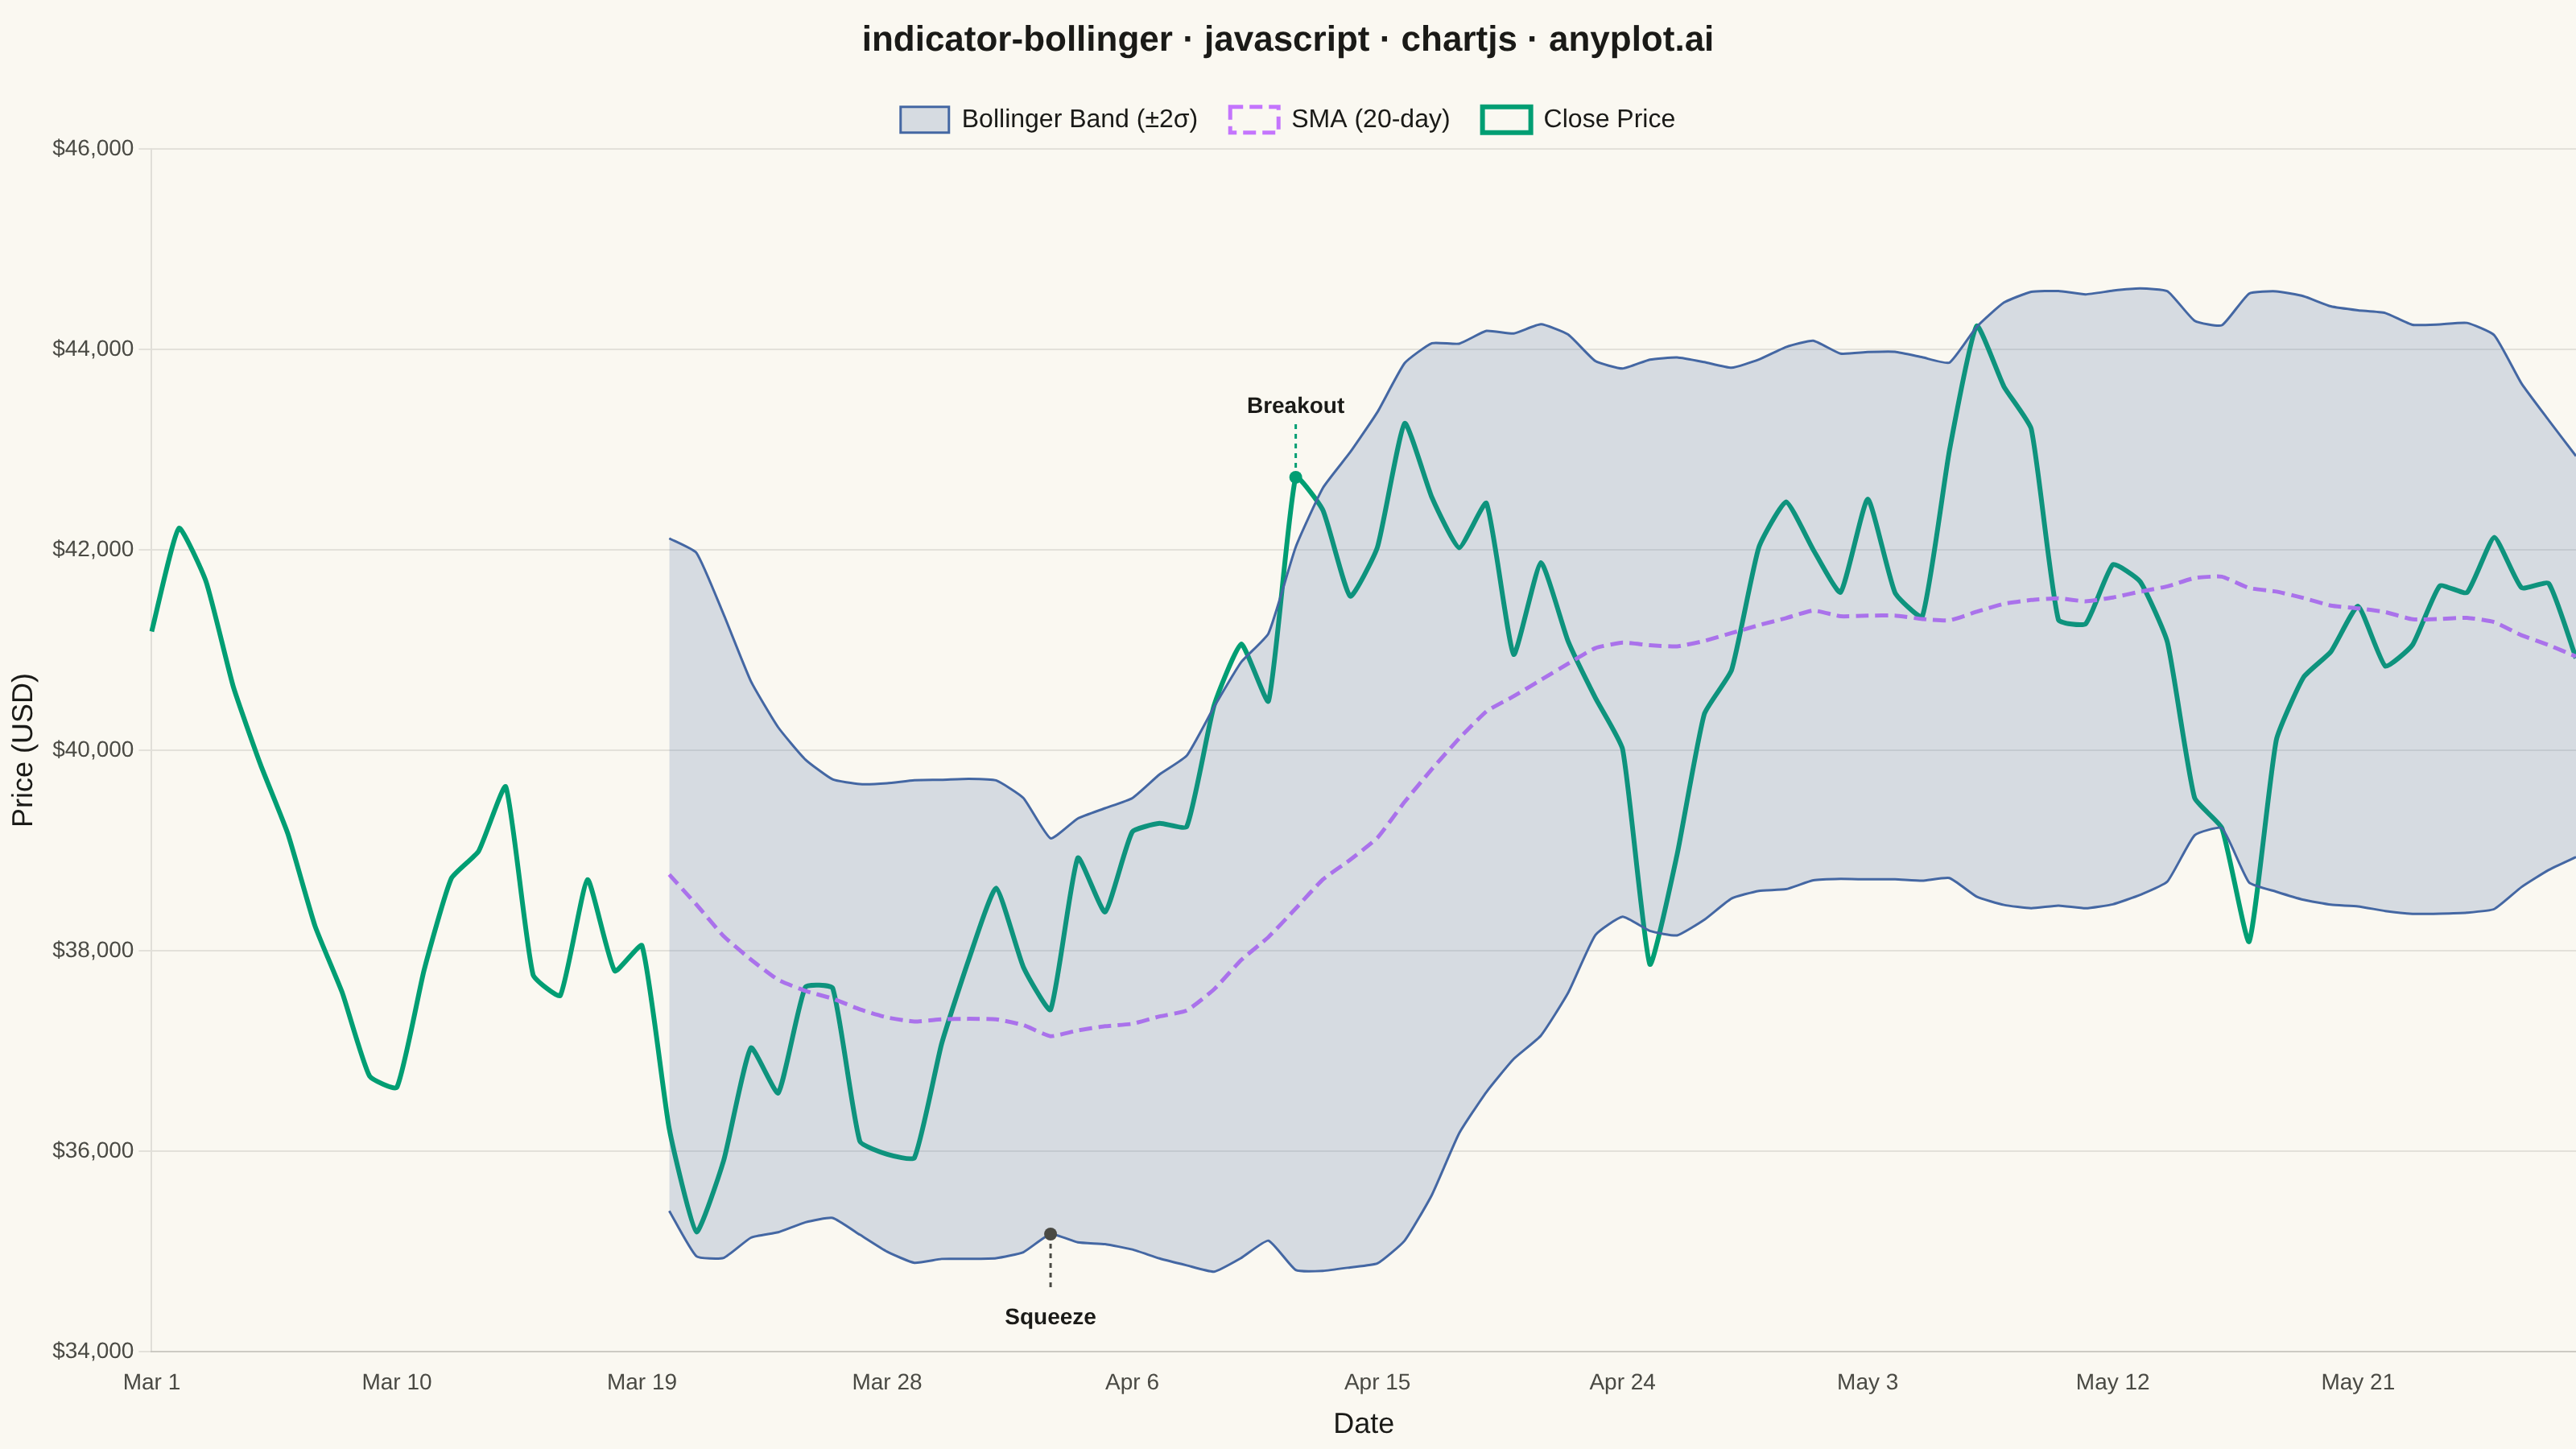
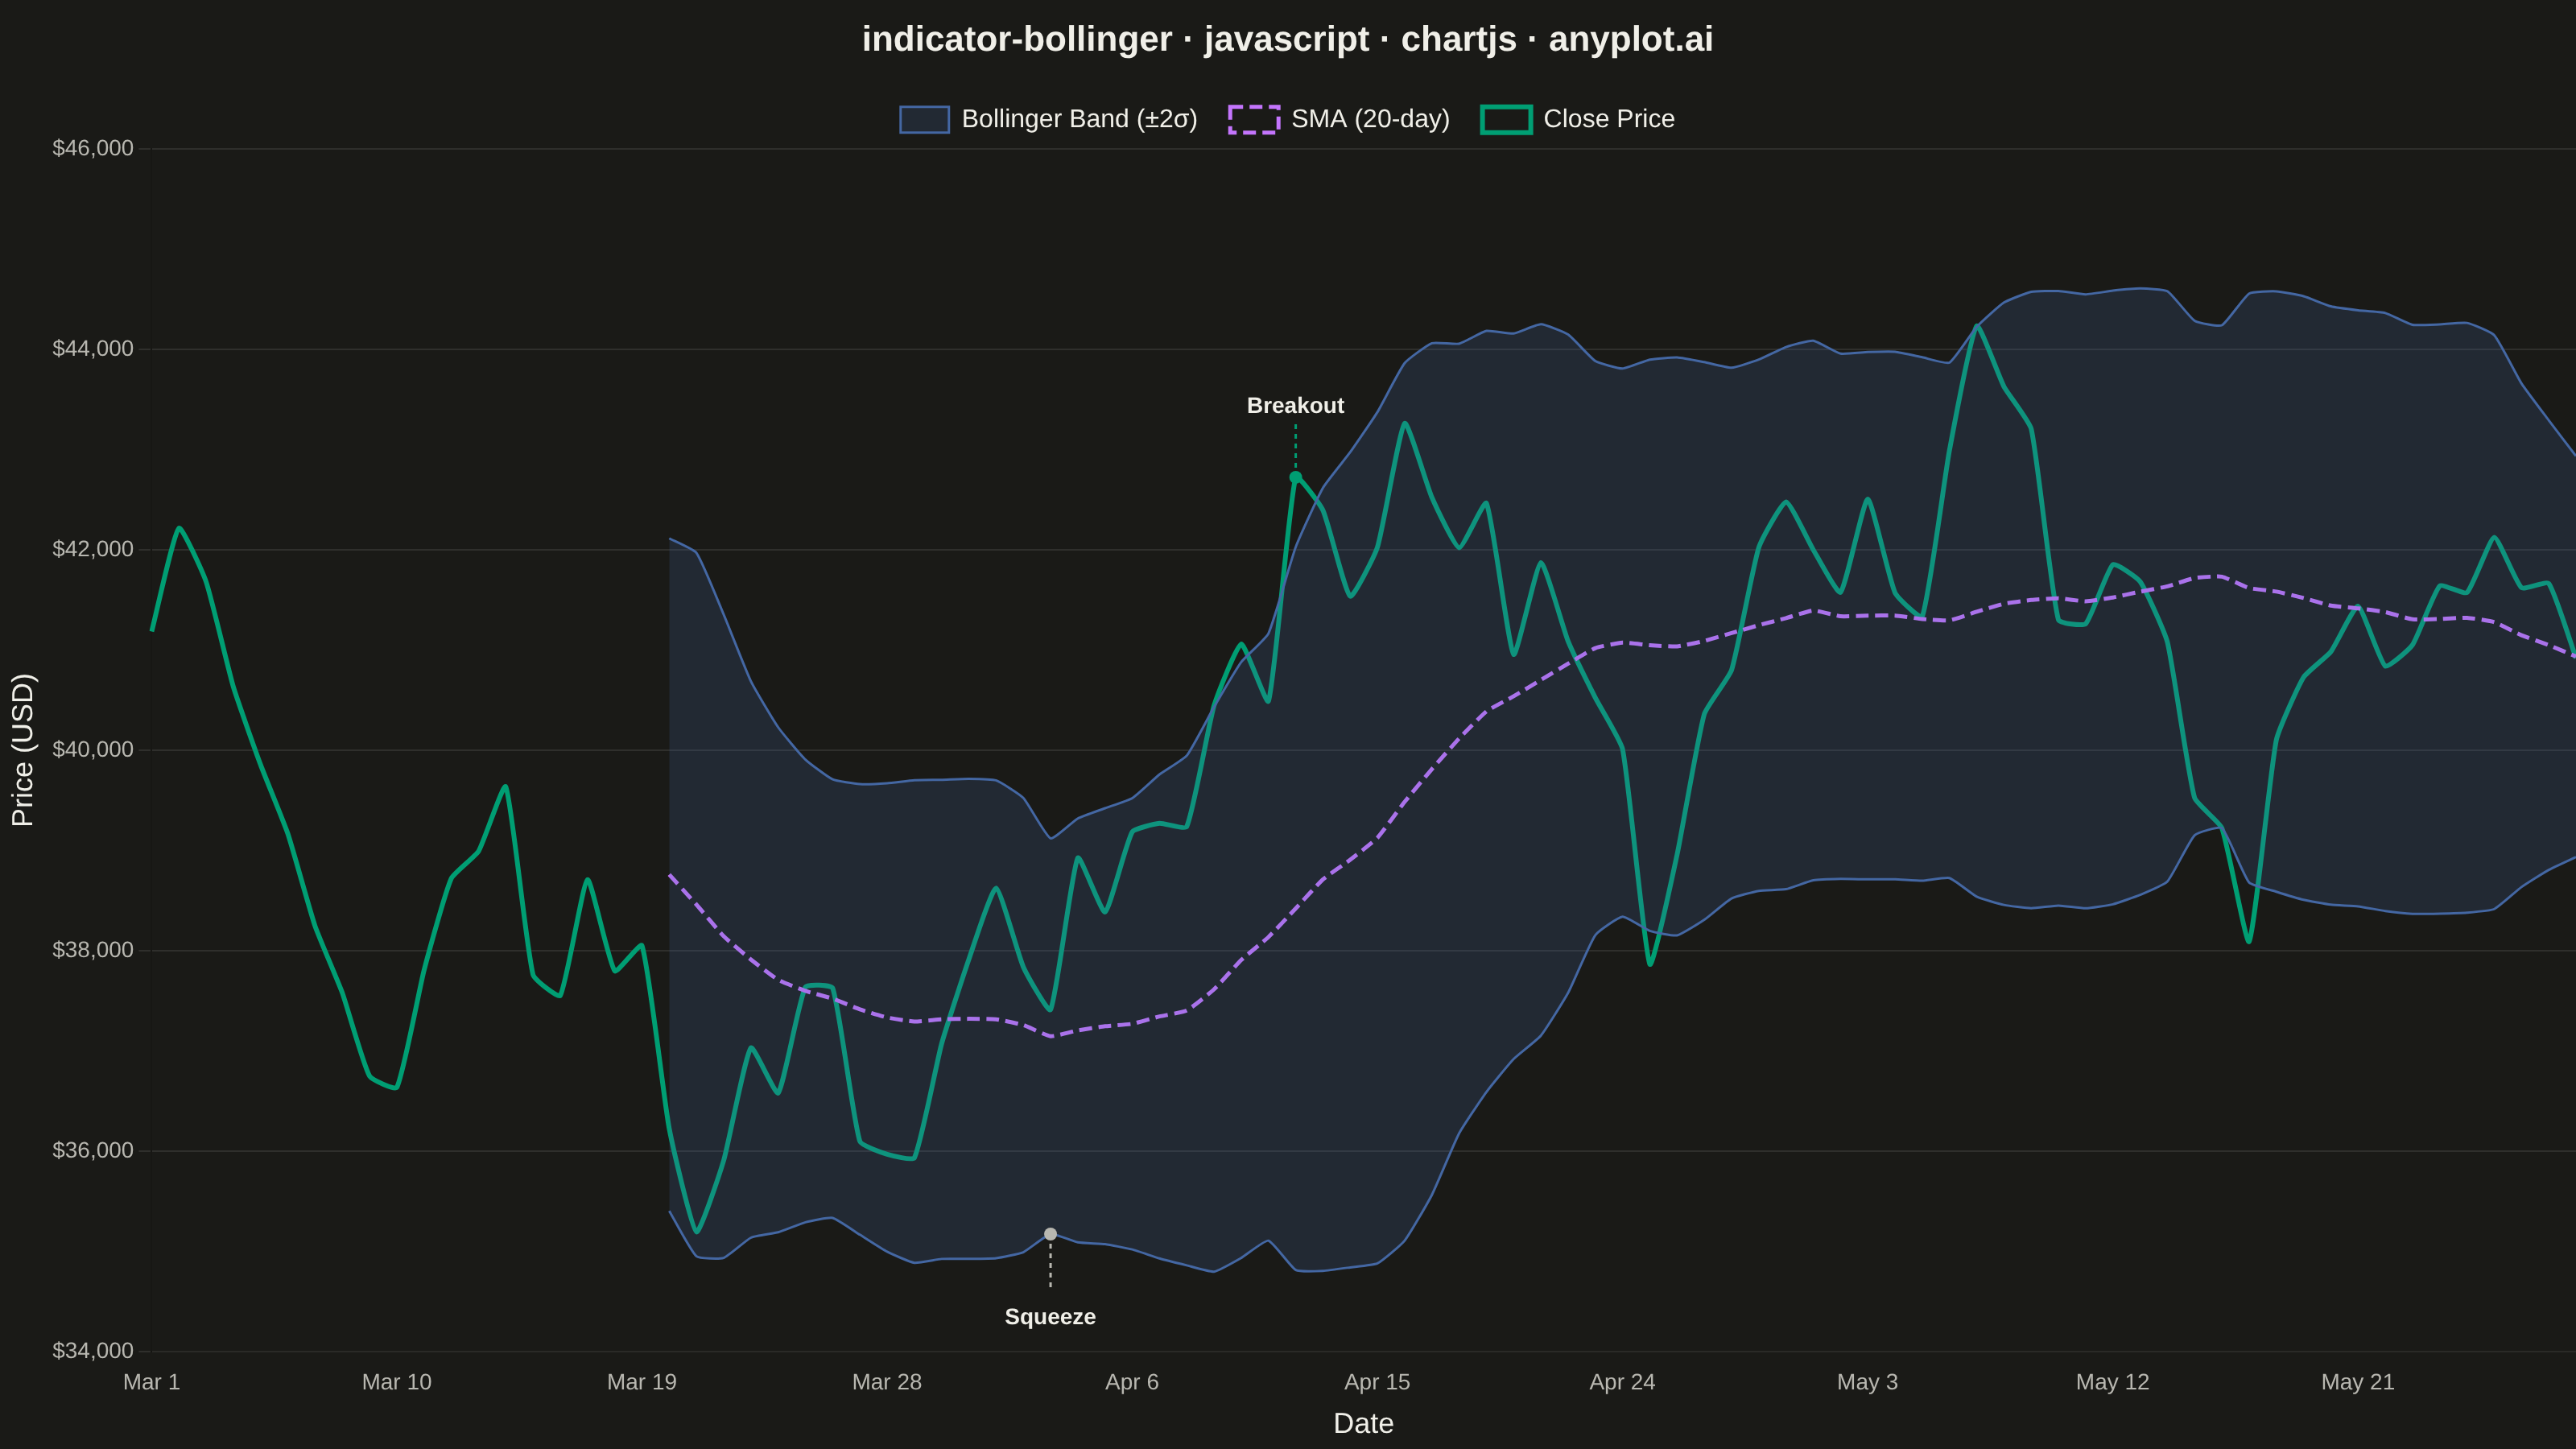
A Bollinger Bands chart displays price data with a volatility envelope consisting of three lines: a middle band (simple moving average), an upper band (SMA plus 2 standard deviations), and a lower band (SMA minus 2 standard deviations). This technical indicator helps traders identify overbought/oversold conditions, volatility patterns, and potential price breakouts by showing how prices relate to their recent statistical range.
// anyplot.ai
// indicator-bollinger: Bollinger Bands Indicator Chart
// Library: chartjs 4.4.7 | JavaScript 22.23.2
// Quality: 95/100 | Created: 2026-09-02

const t = window.ANYPLOT_TOKENS;

// --- Data: simulated BTC/USD daily close over 90 trading days --------------
// Tiny fixed-seed LCG — the browser has no seeded RNG.
function lcg(seed) {
  let state = seed;
  return () => {
    state = (state * 1664525 + 1013904223) % 4294967296;
    return state / 4294967296;
  };
}
const rand = lcg(1337);
function randNormal() {
  const u1 = Math.max(rand(), 1e-9);
  const u2 = rand();
  return Math.sqrt(-2 * Math.log(u1)) * Math.cos(2 * Math.PI * u2);
}

const N_DAYS = 90;
const WINDOW = 20;

const startDate = new Date(2024, 2, 1); // Mar 1 2024
const labels = Array.from({ length: N_DAYS }, (_, i) => {
  const d = new Date(startDate);
  d.setDate(d.getDate() + i);
  return d.toLocaleDateString("en-US", { month: "short", day: "numeric" });
});

const close = [];
let price = 42000;
for (let i = 0; i < N_DAYS; i++) {
  price *= 1 + (0.0006 + 0.028 * randNormal());
  close.push(price);
}

// Rolling 20-day SMA + upper/lower bands (SMA ± 2 sample std dev)
const sma = [];
const upperBand = [];
const lowerBand = [];
for (let i = 0; i < N_DAYS; i++) {
  if (i < WINDOW - 1) {
    sma.push(null);
    upperBand.push(null);
    lowerBand.push(null);
    continue;
  }
  const slice = close.slice(i - WINDOW + 1, i + 1);
  const mean = slice.reduce((a, b) => a + b, 0) / WINDOW;
  const variance = slice.reduce((a, b) => a + (b - mean) ** 2, 0) / (WINDOW - 1);
  const std = Math.sqrt(variance);
  sma.push(mean);
  upperBand.push(mean + 2 * std);
  lowerBand.push(mean - 2 * std);
}

function hexToRgba(hex, alpha) {
  const r = parseInt(hex.slice(1, 3), 16);
  const g = parseInt(hex.slice(3, 5), 16);
  const b = parseInt(hex.slice(5, 7), 16);
  return `rgba(${r}, ${g}, ${b}, ${alpha})`;
}

const bandColor = t.palette[2]; // blue — volatility envelope
const smaColor = t.palette[1]; // lavender — middle band

// --- Storytelling: locate the tightest squeeze and the sharpest breakout ---
let squeezeIdx = -1;
let minWidth = Infinity;
for (let i = WINDOW - 1; i < N_DAYS; i++) {
  const w = upperBand[i] - lowerBand[i];
  if (w < minWidth) {
    minWidth = w;
    squeezeIdx = i;
  }
}

let breakoutIdx = -1;
let maxDeviation = -Infinity;
for (let i = WINDOW - 1; i < N_DAYS; i++) {
  const dev = Math.max(close[i] - upperBand[i], lowerBand[i] - close[i]);
  if (dev > maxDeviation) {
    maxDeviation = dev;
    breakoutIdx = i;
  }
}

const calloutPlugin = {
  id: "bollingerCallouts",
  afterDatasetsDraw(chart) {
    const { ctx } = chart;
    const xScale = chart.scales.x;
    const yScale = chart.scales.y;

    function draw(idx, label, valueArr, color, dy) {
      const x = xScale.getPixelForValue(labels[idx], idx);
      const y = yScale.getPixelForValue(valueArr[idx]);
      const textY = y + dy + (dy > 0 ? 16 : -10);

      ctx.save();
      ctx.strokeStyle = color;
      ctx.lineWidth = 1.5;
      ctx.setLineDash([3, 3]);
      ctx.beginPath();
      ctx.moveTo(x, y);
      ctx.lineTo(x, y + dy);
      ctx.stroke();

      ctx.setLineDash([]);
      ctx.fillStyle = color;
      ctx.beginPath();
      ctx.arc(x, y, 4, 0, Math.PI * 2);
      ctx.fill();

      ctx.font = "600 14px sans-serif";
      ctx.fillStyle = t.ink;
      ctx.textAlign = "center";
      ctx.fillText(label, x, textY);
      ctx.restore();
    }

    draw(squeezeIdx, "Squeeze", lowerBand, t.inkSoft, 36);
    draw(breakoutIdx, "Breakout", close, t.palette[0], -34);
  },
};

// --- Mount -------------------------------------------------------------
const canvas = document.createElement("canvas");
document.getElementById("container").appendChild(canvas);

// --- Chart ---------------------------------------------------------------
new Chart(canvas, {
  type: "line",
  plugins: [calloutPlugin],
  data: {
    labels,
    datasets: [
      {
        label: "Upper Band",
        data: upperBand,
        borderColor: bandColor,
        backgroundColor: "transparent",
        borderWidth: 1.5,
        pointRadius: 0,
        fill: false,
        tension: 0.15,
      },
      {
        label: "Bollinger Band (±2σ)",
        data: lowerBand,
        borderColor: bandColor,
        backgroundColor: hexToRgba(bandColor, 0.2),
        borderWidth: 1.5,
        pointRadius: 0,
        fill: "-1",
        tension: 0.15,
      },
      {
        label: "SMA (20-day)",
        data: sma,
        borderColor: smaColor,
        backgroundColor: "transparent",
        borderWidth: 2.5,
        borderDash: [8, 4],
        pointRadius: 0,
        fill: false,
        tension: 0.15,
      },
      {
        label: "Close Price",
        data: close,
        borderColor: t.palette[0],
        backgroundColor: "transparent",
        borderWidth: 3,
        pointRadius: 0,
        fill: false,
        tension: 0.15,
      },
    ],
  },
  options: {
    responsive: true,
    maintainAspectRatio: false,
    animation: false,
    interaction: { intersect: false, mode: "index" },
    plugins: {
      title: {
        display: true,
        text: "indicator-bollinger · javascript · chartjs · anyplot.ai",
        color: t.ink,
        font: { size: 22 },
        padding: { top: 12, bottom: 8 },
      },
      legend: {
        labels: {
          color: t.ink,
          font: { size: 16 },
          boxWidth: 30,
          padding: 20,
          filter: (item) => item.text !== "Upper Band",
        },
      },
    },
    scales: {
      x: {
        title: { display: true, text: "Date", color: t.ink, font: { size: 18 } },
        ticks: { color: t.inkSoft, font: { size: 14 }, maxTicksLimit: 10, autoSkip: true },
        grid: { display: false },
      },
      y: {
        title: { display: true, text: "Price (USD)", color: t.ink, font: { size: 18 } },
        ticks: {
          color: t.inkSoft,
          font: { size: 14 },
          callback: (v) => "$" + v.toLocaleString(),
        },
        grid: { color: hexToRgba(t.ink, 0.1), lineWidth: 1 },
      },
    },
  },
});
Runnable source as JSON, for any HTTP client: https://api.anyplot.ai/specs/indicator-bollinger/chartjs/code. Any spec id and library id listed in llms-full.txt fit the same URL shape; every URL below is complete and callable.
{
  "spec_id": "indicator-bollinger",
  "language": "javascript",
  "library": "chartjs",
  "page": "https://anyplot.ai/indicator-bollinger/javascript/chartjs",
  "hub": "https://anyplot.ai/indicator-bollinger",
  "code_json": "https://api.anyplot.ai/specs/indicator-bollinger/chartjs/code",
  "spec_json": "https://api.anyplot.ai/specs/indicator-bollinger",
  "render_light_png": "https://storage.googleapis.com/anyplot-images/plots/indicator-bollinger/javascript/chartjs/plot-light.png",
  "render_dark_png": "https://storage.googleapis.com/anyplot-images/plots/indicator-bollinger/javascript/chartjs/plot-dark.png",
  "interactive_light_html": "https://storage.googleapis.com/anyplot-images/plots/indicator-bollinger/javascript/chartjs/plot-light.html",
  "interactive_dark_html": "https://storage.googleapis.com/anyplot-images/plots/indicator-bollinger/javascript/chartjs/plot-dark.html",
  "quality_score": 95.0,
  "license": "MIT",
  "guide": "https://anyplot.ai/llms.txt"
}
Part of Bollinger Bands Indicator Chart on anyplot.ai.