The same plot in 14 other libraries — JavaScript: Chart.js, D3.js, Apache ECharts, MUI X Charts; Python: Altair, Bokeh, lets-plot, Matplotlib, Plotly, plotnine, Pygal, Seaborn; R: ggplot2; Julia: Makie.jl. Compare all 15 side by side: Bollinger Bands Indicator Chart in Python, R, Julia and JavaScript.
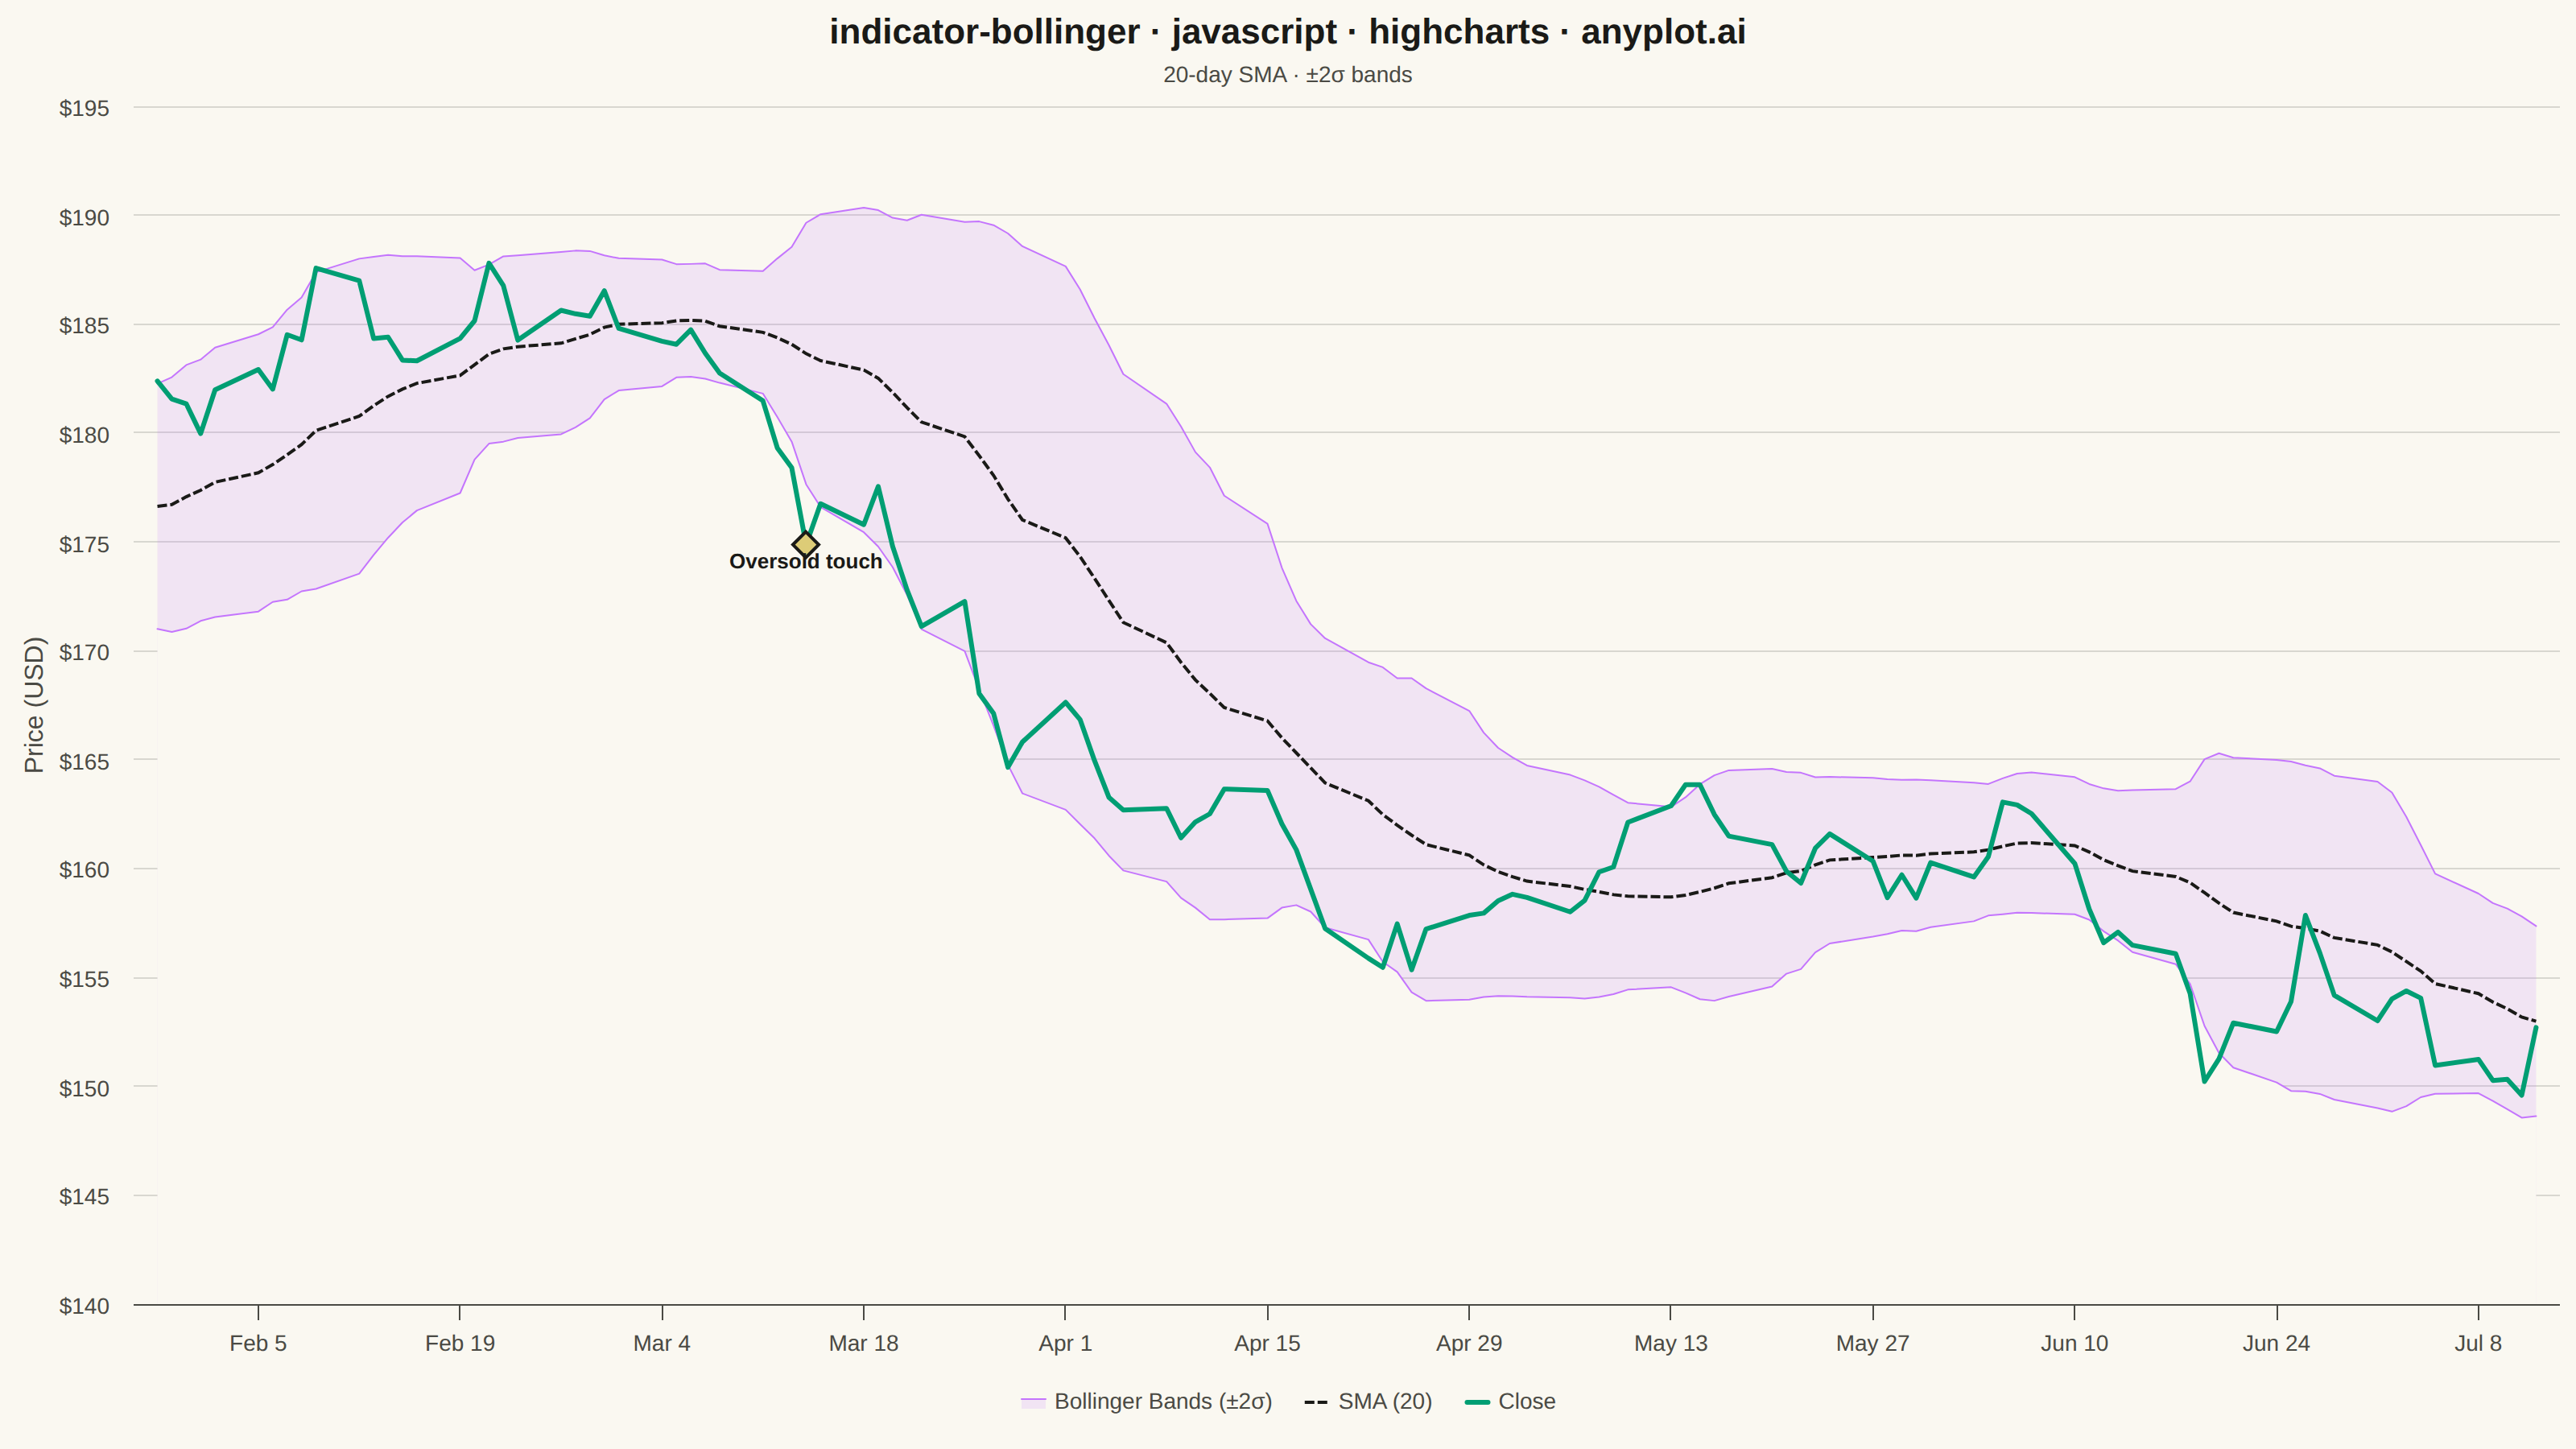
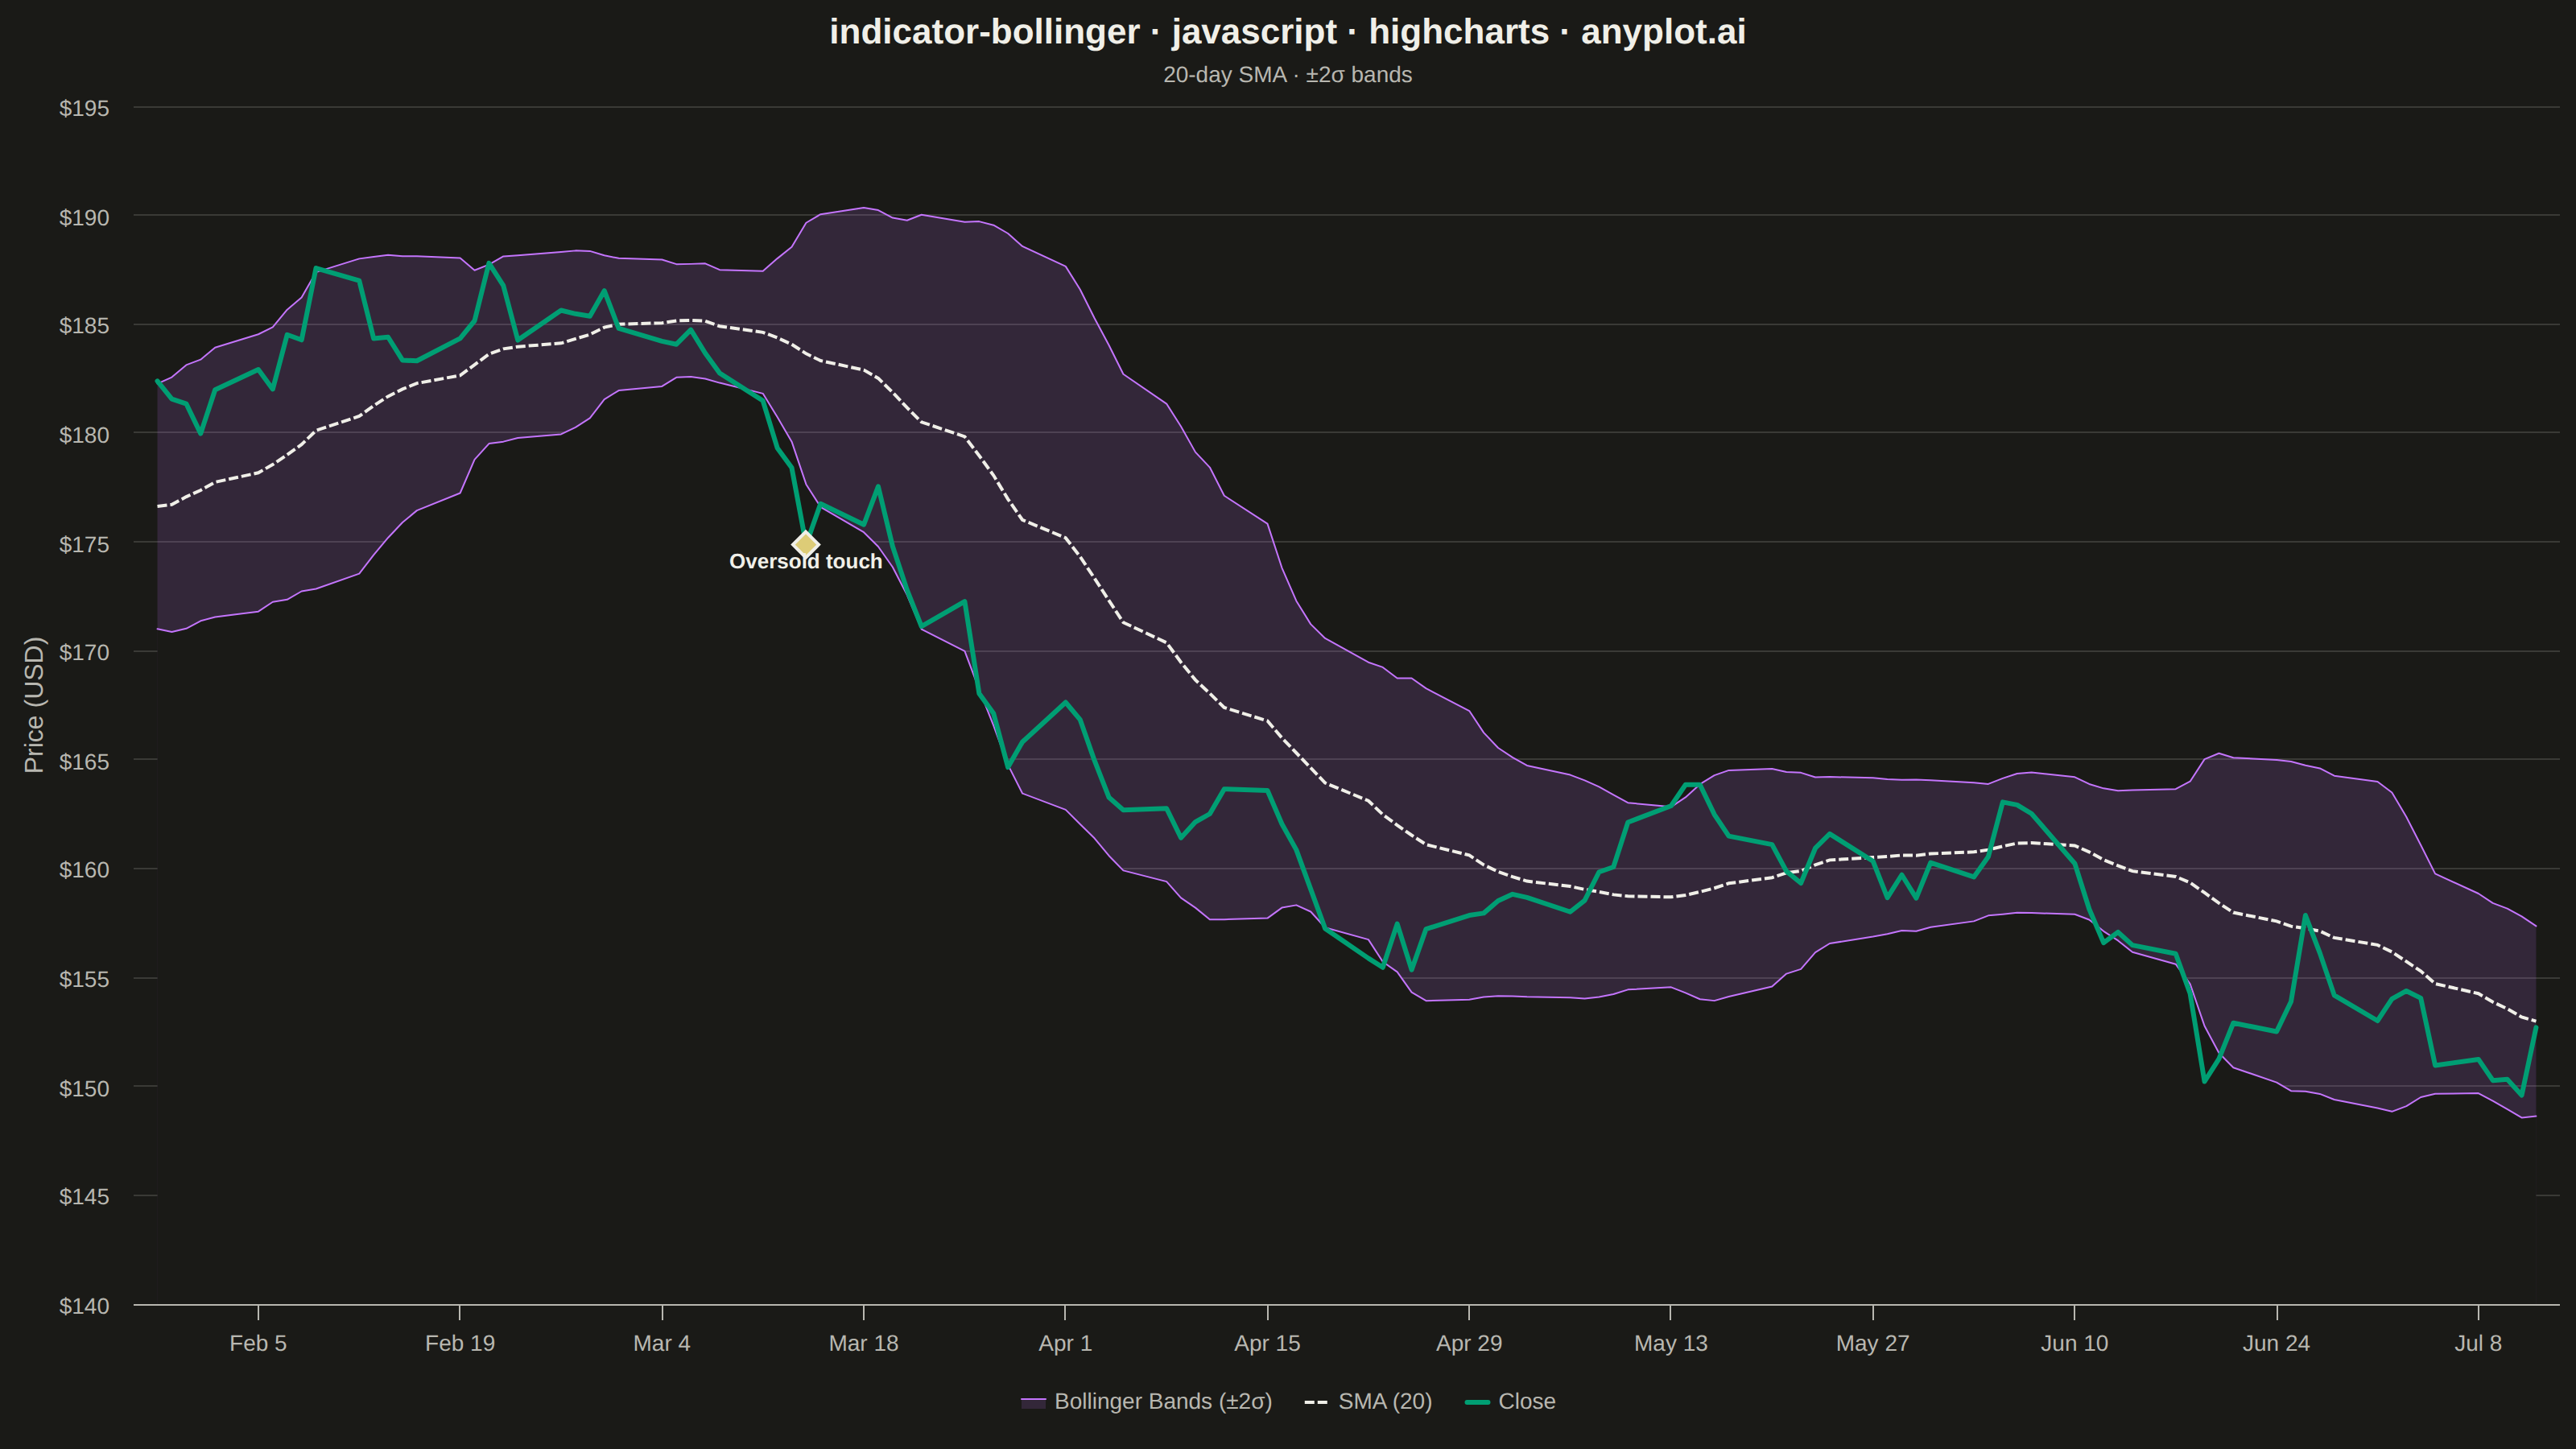
A Bollinger Bands chart displays price data with a volatility envelope consisting of three lines: a middle band (simple moving average), an upper band (SMA plus 2 standard deviations), and a lower band (SMA minus 2 standard deviations). This technical indicator helps traders identify overbought/oversold conditions, volatility patterns, and potential price breakouts by showing how prices relate to their recent statistical range.
// anyplot.ai
// indicator-bollinger: Bollinger Bands Indicator Chart
// Library: highcharts 12.6.0 | JavaScript 22.23.2
// Quality: 93/100 | Created: 2026-09-02

//# anyplot-orientation: landscape
const t = window.ANYPLOT_TOKENS;

// --- Data (in-memory, deterministic) ----------------------------------------
// Tiny LCG so the random walk is reproducible without a browser RNG.
let seed = 42;
function lcg() {
  seed = (seed * 16807) % 2147483647;
  return (seed - 1) / 2147483646;
}
function randNormal() {
  const u1 = Math.max(lcg(), 1e-9);
  const u2 = lcg();
  return Math.sqrt(-2 * Math.log(u1)) * Math.cos(2 * Math.PI * u2);
}

const period = 20;
const rawDays = 139; // trimmed to 120 trading days once the SMA window fills

const closes = [180];
for (let i = 1; i < rawDays; i++) {
  closes.push(closes[i - 1] + randNormal() * 1.5);
}

const timestamps = [];
let cursor = Date.UTC(2024, 0, 2);
for (let i = 0; i < rawDays; i++) {
  const day = new Date(cursor).getUTCDay();
  if (day === 6) cursor += 2 * 86400000;
  else if (day === 0) cursor += 86400000;
  timestamps.push(cursor);
  cursor += 86400000;
}

const closeData = [];
const smaData = [];
const upperData = [];
const lowerData = [];
for (let i = period - 1; i < rawDays; i++) {
  const window_ = closes.slice(i - period + 1, i + 1);
  const mean = window_.reduce((a, b) => a + b, 0) / period;
  const variance = window_.reduce((a, b) => a + (b - mean) ** 2, 0) / period;
  const std = Math.sqrt(variance);
  const x = timestamps[i];
  closeData.push([x, Math.round(closes[i] * 100) / 100]);
  smaData.push([x, Math.round(mean * 100) / 100]);
  upperData.push([x, Math.round((mean + 2 * std) * 100) / 100]);
  lowerData.push([x, Math.round((mean - 2 * std) * 100) / 100]);
}

// Area series default to a zero threshold, which would force the y-axis down
// to $0 and waste most of the canvas on empty space. Pin explicit bounds from
// the actual data range instead — standard practice for price charts.
const yMin = Math.min(...lowerData.map((d) => d[1]));
const yMax = Math.max(...upperData.map((d) => d[1]));
const yPad = (yMax - yMin) * 0.1;

// Find the single most extreme band touch (closest approach of price to
// either envelope edge) to call out as an overbought/oversold focal point.
let touchIdx = 0;
let touchType = "upper";
let minGap = Infinity;
for (let i = 0; i < closeData.length; i++) {
  const gapUpper = upperData[i][1] - closeData[i][1];
  const gapLower = closeData[i][1] - lowerData[i][1];
  if (gapUpper < minGap) {
    minGap = gapUpper;
    touchIdx = i;
    touchType = "upper";
  }
  if (gapLower < minGap) {
    minGap = gapLower;
    touchIdx = i;
    touchType = "lower";
  }
}
const touchPoint = closeData[touchIdx];
const touchLabel = touchType === "upper" ? "Overbought touch" : "Oversold touch";

// --- Chart -------------------------------------------------------------------
// Bollinger fill without the arearange module: an upper "area" (tinted, fills
// toward the axis floor) drawn under a lower "area" filled in the page
// background color, which masks everything below the lower band — leaving
// only the band between the two lines visibly tinted.
Highcharts.chart("container", {
  chart: {
    type: "line",
    backgroundColor: "transparent",
    animation: false,
    style: { fontFamily: "inherit" },
  },
  credits: { enabled: false },
  colors: t.palette,
  title: {
    text: "indicator-bollinger · javascript · highcharts · anyplot.ai",
    style: { color: t.ink, fontSize: "22px", fontWeight: "600" },
  },
  subtitle: {
    text: "20-day SMA · ±2σ bands",
    style: { color: t.inkSoft, fontSize: "14px" },
  },
  xAxis: {
    type: "datetime",
    lineColor: t.inkSoft,
    tickColor: t.inkSoft,
    gridLineColor: t.grid,
    labels: { style: { color: t.inkSoft, fontSize: "14px" } },
  },
  yAxis: {
    title: { text: "Price (USD)", style: { color: t.inkSoft, fontSize: "16px" } },
    gridLineColor: t.grid,
    labels: { style: { color: t.inkSoft, fontSize: "14px" }, format: "${value}" },
    min: Math.floor(yMin - yPad),
    max: Math.ceil(yMax + yPad),
  },
  legend: {
    itemStyle: { color: t.inkSoft, fontSize: "14px" },
    itemHoverStyle: { color: t.ink },
  },
  tooltip: { shared: true, valueDecimals: 2, valuePrefix: "$" },
  plotOptions: {
    series: { animation: false, marker: { enabled: false } },
  },
  series: [
    {
      name: "Bollinger Bands (±2σ)",
      type: "area",
      data: upperData,
      color: t.palette[1],
      fillOpacity: 0.15,
      lineWidth: 1,
    },
    {
      name: "Lower Band (-2σ)",
      type: "area",
      data: lowerData,
      color: t.palette[1],
      fillColor: t.pageBg,
      fillOpacity: 1,
      lineWidth: 1,
      showInLegend: false,
    },
    {
      name: "SMA (20)",
      type: "line",
      data: smaData,
      color: t.ink,
      dashStyle: "ShortDash",
      lineWidth: 2,
    },
    {
      name: "Close",
      type: "line",
      data: closeData,
      color: t.palette[0],
      lineWidth: 3,
    },
    {
      name: touchLabel,
      type: "scatter",
      data: [touchPoint],
      color: t.amber,
      marker: {
        enabled: true,
        symbol: "diamond",
        radius: 8,
        lineWidth: 2,
        lineColor: t.ink,
      },
      dataLabels: {
        enabled: true,
        format: touchLabel,
        y: touchType === "upper" ? -16 : 22,
        style: { color: t.ink, fontSize: "13px", fontWeight: "600", textOutline: "none" },
      },
      showInLegend: false,
      enableMouseTracking: false,
    },
  ],
});
Runnable source as JSON, for any HTTP client: https://api.anyplot.ai/specs/indicator-bollinger/highcharts/code. Any spec id and library id listed in llms-full.txt fit the same URL shape; every URL below is complete and callable.
{
  "spec_id": "indicator-bollinger",
  "language": "javascript",
  "library": "highcharts",
  "page": "https://anyplot.ai/indicator-bollinger/javascript/highcharts",
  "hub": "https://anyplot.ai/indicator-bollinger",
  "code_json": "https://api.anyplot.ai/specs/indicator-bollinger/highcharts/code",
  "spec_json": "https://api.anyplot.ai/specs/indicator-bollinger",
  "render_light_png": "https://storage.googleapis.com/anyplot-images/plots/indicator-bollinger/javascript/highcharts/plot-light.png",
  "render_dark_png": "https://storage.googleapis.com/anyplot-images/plots/indicator-bollinger/javascript/highcharts/plot-dark.png",
  "interactive_light_html": "https://storage.googleapis.com/anyplot-images/plots/indicator-bollinger/javascript/highcharts/plot-light.html",
  "interactive_dark_html": "https://storage.googleapis.com/anyplot-images/plots/indicator-bollinger/javascript/highcharts/plot-dark.html",
  "quality_score": 93.0,
  "license": "MIT",
  "guide": "https://anyplot.ai/llms.txt"
}
Part of Bollinger Bands Indicator Chart on anyplot.ai.