The same plot in 14 other libraries — JavaScript: Chart.js, D3.js, Highcharts, MUI X Charts; Python: Altair, Bokeh, lets-plot, Matplotlib, Plotly, plotnine, Pygal, Seaborn; R: ggplot2; Julia: Makie.jl. Compare all 15 side by side: Bollinger Bands Indicator Chart in Python, R, Julia and JavaScript.
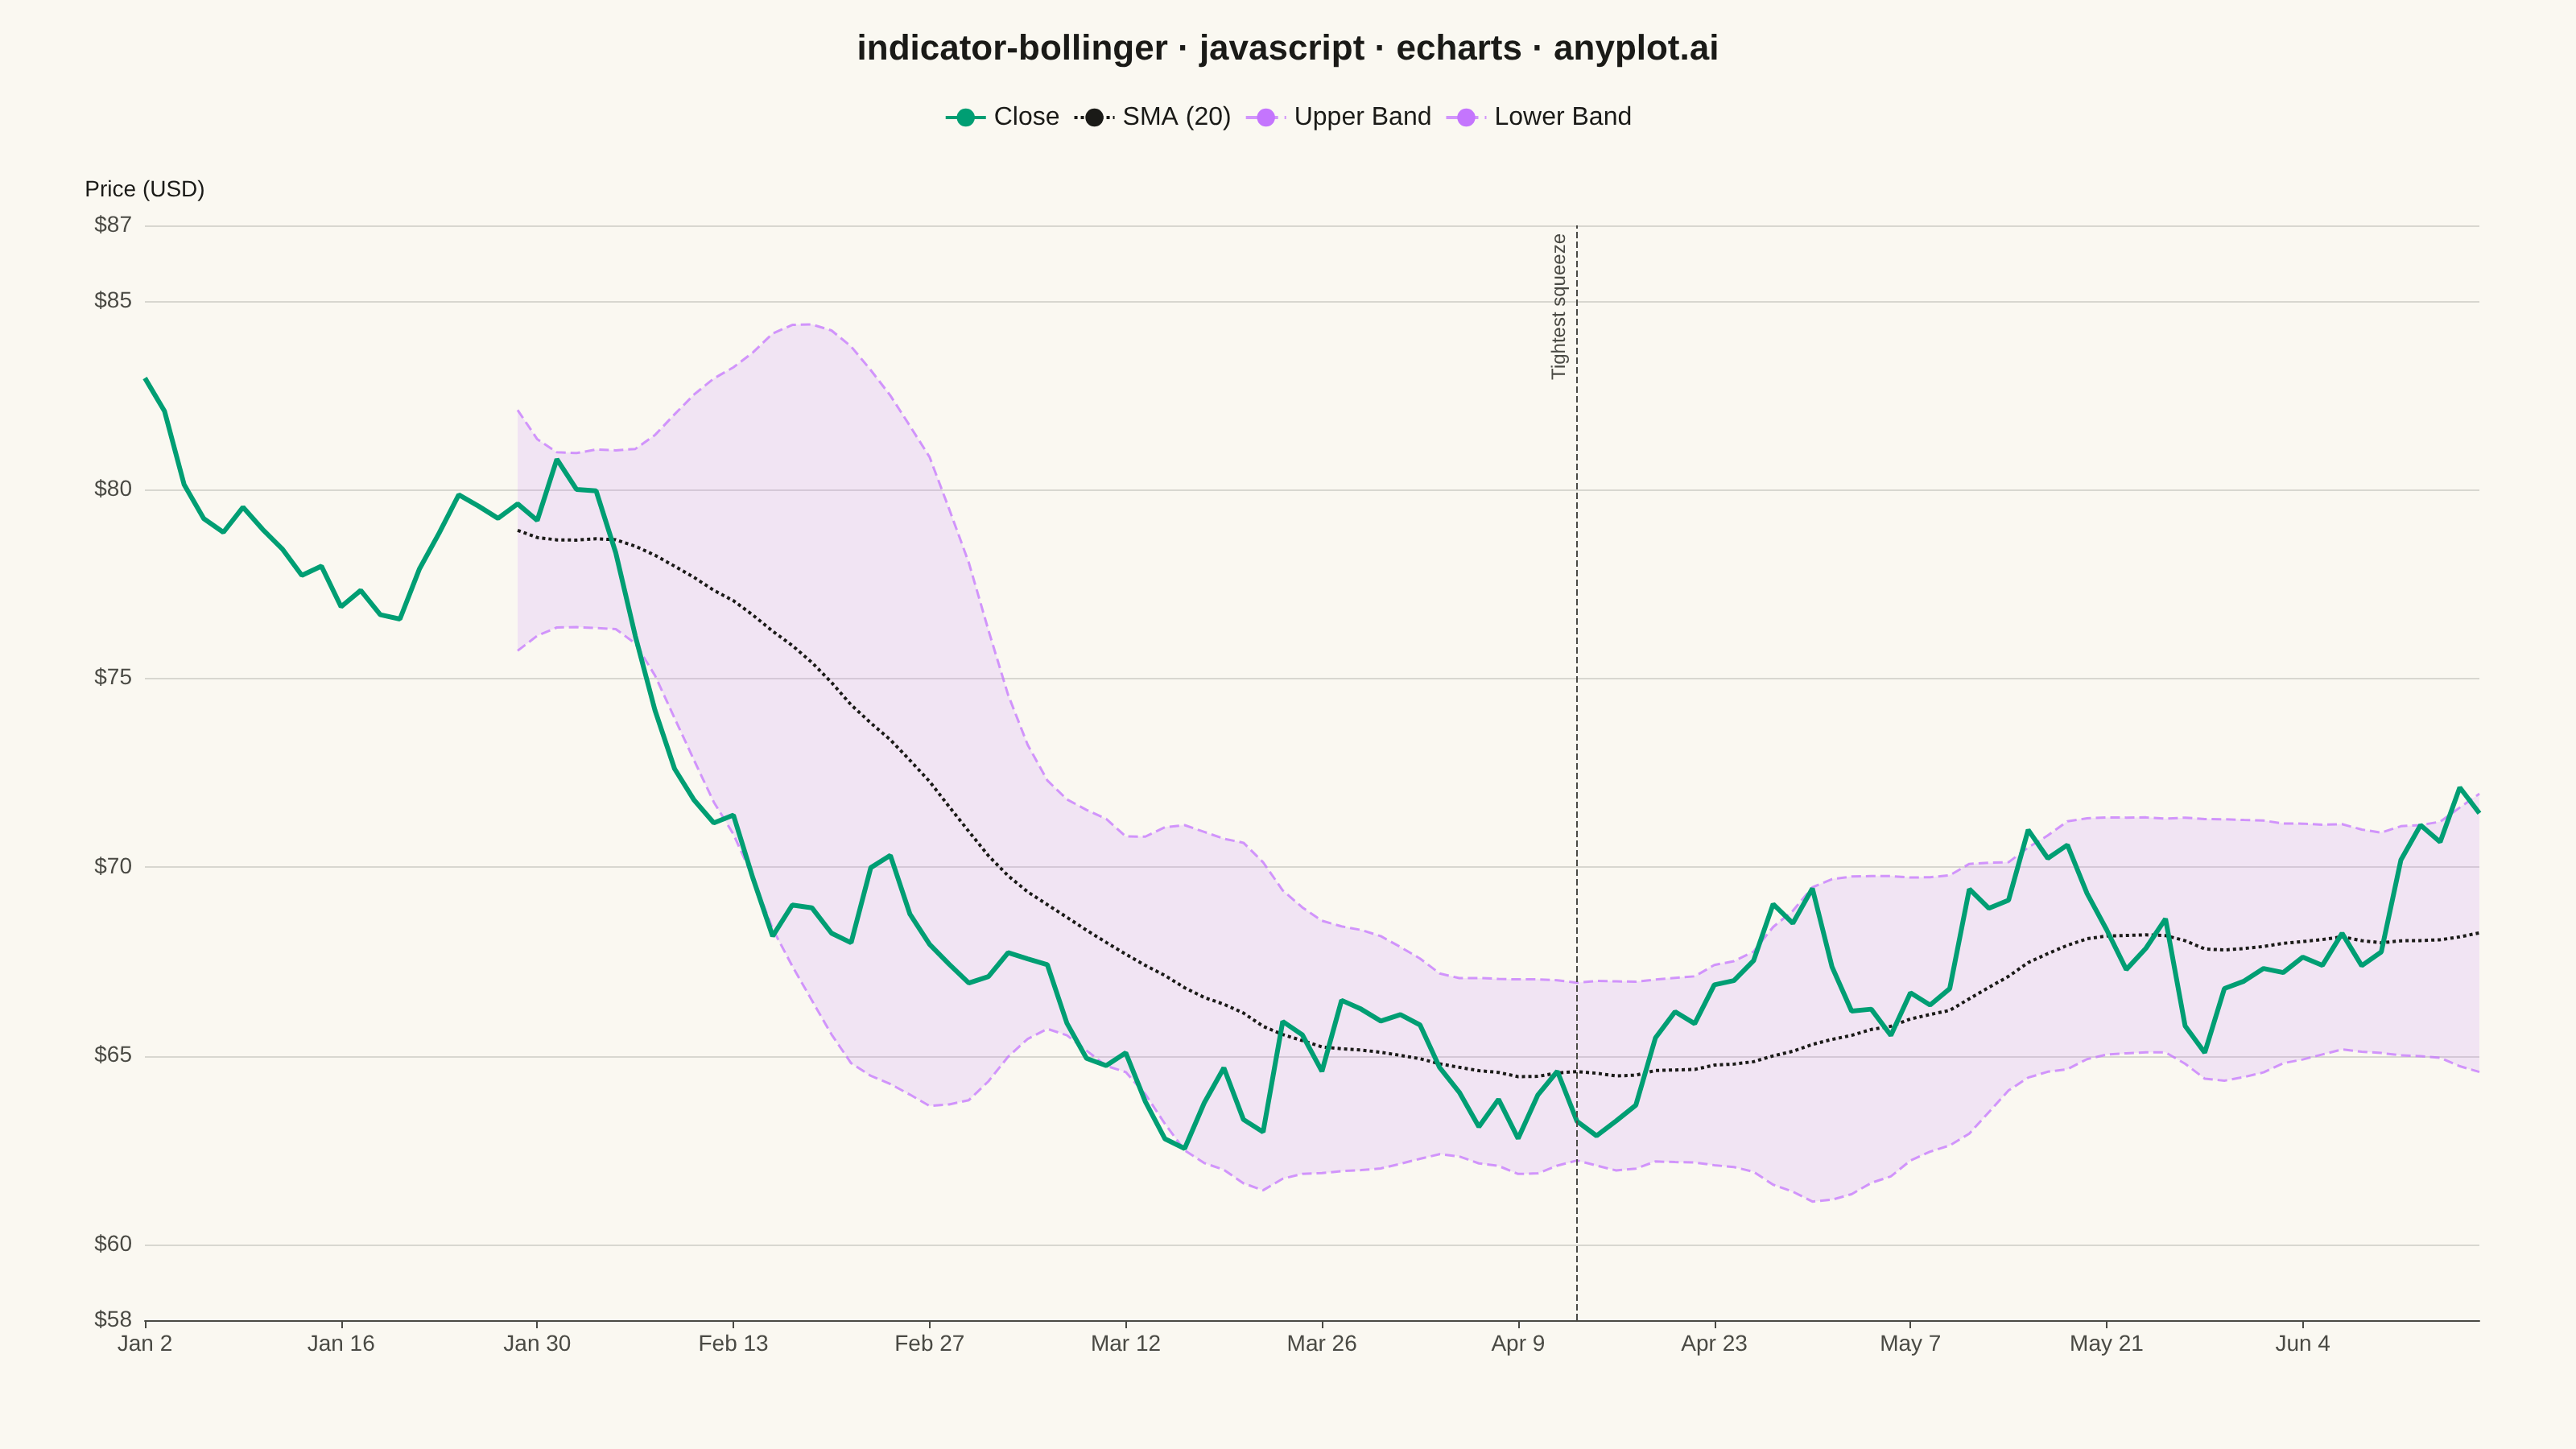
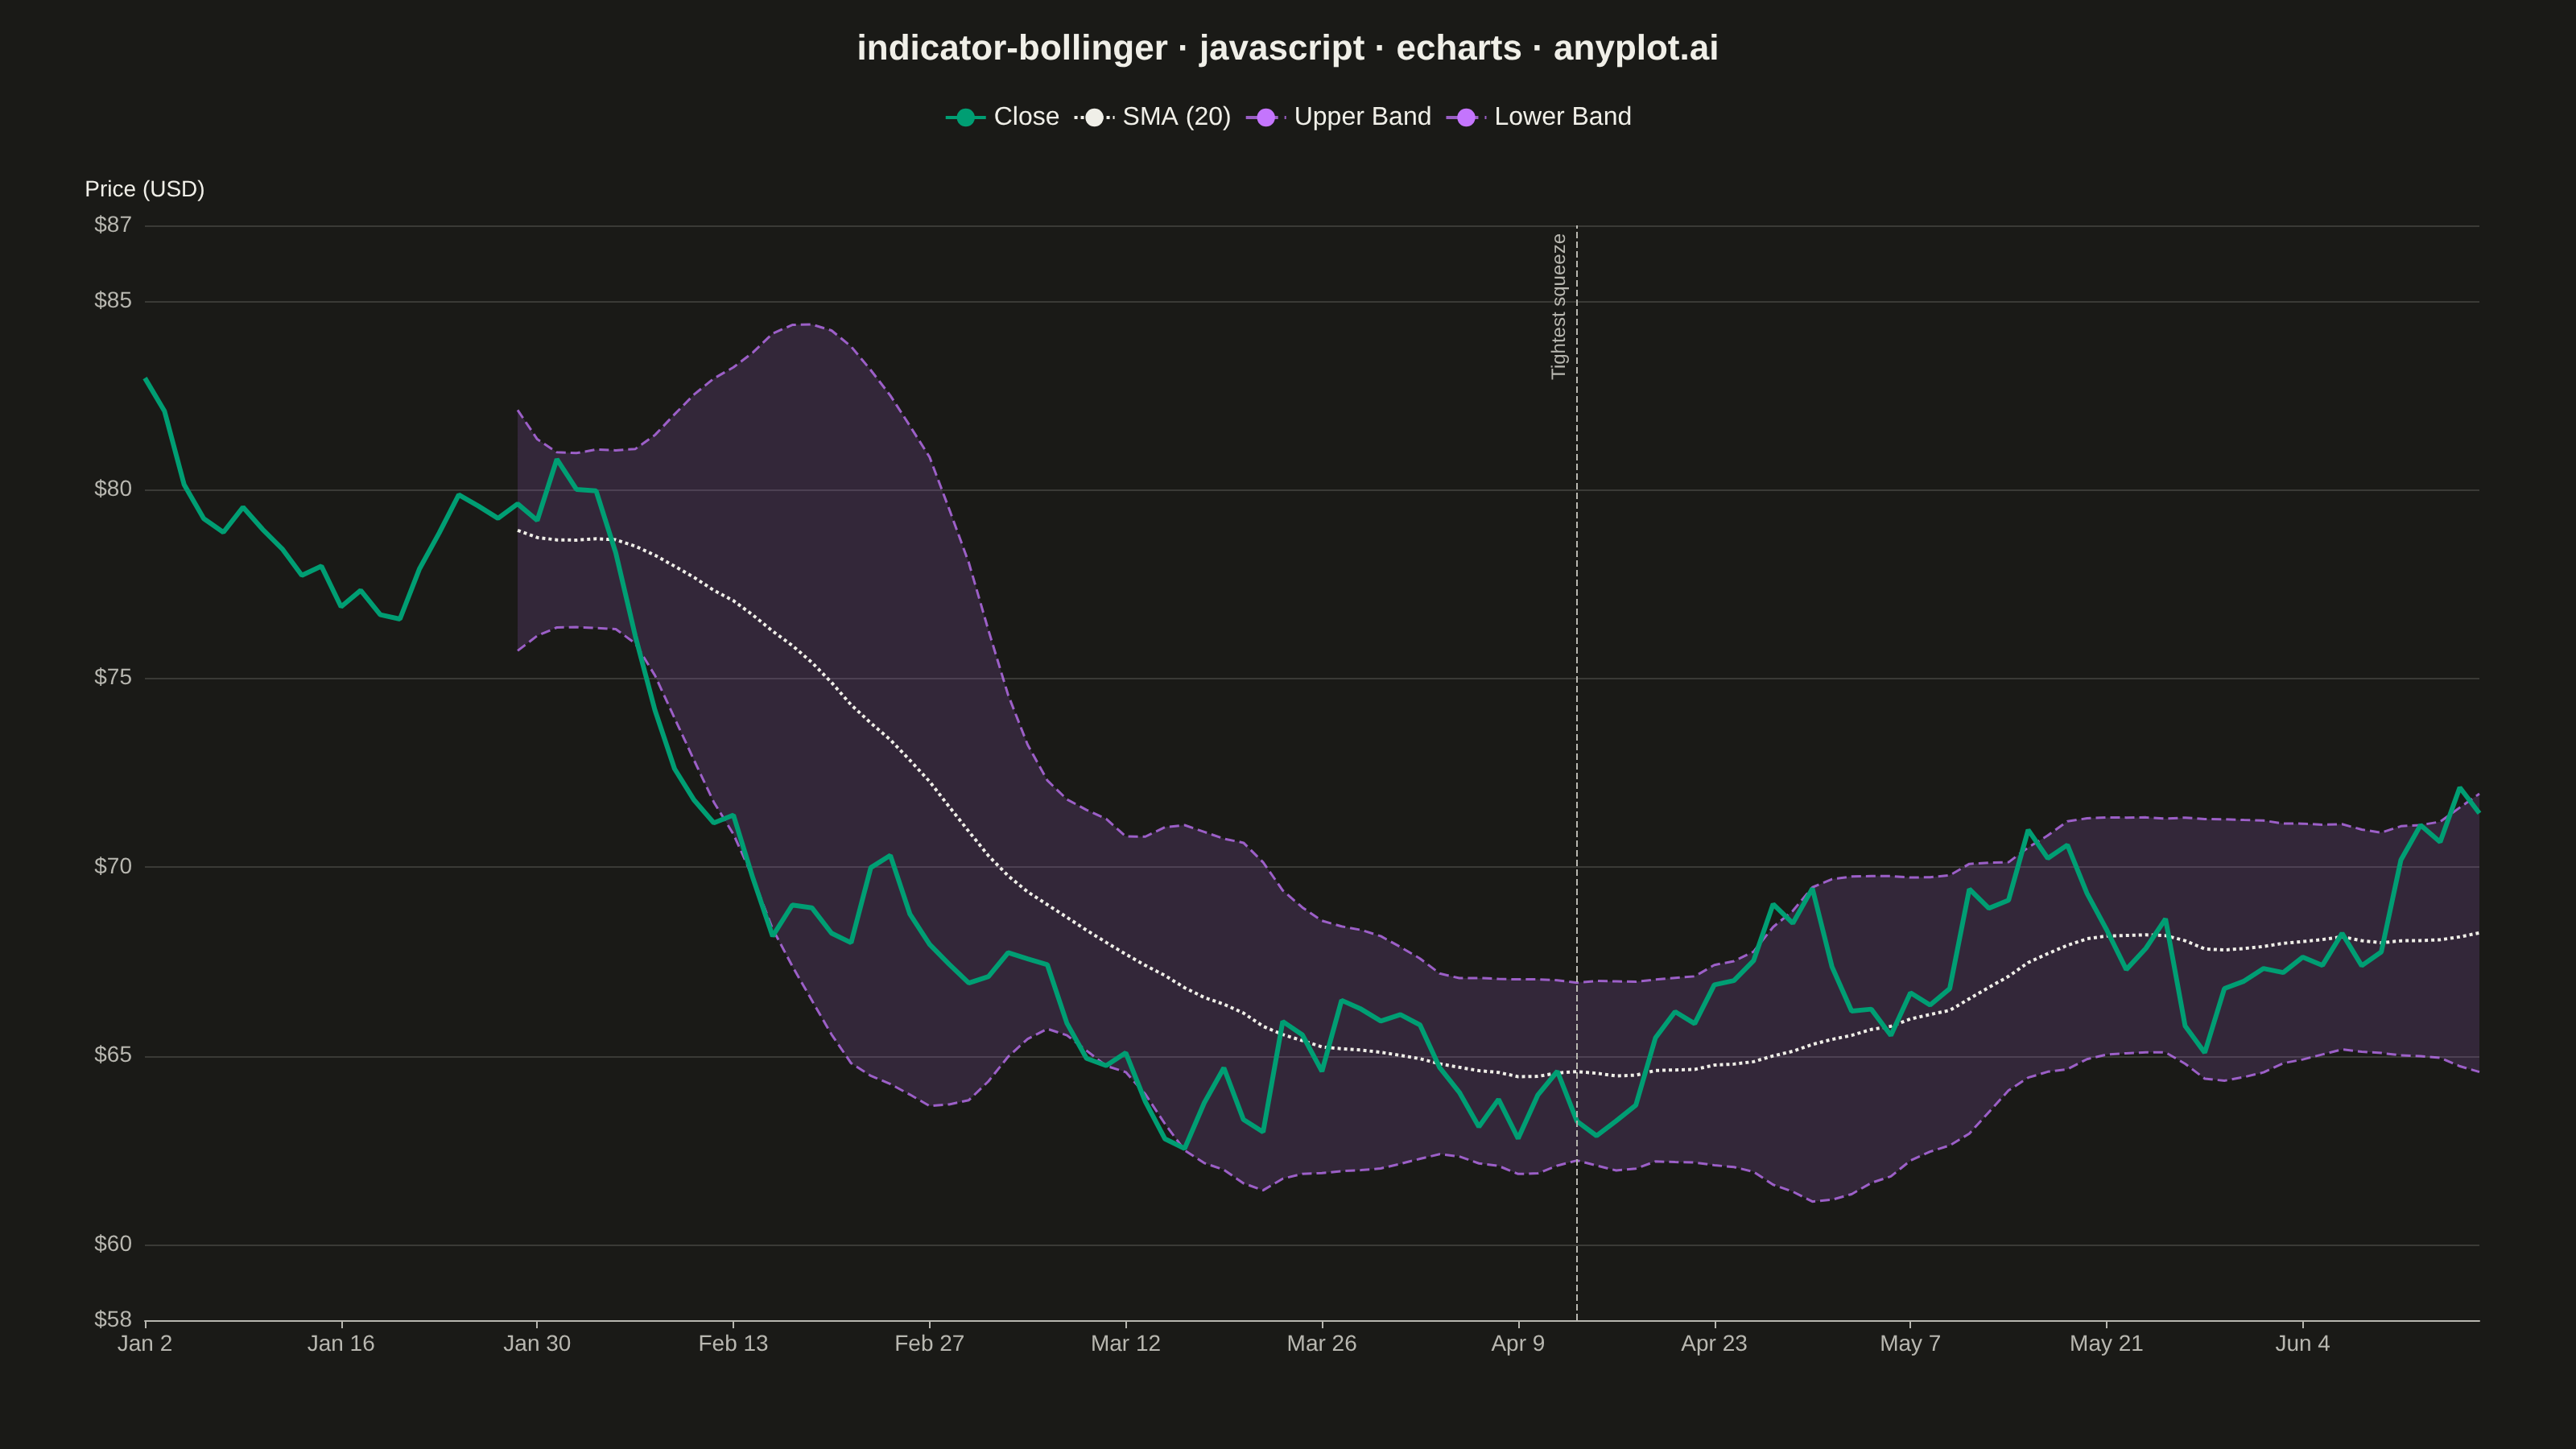
A Bollinger Bands chart displays price data with a volatility envelope consisting of three lines: a middle band (simple moving average), an upper band (SMA plus 2 standard deviations), and a lower band (SMA minus 2 standard deviations). This technical indicator helps traders identify overbought/oversold conditions, volatility patterns, and potential price breakouts by showing how prices relate to their recent statistical range.
// anyplot.ai
// indicator-bollinger: Bollinger Bands Indicator Chart
// Library: echarts 6.1.0 | JavaScript 22.23.2
// Quality: 92/100 | Created: 2026-09-02

//# anyplot-orientation: landscape
const t = window.ANYPLOT_TOKENS;

// --- Data (in-memory, deterministic) ----------------------------------------
// Aurora Biotech (ABTX) daily close over 120 trading days, with a 20-period
// SMA and +-2 standard-deviation Bollinger Bands.
function lcg(seed) {
  let state = seed >>> 0;
  return function next() {
    state = (1103515245 * state + 12345) >>> 0;
    return state / 4294967296;
  };
}
const rand = lcg(20240102);
function gaussian() {
  const u1 = Math.max(rand(), 1e-9);
  const u2 = rand();
  return Math.sqrt(-2 * Math.log(u1)) * Math.cos(2 * Math.PI * u2);
}

const NUM_DAYS = 120;
const PERIOD = 20;
const NUM_STD_DEV = 2;
const MONTH_NAMES = [
  "Jan",
  "Feb",
  "Mar",
  "Apr",
  "May",
  "Jun",
  "Jul",
  "Aug",
  "Sep",
  "Oct",
  "Nov",
  "Dec",
];

const dates = [];
const closes = [];
let cursor = new Date(Date.UTC(2024, 0, 2));
let price = 84;
while (dates.length < NUM_DAYS) {
  const day = cursor.getUTCDay();
  if (day !== 0 && day !== 6) {
    dates.push(`${MONTH_NAMES[cursor.getUTCMonth()]} ${cursor.getUTCDate()}`);
    price += gaussian() * 1.1 + 0.05;
    closes.push(Math.max(price, 5));
  }
  cursor.setUTCDate(cursor.getUTCDate() + 1);
}

const sma = new Array(NUM_DAYS).fill(null);
const upperBand = new Array(NUM_DAYS).fill(null);
const lowerBand = new Array(NUM_DAYS).fill(null);
const bandSpread = new Array(NUM_DAYS).fill(null);
for (let i = PERIOD - 1; i < NUM_DAYS; i += 1) {
  const window = closes.slice(i - PERIOD + 1, i + 1);
  const mean = window.reduce((sum, v) => sum + v, 0) / PERIOD;
  const variance = window.reduce((sum, v) => sum + (v - mean) ** 2, 0) / PERIOD;
  const stdDev = Math.sqrt(variance);
  sma[i] = mean;
  upperBand[i] = mean + NUM_STD_DEV * stdDev;
  lowerBand[i] = mean - NUM_STD_DEV * stdDev;
  bandSpread[i] = upperBand[i] - lowerBand[i];
}

const bandColor = t.palette[1];

// Y-axis auto-scale: pad a few dollars beyond the close/band extremes so the
// squeeze/expansion pattern fills the canvas instead of sitting in a $0-$100 strip.
const spanValues = [];
for (let i = 0; i < NUM_DAYS; i += 1) {
  spanValues.push(closes[i]);
  if (upperBand[i] !== null) spanValues.push(upperBand[i]);
  if (lowerBand[i] !== null) spanValues.push(lowerBand[i]);
}
const dataMin = Math.min(...spanValues);
const dataMax = Math.max(...spanValues);
const yPad = (dataMax - dataMin) * 0.1;
const yMin = Math.floor(dataMin - yPad);
const yMax = Math.ceil(dataMax + yPad);

// Locate the tightest squeeze (minimum band spread) to annotate the key
// Bollinger pattern instead of leaving the story purely implicit in color.
// Search starts one full period after warm-up so the low-variance edge right
// at the SMA's first valid bar isn't mistaken for a genuine volatility squeeze.
let squeezeIndex = -1;
let minSpread = Infinity;
for (let i = PERIOD * 2; i < NUM_DAYS; i += 1) {
  if (bandSpread[i] !== null && bandSpread[i] < minSpread) {
    minSpread = bandSpread[i];
    squeezeIndex = i;
  }
}

// --- Init --------------------------------------------------------------------
const chart = echarts.init(document.getElementById("container"));

// --- Option -------------------------------------------------------------------
chart.setOption({
  animation: false,
  color: t.palette,
  backgroundColor: "transparent",
  title: {
    text: "indicator-bollinger · javascript · echarts · anyplot.ai",
    left: "center",
    textStyle: { color: t.ink, fontSize: 22 },
  },
  legend: {
    data: ["Close", "SMA (20)", "Upper Band", "Lower Band"],
    top: 60,
    textStyle: { color: t.ink, fontSize: 16 },
  },
  grid: { left: 90, right: 60, top: 140, bottom: 80 },
  tooltip: {
    trigger: "axis",
    formatter: (params) =>
      params
        .filter((p) => !p.seriesName.includes("band fill"))
        .map(
          (p) =>
            `${p.marker} ${p.seriesName}: $${p.value == null ? "-" : p.value.toFixed(2)}`,
        )
        .join("<br/>"),
  },
  xAxis: {
    type: "category",
    data: dates,
    boundaryGap: false,
    axisLabel: { color: t.inkSoft, fontSize: 14, interval: 9 },
    axisLine: { lineStyle: { color: t.inkSoft } },
    splitLine: { show: false },
  },
  yAxis: {
    type: "value",
    name: "Price (USD)",
    nameTextStyle: { color: t.ink, fontSize: 14 },
    min: yMin,
    max: yMax,
    axisLabel: { color: t.inkSoft, fontSize: 14, formatter: "${value}" },
    axisLine: { lineStyle: { color: t.inkSoft } },
    splitLine: { lineStyle: { color: t.grid } },
  },
  series: [
    {
      name: "Lower Band (band fill)",
      type: "line",
      data: lowerBand,
      stack: "band",
      symbol: "none",
      lineStyle: { opacity: 0 },
      areaStyle: { opacity: 0 },
      z: 1,
    },
    {
      name: "Band Spread (band fill)",
      type: "line",
      data: bandSpread,
      stack: "band",
      symbol: "none",
      lineStyle: { opacity: 0 },
      areaStyle: { color: bandColor, opacity: 0.15 },
      z: 1,
    },
    {
      name: "Upper Band",
      type: "line",
      data: upperBand,
      symbol: "none",
      itemStyle: { color: bandColor },
      lineStyle: {
        color: bandColor,
        width: 1.5,
        type: "dashed",
        opacity: 0.75,
      },
      z: 2,
    },
    {
      name: "Lower Band",
      type: "line",
      data: lowerBand,
      symbol: "none",
      itemStyle: { color: bandColor },
      lineStyle: {
        color: bandColor,
        width: 1.5,
        type: "dashed",
        opacity: 0.75,
      },
      z: 2,
      markLine: {
        silent: true,
        symbol: "none",
        lineStyle: { color: t.inkSoft, type: "dashed", width: 1 },
        label: {
          formatter: "Tightest squeeze",
          color: t.inkSoft,
          fontSize: 12,
          position: "insideEndTop",
        },
        data: [{ xAxis: dates[squeezeIndex] }],
      },
    },
    {
      name: "SMA (20)",
      type: "line",
      data: sma,
      symbol: "none",
      itemStyle: { color: t.ink },
      lineStyle: { color: t.ink, width: 2, type: "dotted" },
      z: 3,
    },
    {
      name: "Close",
      type: "line",
      data: closes,
      symbol: "none",
      itemStyle: { color: t.palette[0] },
      lineStyle: { color: t.palette[0], width: 3 },
      z: 4,
    },
  ],
});
Runnable source as JSON, for any HTTP client: https://api.anyplot.ai/specs/indicator-bollinger/echarts/code. Any spec id and library id listed in llms-full.txt fit the same URL shape; every URL below is complete and callable.
{
  "spec_id": "indicator-bollinger",
  "language": "javascript",
  "library": "echarts",
  "page": "https://anyplot.ai/indicator-bollinger/javascript/echarts",
  "hub": "https://anyplot.ai/indicator-bollinger",
  "code_json": "https://api.anyplot.ai/specs/indicator-bollinger/echarts/code",
  "spec_json": "https://api.anyplot.ai/specs/indicator-bollinger",
  "render_light_png": "https://storage.googleapis.com/anyplot-images/plots/indicator-bollinger/javascript/echarts/plot-light.png",
  "render_dark_png": "https://storage.googleapis.com/anyplot-images/plots/indicator-bollinger/javascript/echarts/plot-dark.png",
  "interactive_light_html": "https://storage.googleapis.com/anyplot-images/plots/indicator-bollinger/javascript/echarts/plot-light.html",
  "interactive_dark_html": "https://storage.googleapis.com/anyplot-images/plots/indicator-bollinger/javascript/echarts/plot-dark.html",
  "quality_score": 92.0,
  "license": "MIT",
  "guide": "https://anyplot.ai/llms.txt"
}
Part of Bollinger Bands Indicator Chart on anyplot.ai.