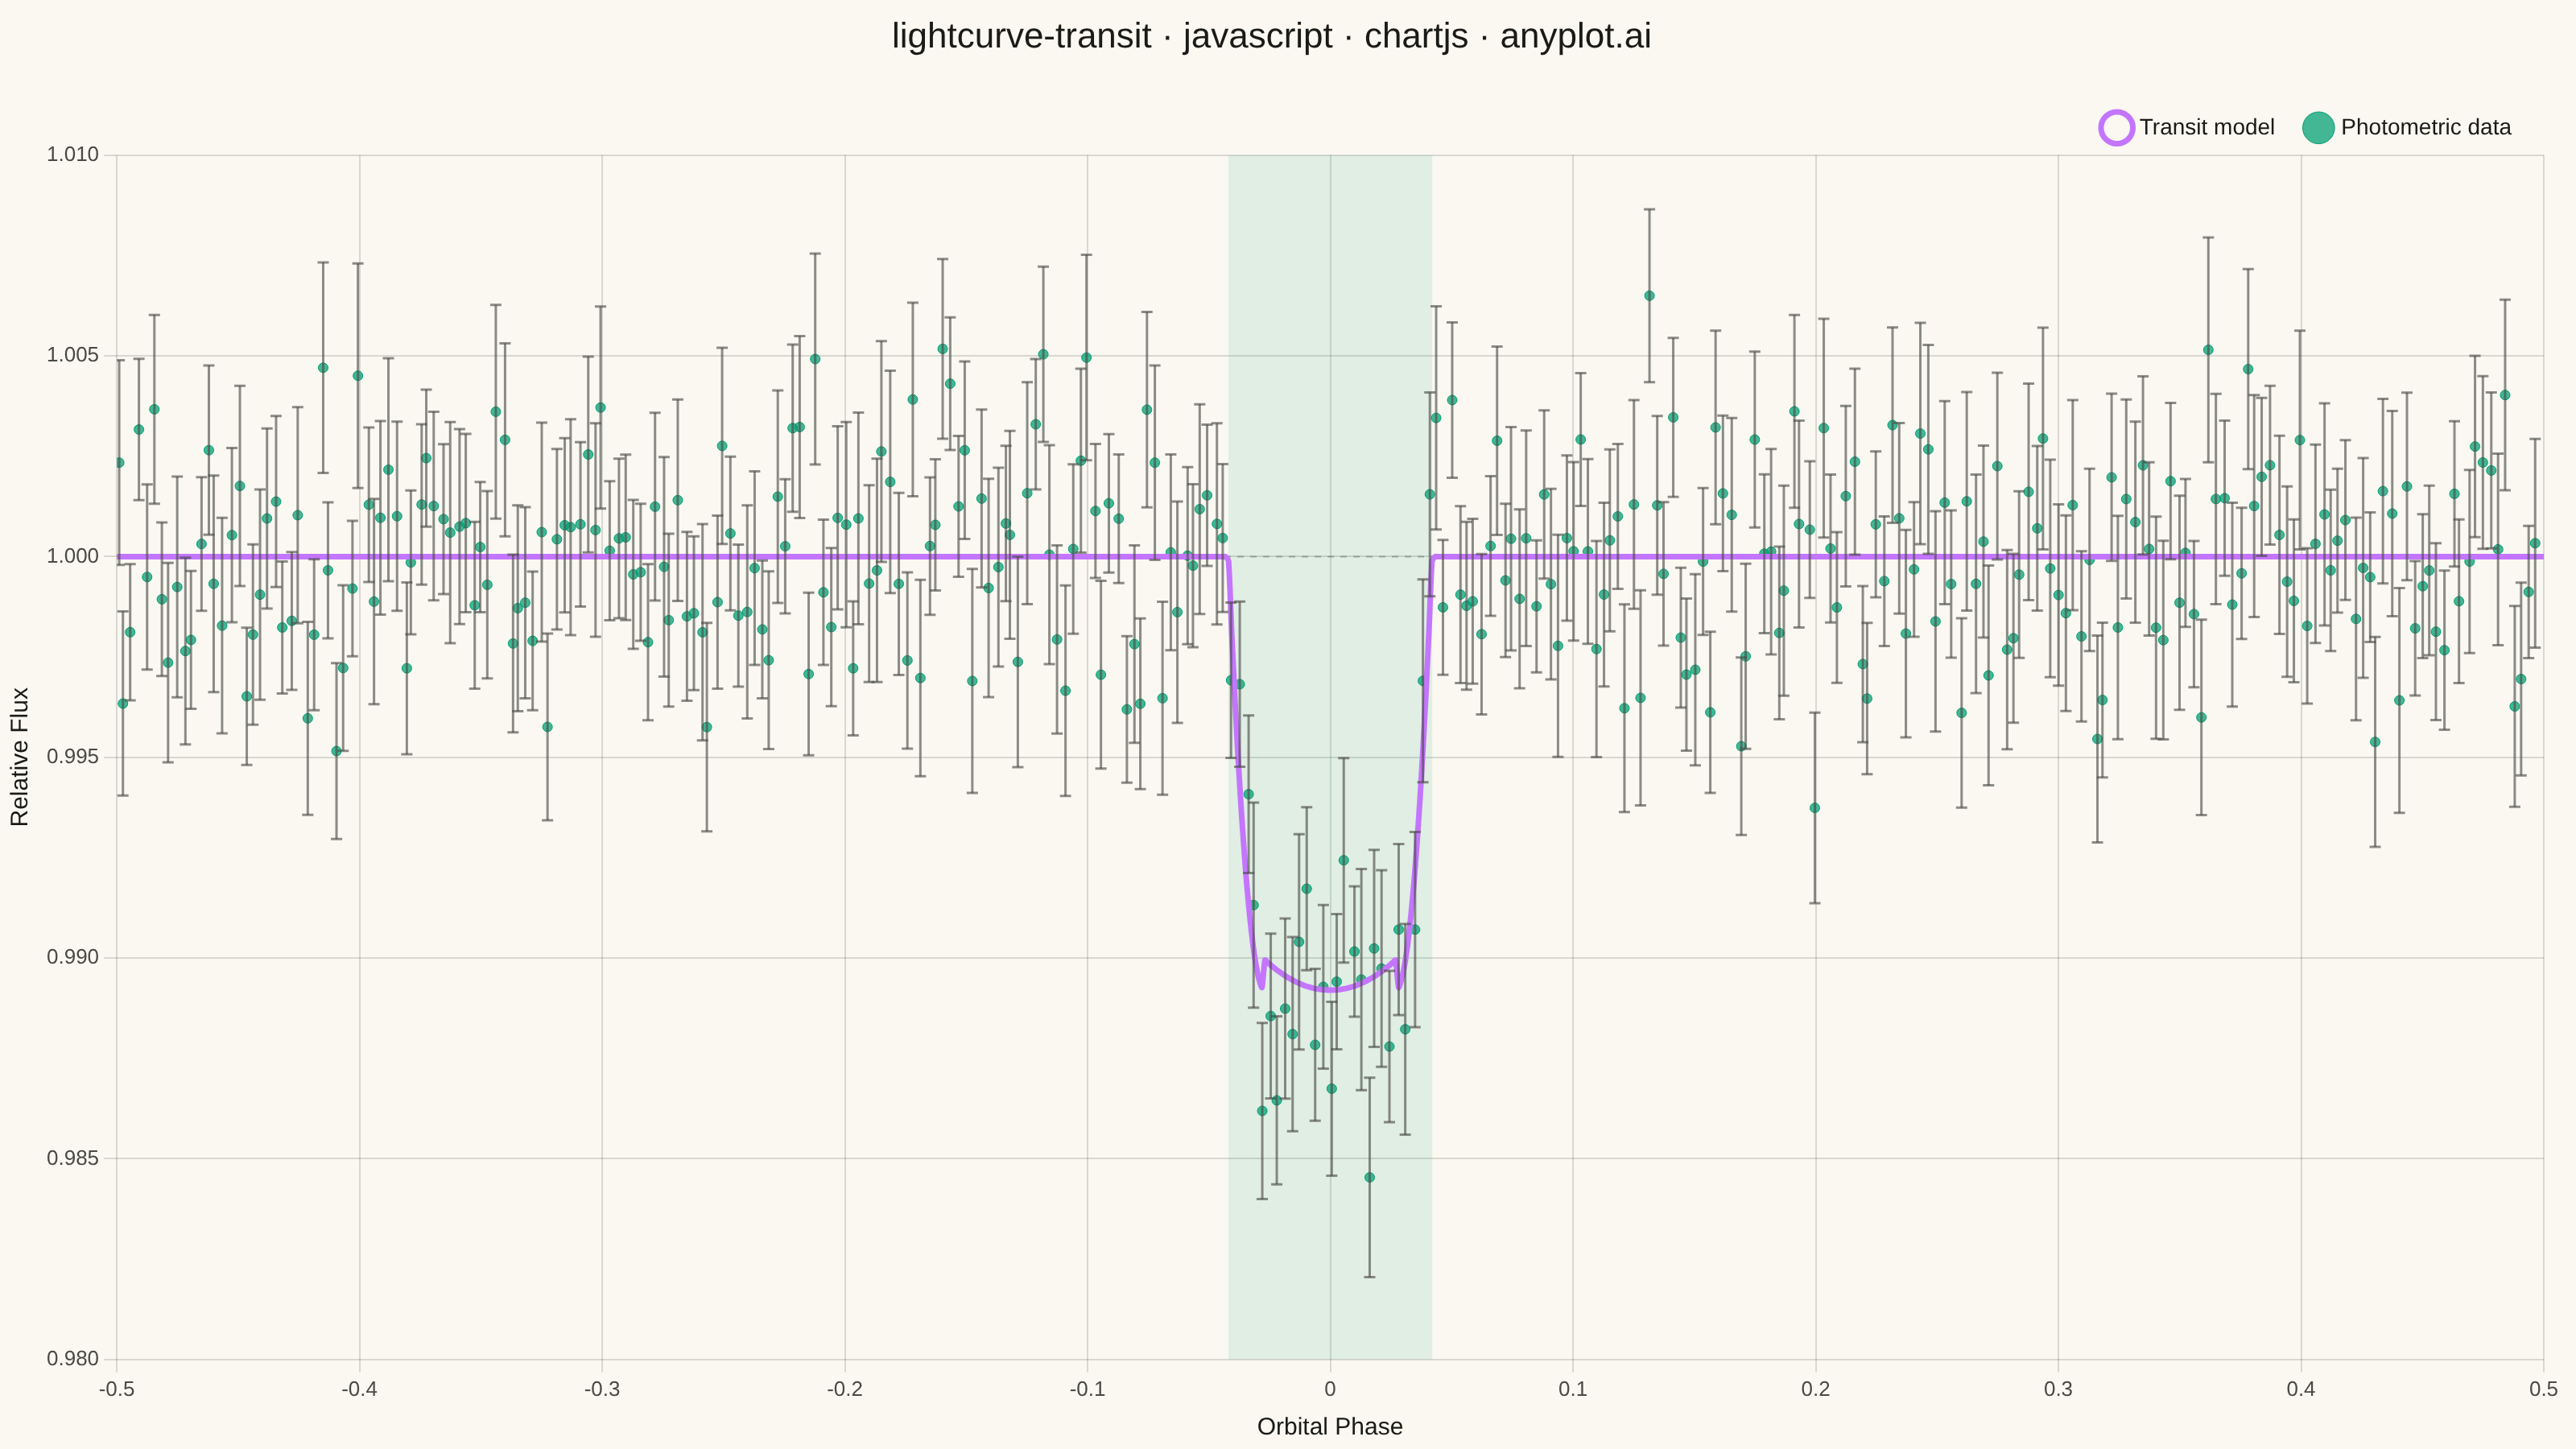
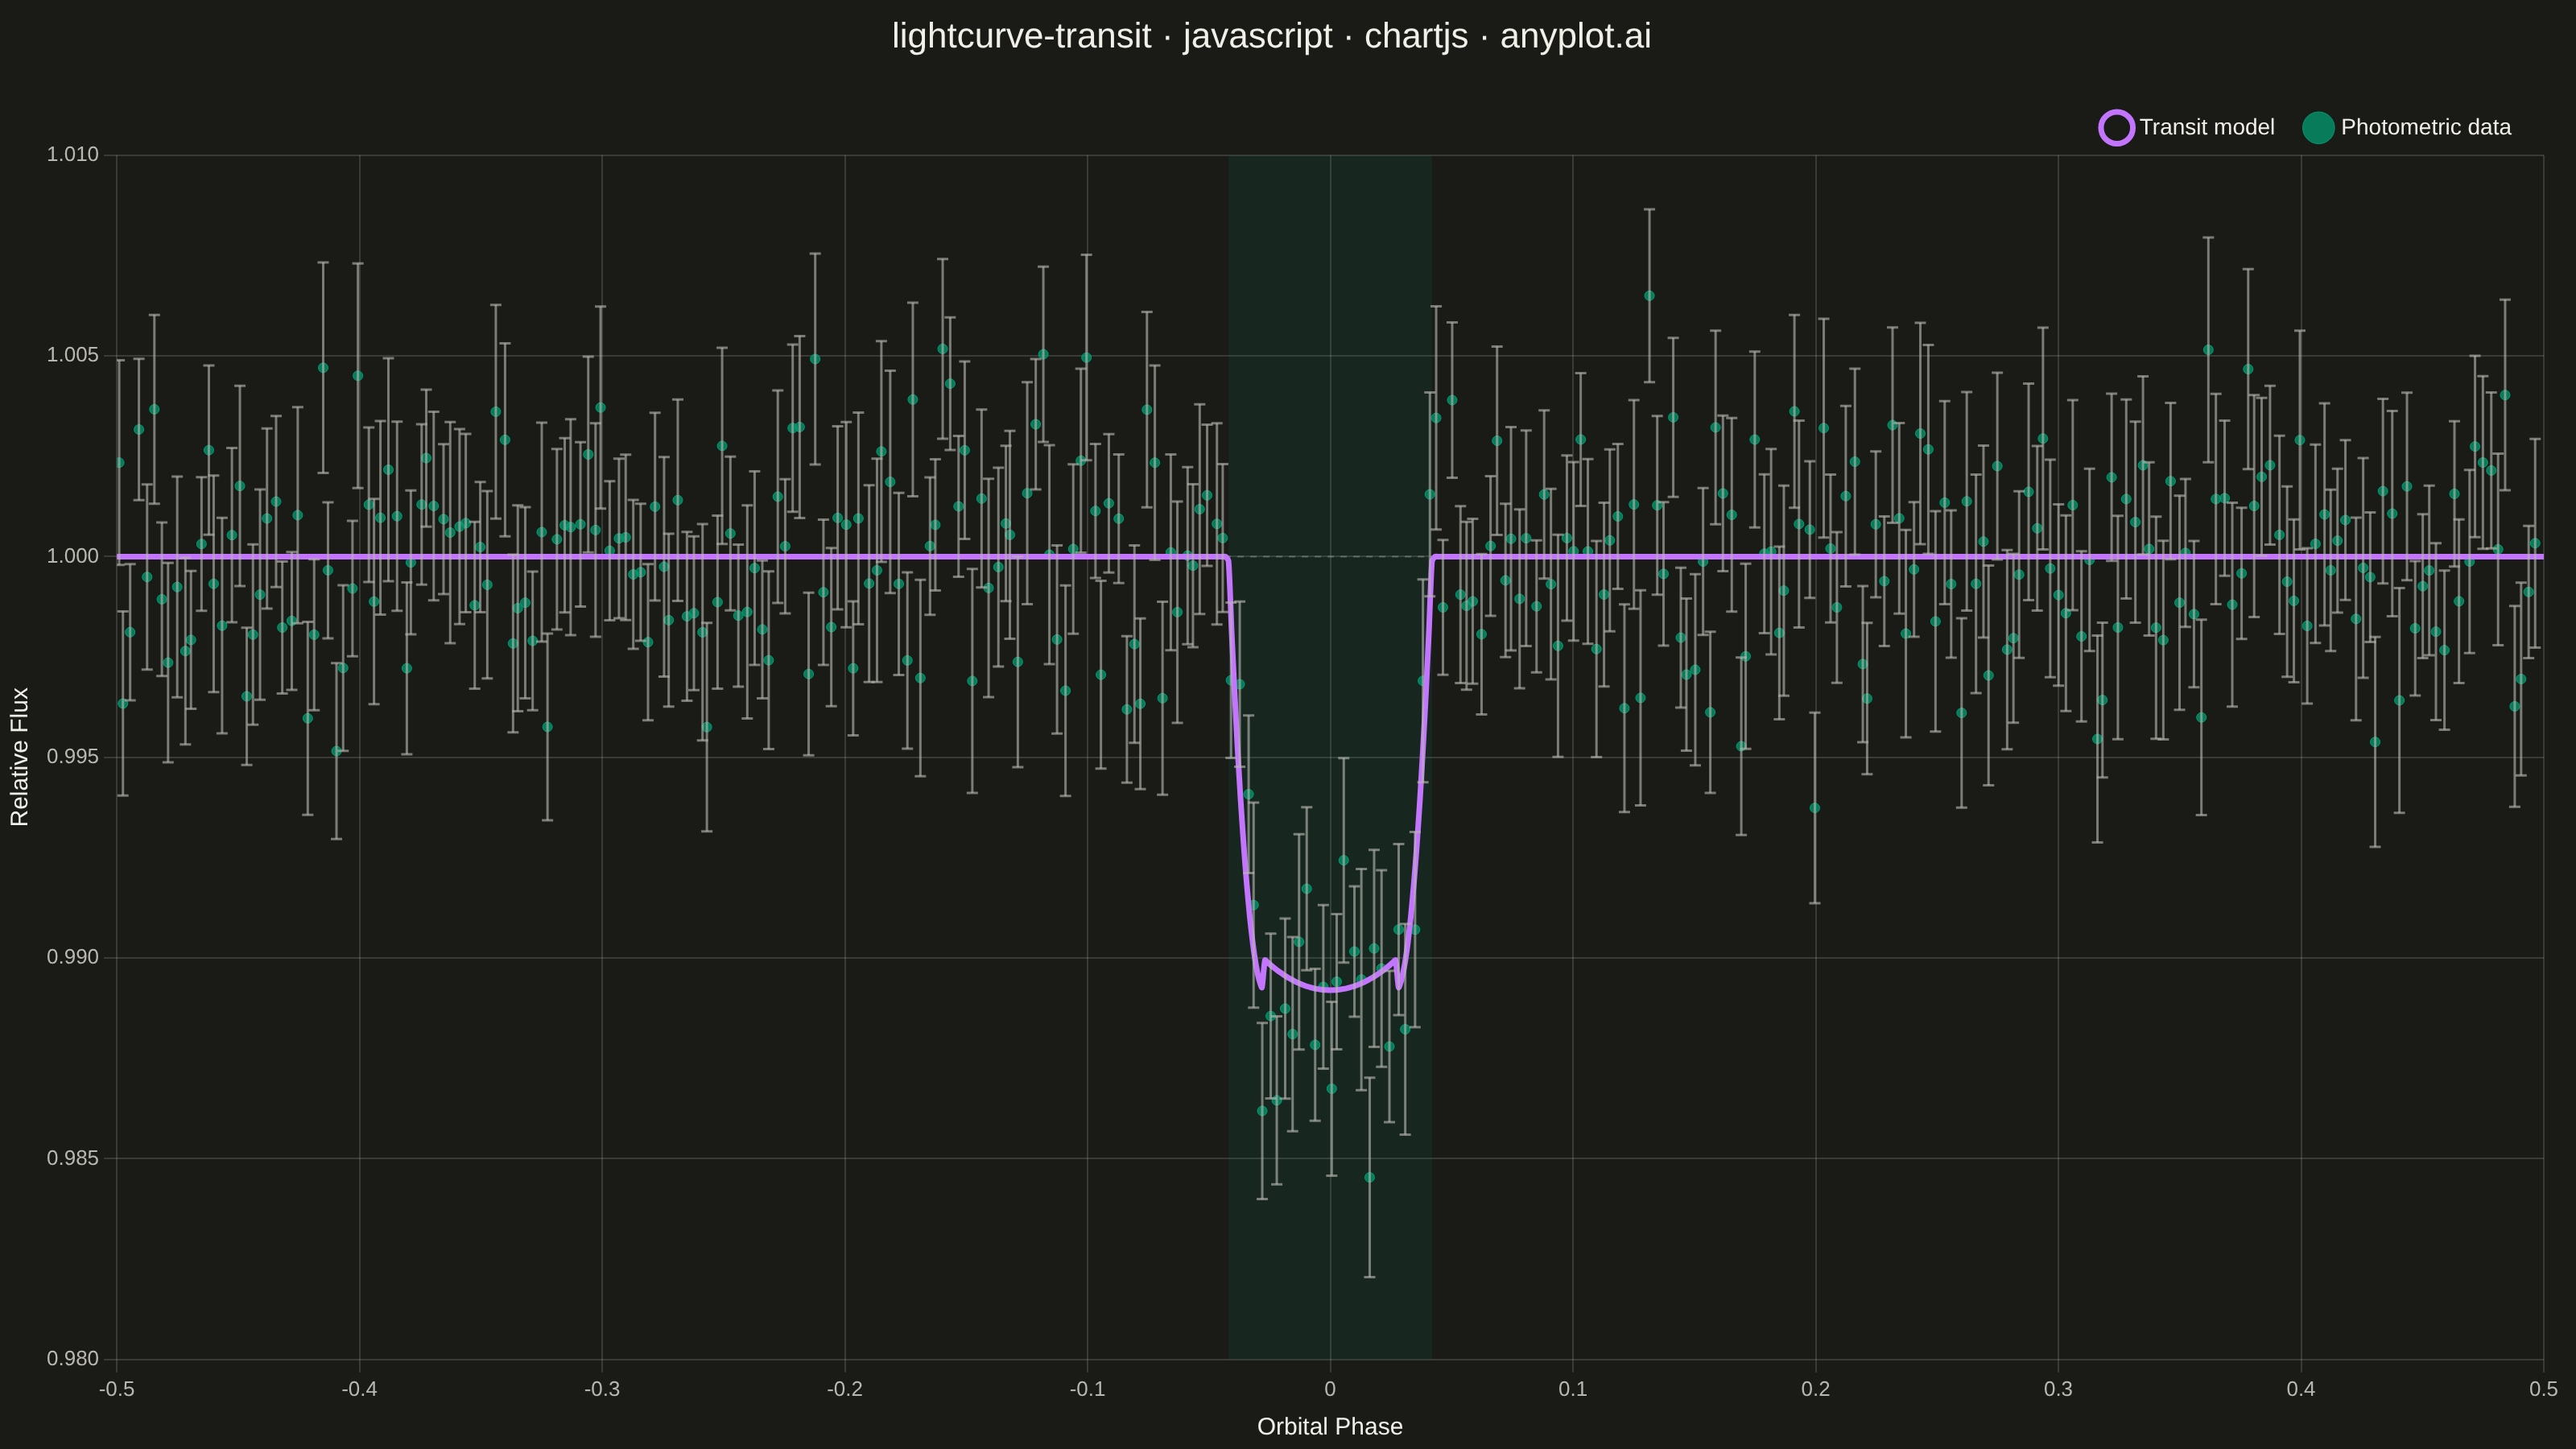
A time-series plot showing the brightness of an astronomical object over time, designed to reveal exoplanet transit events as characteristic dips in flux. The plot displays photometric measurements with error bars against time or orbital phase, with an optional fitted transit model overlay. This visualization is fundamental in observational astronomy for detecting and characterizing planetary transits, variable stars, and other periodic brightness variations.
// anyplot.ai
// lightcurve-transit: Astronomical Light Curve
// Library: chartjs 4.4.7 | JavaScript 22.22.3
// Quality: 91/100 | Created: 2026-06-20

const t = window.ANYPLOT_TOKENS;

// Deterministic 31-bit LCG (seed=1337) — avoids Math.random()
let _seed = 1337;
const rand = () => {
  _seed = (_seed * 214013 + 2531011) & 0x7fffffff;
  return _seed / 0x80000000;
};

// Box-Muller transform for Gaussian noise (uses deterministic rand())
const randn = () => {
  const u1 = Math.max(rand(), 1e-10);
  const u2 = rand();
  return Math.sqrt(-2 * Math.log(u1)) * Math.cos(2 * Math.PI * u2);
};

// Simplified quadratic limb-darkened transit profile
const T_DEPTH = 0.0108;  // 1.08% dip
const T_HALF  = 0.042;   // half-duration in phase units
const T_ING   = 0.015;   // ingress half-width

const transitFlux = ph => {
  const a = Math.abs(ph);
  if (a >= T_HALF) return 1.0;
  if (a <= T_HALF - T_ING) {
    return 1.0 - T_DEPTH * (1.0 - 0.07 * ((a / (T_HALF - T_ING)) ** 2));
  }
  const u = (a - (T_HALF - T_ING)) / T_ING;
  return 1.0 - T_DEPTH * (1.0 - u * u);
};

// 320 phase-folded TESS-like photometric measurements with Gaussian noise
const N_OBS = 320;
const obsData = Array.from({ length: N_OBS }, (_, i) => {
  const ph  = Math.max(-0.499, Math.min(0.499, -0.5 + i / N_OBS + (rand() - 0.5) * 0.5 / N_OBS));
  const err = 0.0016 + rand() * 0.0012;
  return { x: ph, y: transitFlux(ph) + randn() * err, err };
}).sort((a, b) => a.x - b.x);

// 800-point smooth model curve (no noise)
const modelData = Array.from({ length: 800 }, (_, i) => ({
  x: -0.5 + i / 799,
  y: transitFlux(-0.5 + i / 799),
}));

// Plugin: canvas background + transit region shading + per-point error bars
Chart.register({
  id: 'lightcurveExtras',
  beforeDraw({ ctx, width, height }) {
    ctx.save();
    ctx.fillStyle = t.pageBg;
    ctx.fillRect(0, 0, width, height);
    ctx.restore();
  },
  beforeDatasetsDraw(chart) {
    const { ctx, chartArea, scales: { x: xSc, y: ySc } } = chart;
    ctx.save();
    ctx.beginPath();
    ctx.rect(chartArea.left, chartArea.top, chartArea.width, chartArea.height);
    ctx.clip();

    // Semi-transparent transit window shading (phase ±T_HALF)
    const x1 = xSc.getPixelForValue(-T_HALF);
    const x2 = xSc.getPixelForValue(T_HALF);
    ctx.fillStyle = t.palette[0] + '1a';
    ctx.fillRect(x1, chartArea.top, x2 - x1, chartArea.height);

    // Dashed baseline at out-of-transit flux = 1.0
    const y0 = ySc.getPixelForValue(1.0);
    ctx.strokeStyle = t.inkSoft + '60';
    ctx.lineWidth = 1;
    ctx.setLineDash([4, 4]);
    ctx.beginPath();
    ctx.moveTo(chartArea.left, y0);
    ctx.lineTo(chartArea.right, y0);
    ctx.stroke();

    ctx.restore();
  },
  afterDatasetsDraw(chart) {
    const { ctx, chartArea, scales: { y: ySc } } = chart;
    const meta = chart.getDatasetMeta(0);
    if (meta.hidden) return;

    ctx.save();
    ctx.beginPath();
    ctx.rect(chartArea.left, chartArea.top, chartArea.width, chartArea.height);
    ctx.clip();
    ctx.strokeStyle = t.inkSoft + 'a0';
    ctx.lineWidth   = 1.5;
    const CAP = 3.5;

    obsData.forEach((d, i) => {
      const pt = meta.data[i];
      if (!pt) return;
      const px  = pt.x;
      const py1 = ySc.getPixelForValue(d.y + d.err);
      const py2 = ySc.getPixelForValue(d.y - d.err);
      ctx.beginPath(); ctx.moveTo(px, py1);       ctx.lineTo(px, py2);       ctx.stroke();
      ctx.beginPath(); ctx.moveTo(px - CAP, py1); ctx.lineTo(px + CAP, py1); ctx.stroke();
      ctx.beginPath(); ctx.moveTo(px - CAP, py2); ctx.lineTo(px + CAP, py2); ctx.stroke();
    });

    ctx.restore();
  },
});

// Mount canvas into harness-provided #container
const canvas = document.createElement('canvas');
document.getElementById('container').appendChild(canvas);

const TITLE    = 'lightcurve-transit · javascript · chartjs · anyplot.ai';
const titleSize = Math.max(16, Math.round(22 * Math.min(1.0, 67 / TITLE.length)));

new Chart(canvas, {
  type: 'scatter',
  data: {
    datasets: [
      {
        label: 'Photometric data',
        data: obsData,
        type: 'scatter',
        backgroundColor: t.palette[0] + 'bb',
        borderColor:     t.palette[0],
        borderWidth: 0.5,
        pointRadius: 3,
        pointHoverRadius: 4,
        order: 2,
      },
      {
        label: 'Transit model',
        data: modelData,
        type: 'line',
        borderColor:     t.palette[1],
        backgroundColor: 'transparent',
        borderWidth: 3.5,
        pointRadius: 0,
        tension: 0.2,
        order: 1,
      },
    ],
  },
  options: {
    responsive: true,
    maintainAspectRatio: false,
    animation: false,
    layout: { padding: { right: 20, top: 10 } },
    plugins: {
      title: {
        display: true,
        text: TITLE,
        color: t.ink,
        font: { size: titleSize, weight: '500' },
        padding: { bottom: 16 },
      },
      legend: {
        position: 'top',
        align: 'end',
        labels: {
          color: t.ink,
          font: { size: 14 },
          usePointStyle: true,
          padding: 20,
        },
      },
    },
    scales: {
      x: {
        type: 'linear',
        title: {
          display: true,
          text: 'Orbital Phase',
          color: t.ink,
          font: { size: 15 },
        },
        ticks: { color: t.inkSoft, font: { size: 13 } },
        grid: { color: t.grid },
        border: { display: false },
        min: -0.5,
        max: 0.5,
      },
      y: {
        type: 'linear',
        title: {
          display: true,
          text: 'Relative Flux',
          color: t.ink,
          font: { size: 15 },
        },
        ticks: {
          color: t.inkSoft,
          font: { size: 13 },
          callback: v => v.toFixed(3),
        },
        grid: { color: t.grid },
        border: { display: false },
      },
    },
  },
});
Runnable source as JSON, for any HTTP client: https://api.anyplot.ai/specs/lightcurve-transit/chartjs/code. Any spec id and library id listed in llms-full.txt fit the same URL shape; every URL below is complete and callable.
{
  "spec_id": "lightcurve-transit",
  "language": "javascript",
  "library": "chartjs",
  "page": "https://anyplot.ai/lightcurve-transit/javascript/chartjs",
  "hub": "https://anyplot.ai/lightcurve-transit",
  "code_json": "https://api.anyplot.ai/specs/lightcurve-transit/chartjs/code",
  "spec_json": "https://api.anyplot.ai/specs/lightcurve-transit",
  "render_light_png": "https://storage.googleapis.com/anyplot-images/plots/lightcurve-transit/javascript/chartjs/plot-light.png",
  "render_dark_png": "https://storage.googleapis.com/anyplot-images/plots/lightcurve-transit/javascript/chartjs/plot-dark.png",
  "interactive_light_html": "https://storage.googleapis.com/anyplot-images/plots/lightcurve-transit/javascript/chartjs/plot-light.html",
  "interactive_dark_html": "https://storage.googleapis.com/anyplot-images/plots/lightcurve-transit/javascript/chartjs/plot-dark.html",
  "quality_score": 91.0,
  "license": "MIT",
  "guide": "https://anyplot.ai/llms.txt"
}
Part of Astronomical Light Curve on anyplot.ai.