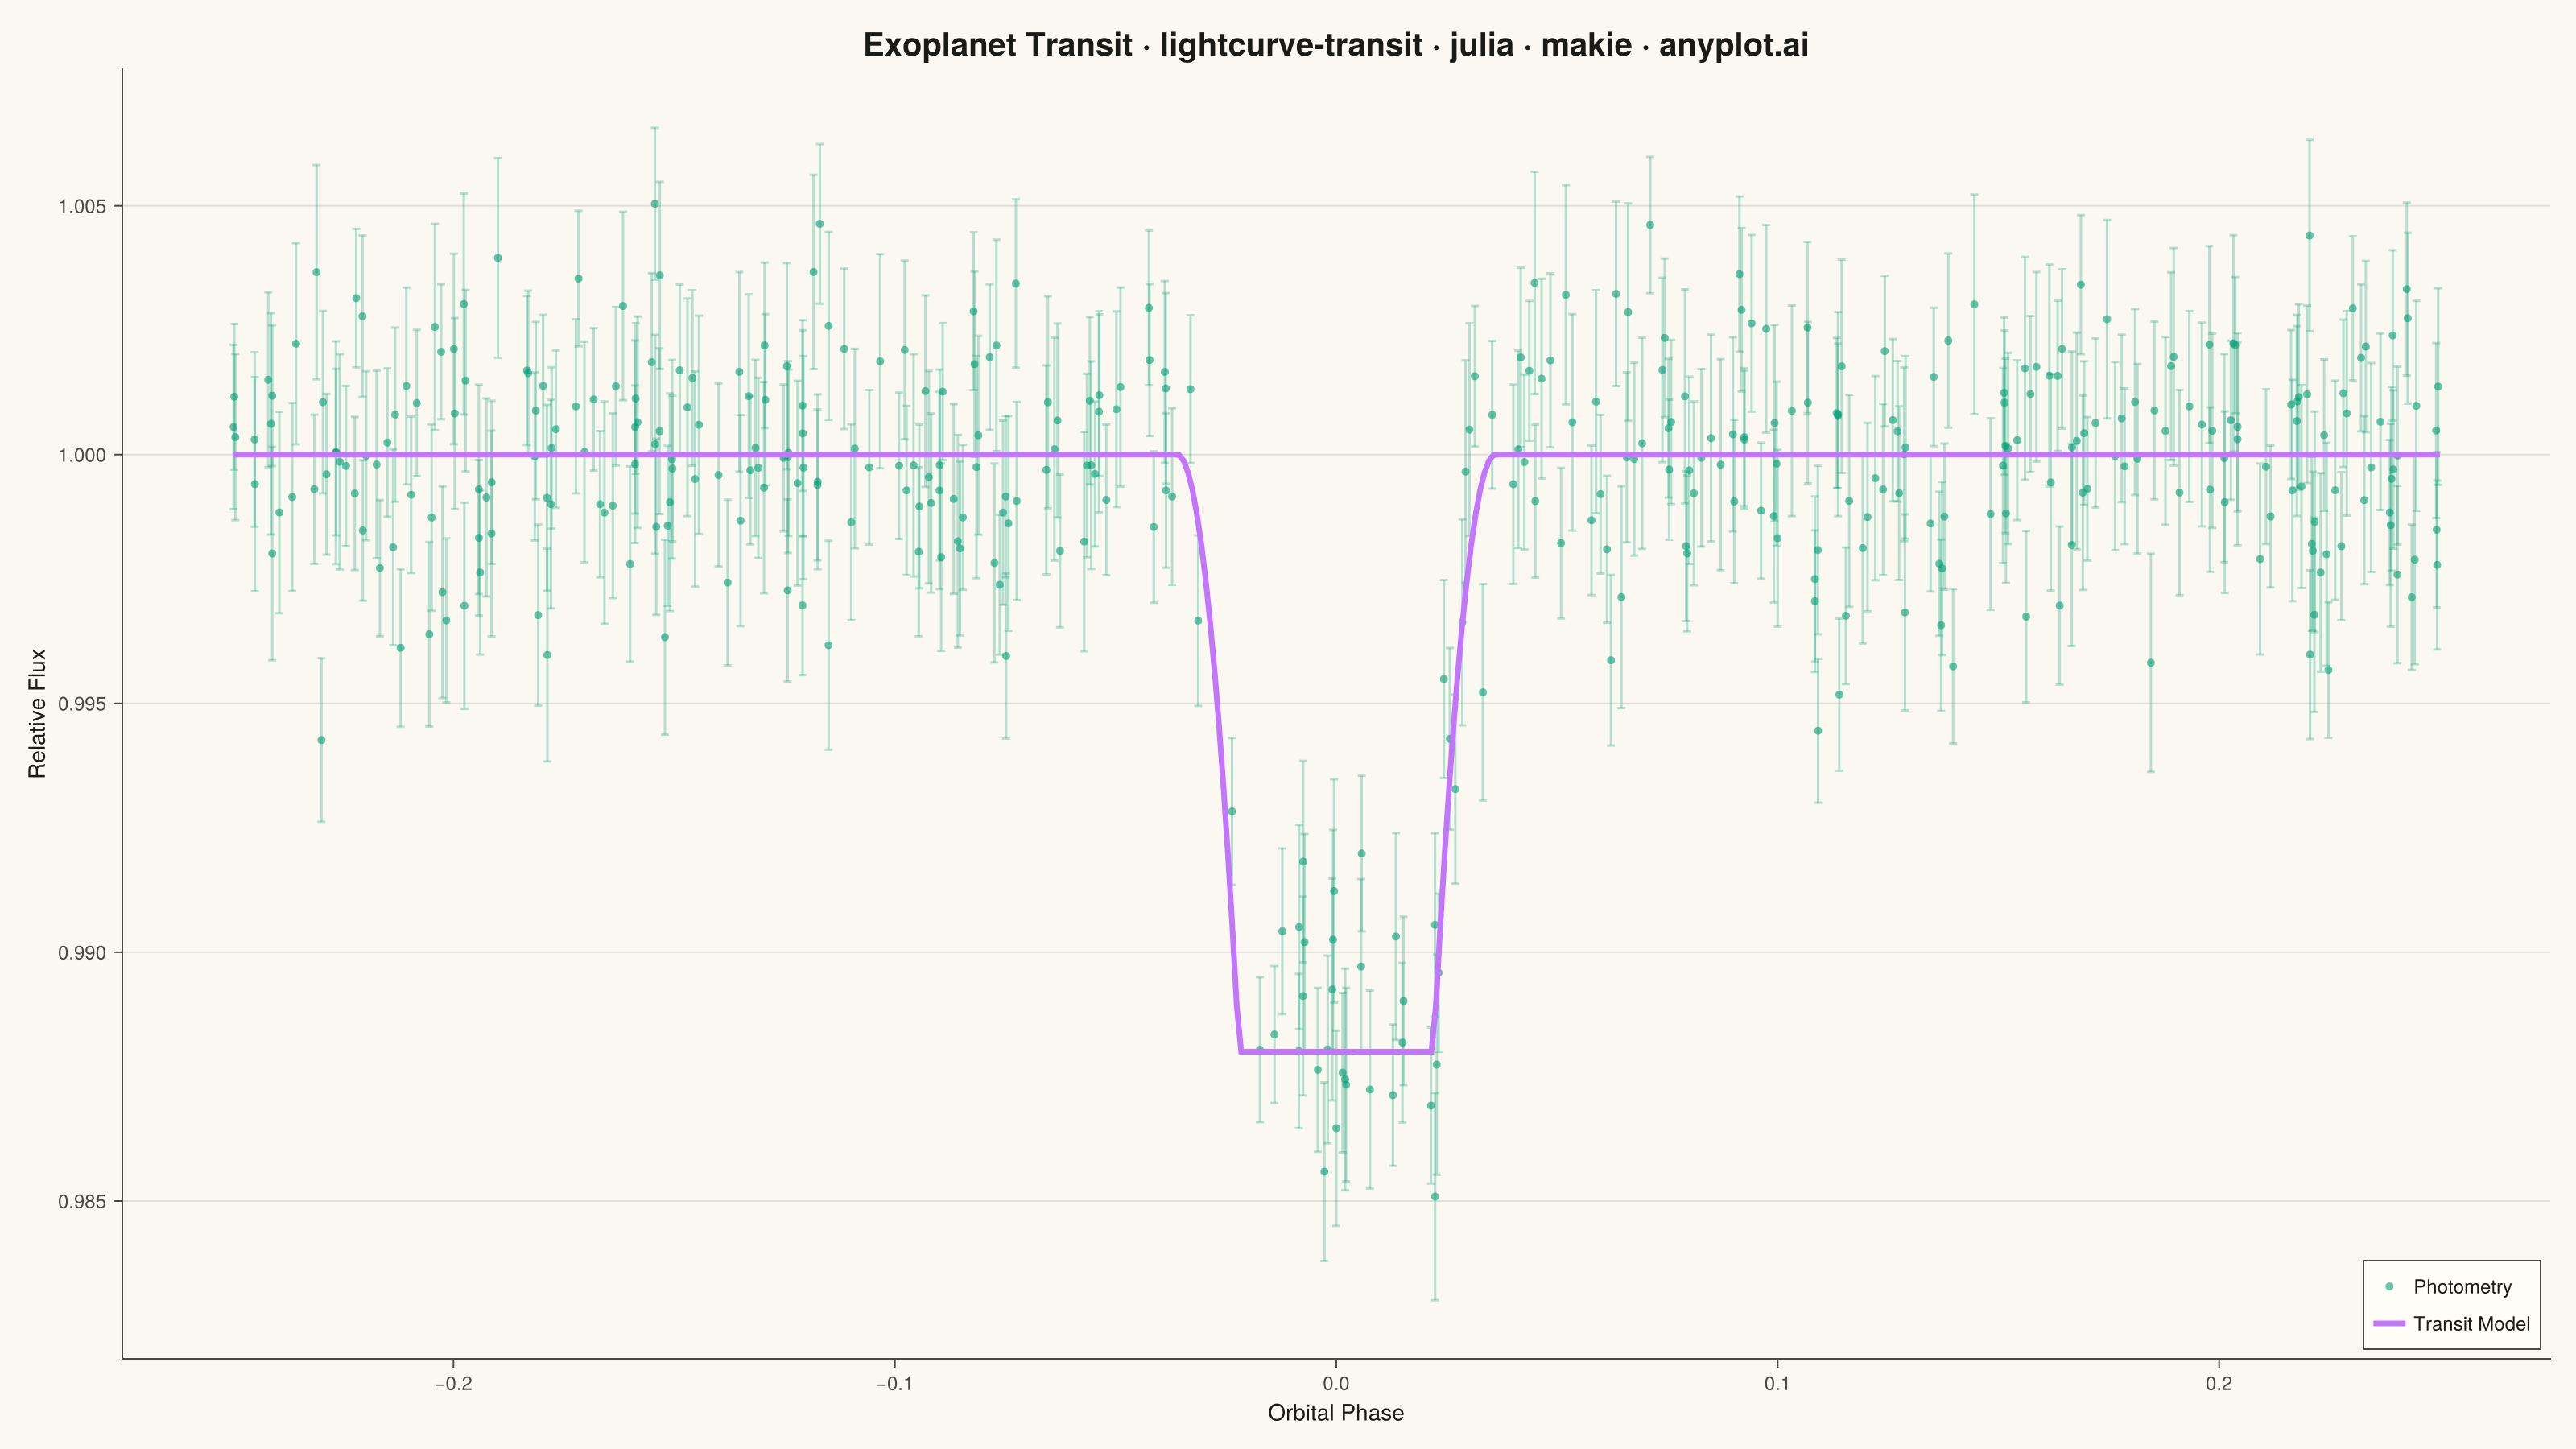
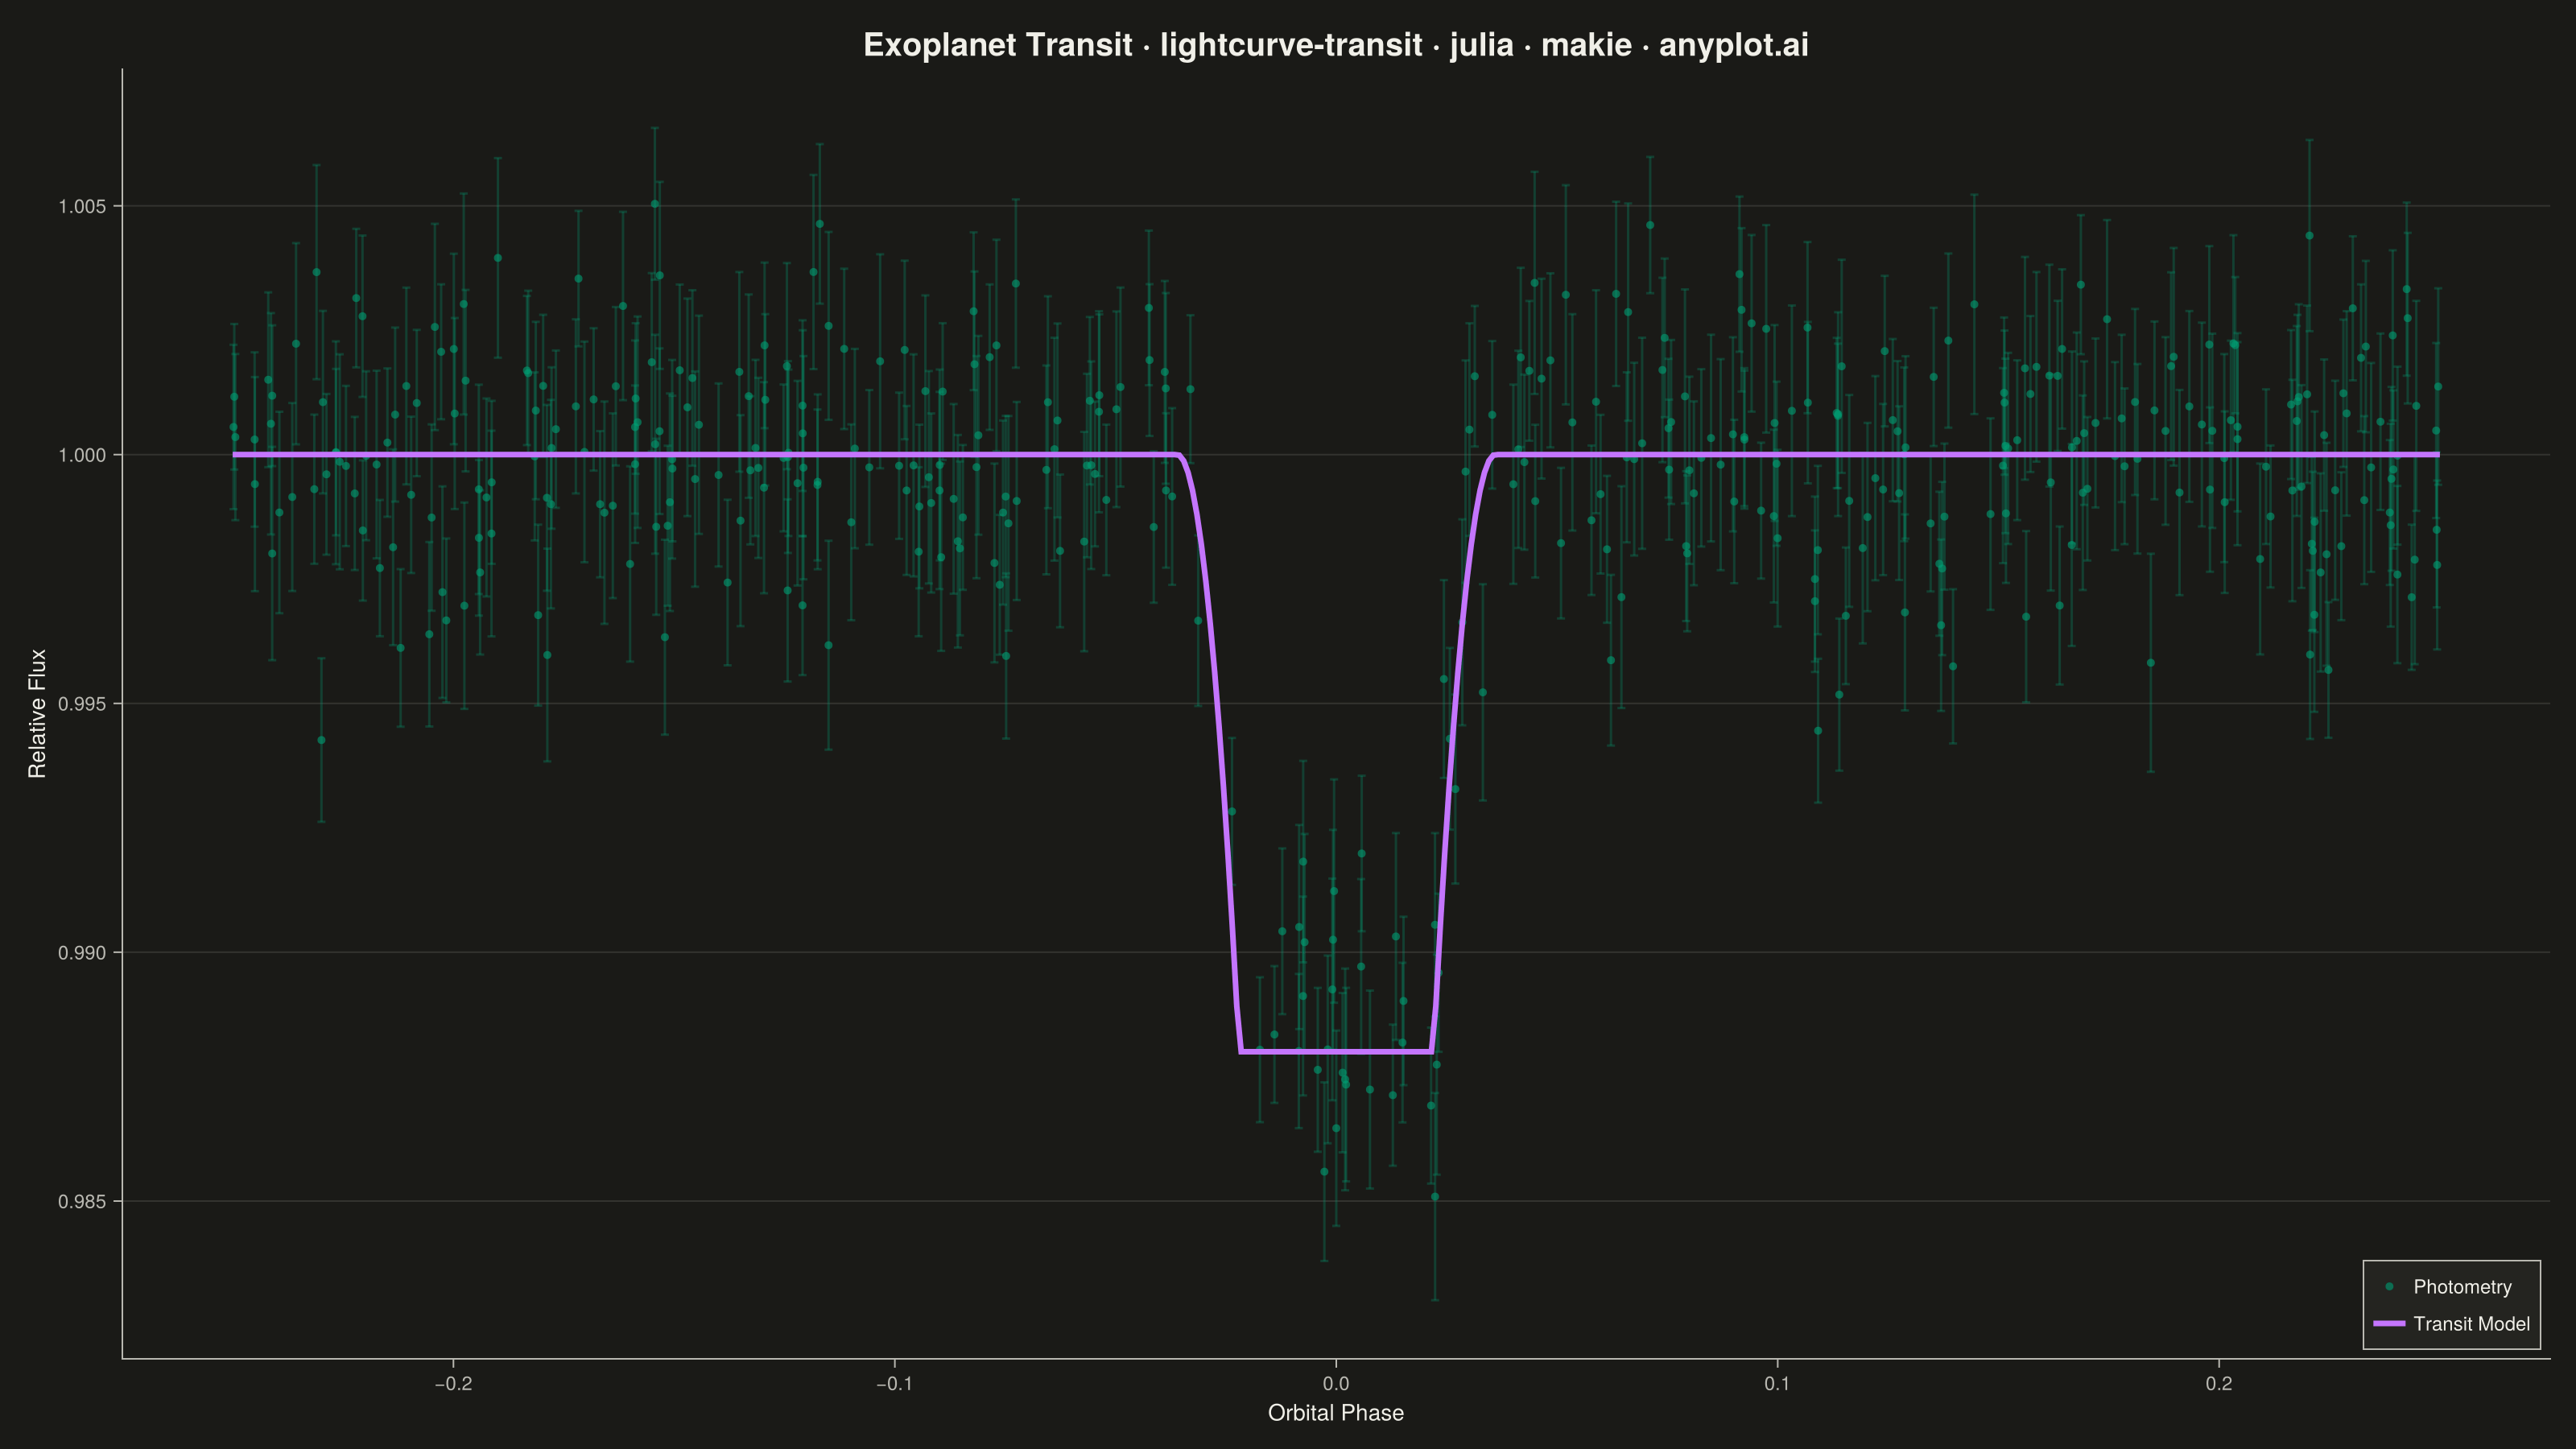
A time-series plot showing the brightness of an astronomical object over time, designed to reveal exoplanet transit events as characteristic dips in flux. The plot displays photometric measurements with error bars against time or orbital phase, with an optional fitted transit model overlay. This visualization is fundamental in observational astronomy for detecting and characterizing planetary transits, variable stars, and other periodic brightness variations.
# anyplot.ai
# lightcurve-transit: Astronomical Light Curve
# Library: makie 0.22.10 | Julia 1.11.9
# Quality: 89/100 | Created: 2026-06-20

using CairoMakie
using Colors
using Random

Random.seed!(42)

# Theme tokens — Imprint palette (see prompts/default-style-guide.md)
const THEME       = get(ENV, "ANYPLOT_THEME", "light")
const PAGE_BG     = THEME == "light" ? colorant"#FAF8F1" : colorant"#1A1A17"
const ELEVATED_BG = THEME == "light" ? colorant"#FFFDF6" : colorant"#242420"
const INK         = THEME == "light" ? colorant"#1A1A17" : colorant"#F0EFE8"
const INK_SOFT    = THEME == "light" ? colorant"#4A4A44" : colorant"#B8B7B0"

const IMPRINT_PALETTE = [
    colorant"#009E73",  # 1 — brand green (always first series)
    colorant"#C475FD",  # 2 — lavender
    colorant"#4467A3",  # 3 — blue
    colorant"#BD8233",  # 4 — ochre
    colorant"#AE3030",  # 5 — matte red
    colorant"#2ABCCD",  # 6 — cyan
    colorant"#954477",  # 7 — rose
    colorant"#99B314",  # 8 — lime
]

# Transit model: smooth trapezoid with quadratic ingress/egress ramps
# Parameters: center=0.0, depth=1.2%, t14=0.072 (total), t23=0.044 (flat bottom)
function transit_model(phase)
    r = abs(phase)
    r >= 0.036 && return 1.0
    r <= 0.022 && return 0.988
    frac = (r - 0.022) / 0.014   # 0 at 2nd contact, 1 at 1st contact
    return 1.0 - 0.012 * (1.0 - frac)^2
end

# Simulated phase-folded exoplanet photometry — 400 observations over phase -0.25 to 0.25
n_obs        = 400
phases_raw   = (rand(n_obs) .- 0.5) .* 0.5
noise_sigma  = 0.0018
flux_raw     = transit_model.(phases_raw) .+ randn(n_obs) .* noise_sigma
flux_err_raw = fill(noise_sigma, n_obs) .* (0.75 .+ 0.5 .* rand(n_obs))

sort_idx   = sortperm(phases_raw)
phases_obs = phases_raw[sort_idx]
flux_obs   = flux_raw[sort_idx]
flux_err   = flux_err_raw[sort_idx]

# Dense model curve for smooth overlay
phases_curve = collect(range(-0.25, 0.25, length=500))
model_curve  = transit_model.(phases_curve)

# Semi-transparent colors for observations
c1 = IMPRINT_PALETTE[1]
obs_color     = RGBA(c1.r, c1.g, c1.b, 0.60)
obs_err_color = RGBA(c1.r, c1.g, c1.b, 0.28)

# Figure — landscape 3200×1800 px (size × px_per_unit = 1600×2 = 3200)
fig = Figure(
    size            = (1600, 900),
    fontsize        = 14,
    backgroundcolor = PAGE_BG,
)

ax = Axis(
    fig[1, 1];
    title              = "Exoplanet Transit · lightcurve-transit · julia · makie · anyplot.ai",
    titlesize          = 20,
    titlecolor         = INK,
    xlabel             = "Orbital Phase",
    ylabel             = "Relative Flux",
    xlabelsize         = 14,
    ylabelsize         = 14,
    xlabelcolor        = INK,
    ylabelcolor        = INK,
    xticklabelsize     = 12,
    yticklabelsize     = 12,
    xticklabelcolor    = INK_SOFT,
    yticklabelcolor    = INK_SOFT,
    xtickcolor         = INK_SOFT,
    ytickcolor         = INK_SOFT,
    backgroundcolor    = PAGE_BG,
    topspinevisible    = false,
    rightspinevisible  = false,
    leftspinecolor     = INK_SOFT,
    bottomspinecolor   = INK_SOFT,
    xgridvisible       = false,
    ygridcolor         = RGBAf(INK.r, INK.g, INK.b, 0.12),
    xminorgridvisible  = false,
    yminorgridvisible  = false,
)

# Baseline flux=1.0 reference — marks the out-of-transit level
hlines!(ax, [1.0];
    color     = RGBAf(INK.r, INK.g, INK.b, 0.35),
    linewidth = 1.0,
    linestyle = :dash,
)

# Transit contact-point markers: 1st/4th contact (ingress/egress boundaries)
# and 2nd/3rd contact (flat-bottom edges)
vlines!(ax, [-0.036, 0.036];
    color     = RGBAf(INK.r, INK.g, INK.b, 0.25),
    linewidth = 1.0,
    linestyle = :dash,
)
vlines!(ax, [-0.022, 0.022];
    color     = RGBAf(INK.r, INK.g, INK.b, 0.18),
    linewidth = 1.0,
    linestyle = :dot,
)

# Error bars rendered first so scatter points sit on top
errorbars!(ax, phases_obs, flux_obs, flux_err;
    color        = obs_err_color,
    whiskerwidth = 5,
)

# Scattered photometric measurements — Imprint position 1 (brand green)
scatter!(ax, phases_obs, flux_obs;
    color       = obs_color,
    markersize  = 9,
    strokewidth = 0,
    label       = "Photometry",
)

# Best-fit transit model overlay — Imprint position 2 (lavender)
lines!(ax, phases_curve, model_curve;
    color     = IMPRINT_PALETTE[2],
    linewidth = 4.0,
    label     = "Transit Model",
)

axislegend(ax;
    position        = :rb,
    backgroundcolor = ELEVATED_BG,
    framecolor      = INK_SOFT,
    labelcolor      = INK,
    labelsize       = 12,
)

save("plot-$(THEME).png", fig; px_per_unit = 2)
Runnable source as JSON, for any HTTP client: https://api.anyplot.ai/specs/lightcurve-transit/makie/code. Any spec id and library id listed in llms-full.txt fit the same URL shape; every URL below is complete and callable.
{
  "spec_id": "lightcurve-transit",
  "language": "julia",
  "library": "makie",
  "page": "https://anyplot.ai/lightcurve-transit/julia/makie",
  "hub": "https://anyplot.ai/lightcurve-transit",
  "code_json": "https://api.anyplot.ai/specs/lightcurve-transit/makie/code",
  "spec_json": "https://api.anyplot.ai/specs/lightcurve-transit",
  "render_light_png": "https://storage.googleapis.com/anyplot-images/plots/lightcurve-transit/julia/makie/plot-light.png",
  "render_dark_png": "https://storage.googleapis.com/anyplot-images/plots/lightcurve-transit/julia/makie/plot-dark.png",
  "quality_score": 89.0,
  "license": "MIT",
  "guide": "https://anyplot.ai/llms.txt"
}
Part of Astronomical Light Curve on anyplot.ai.