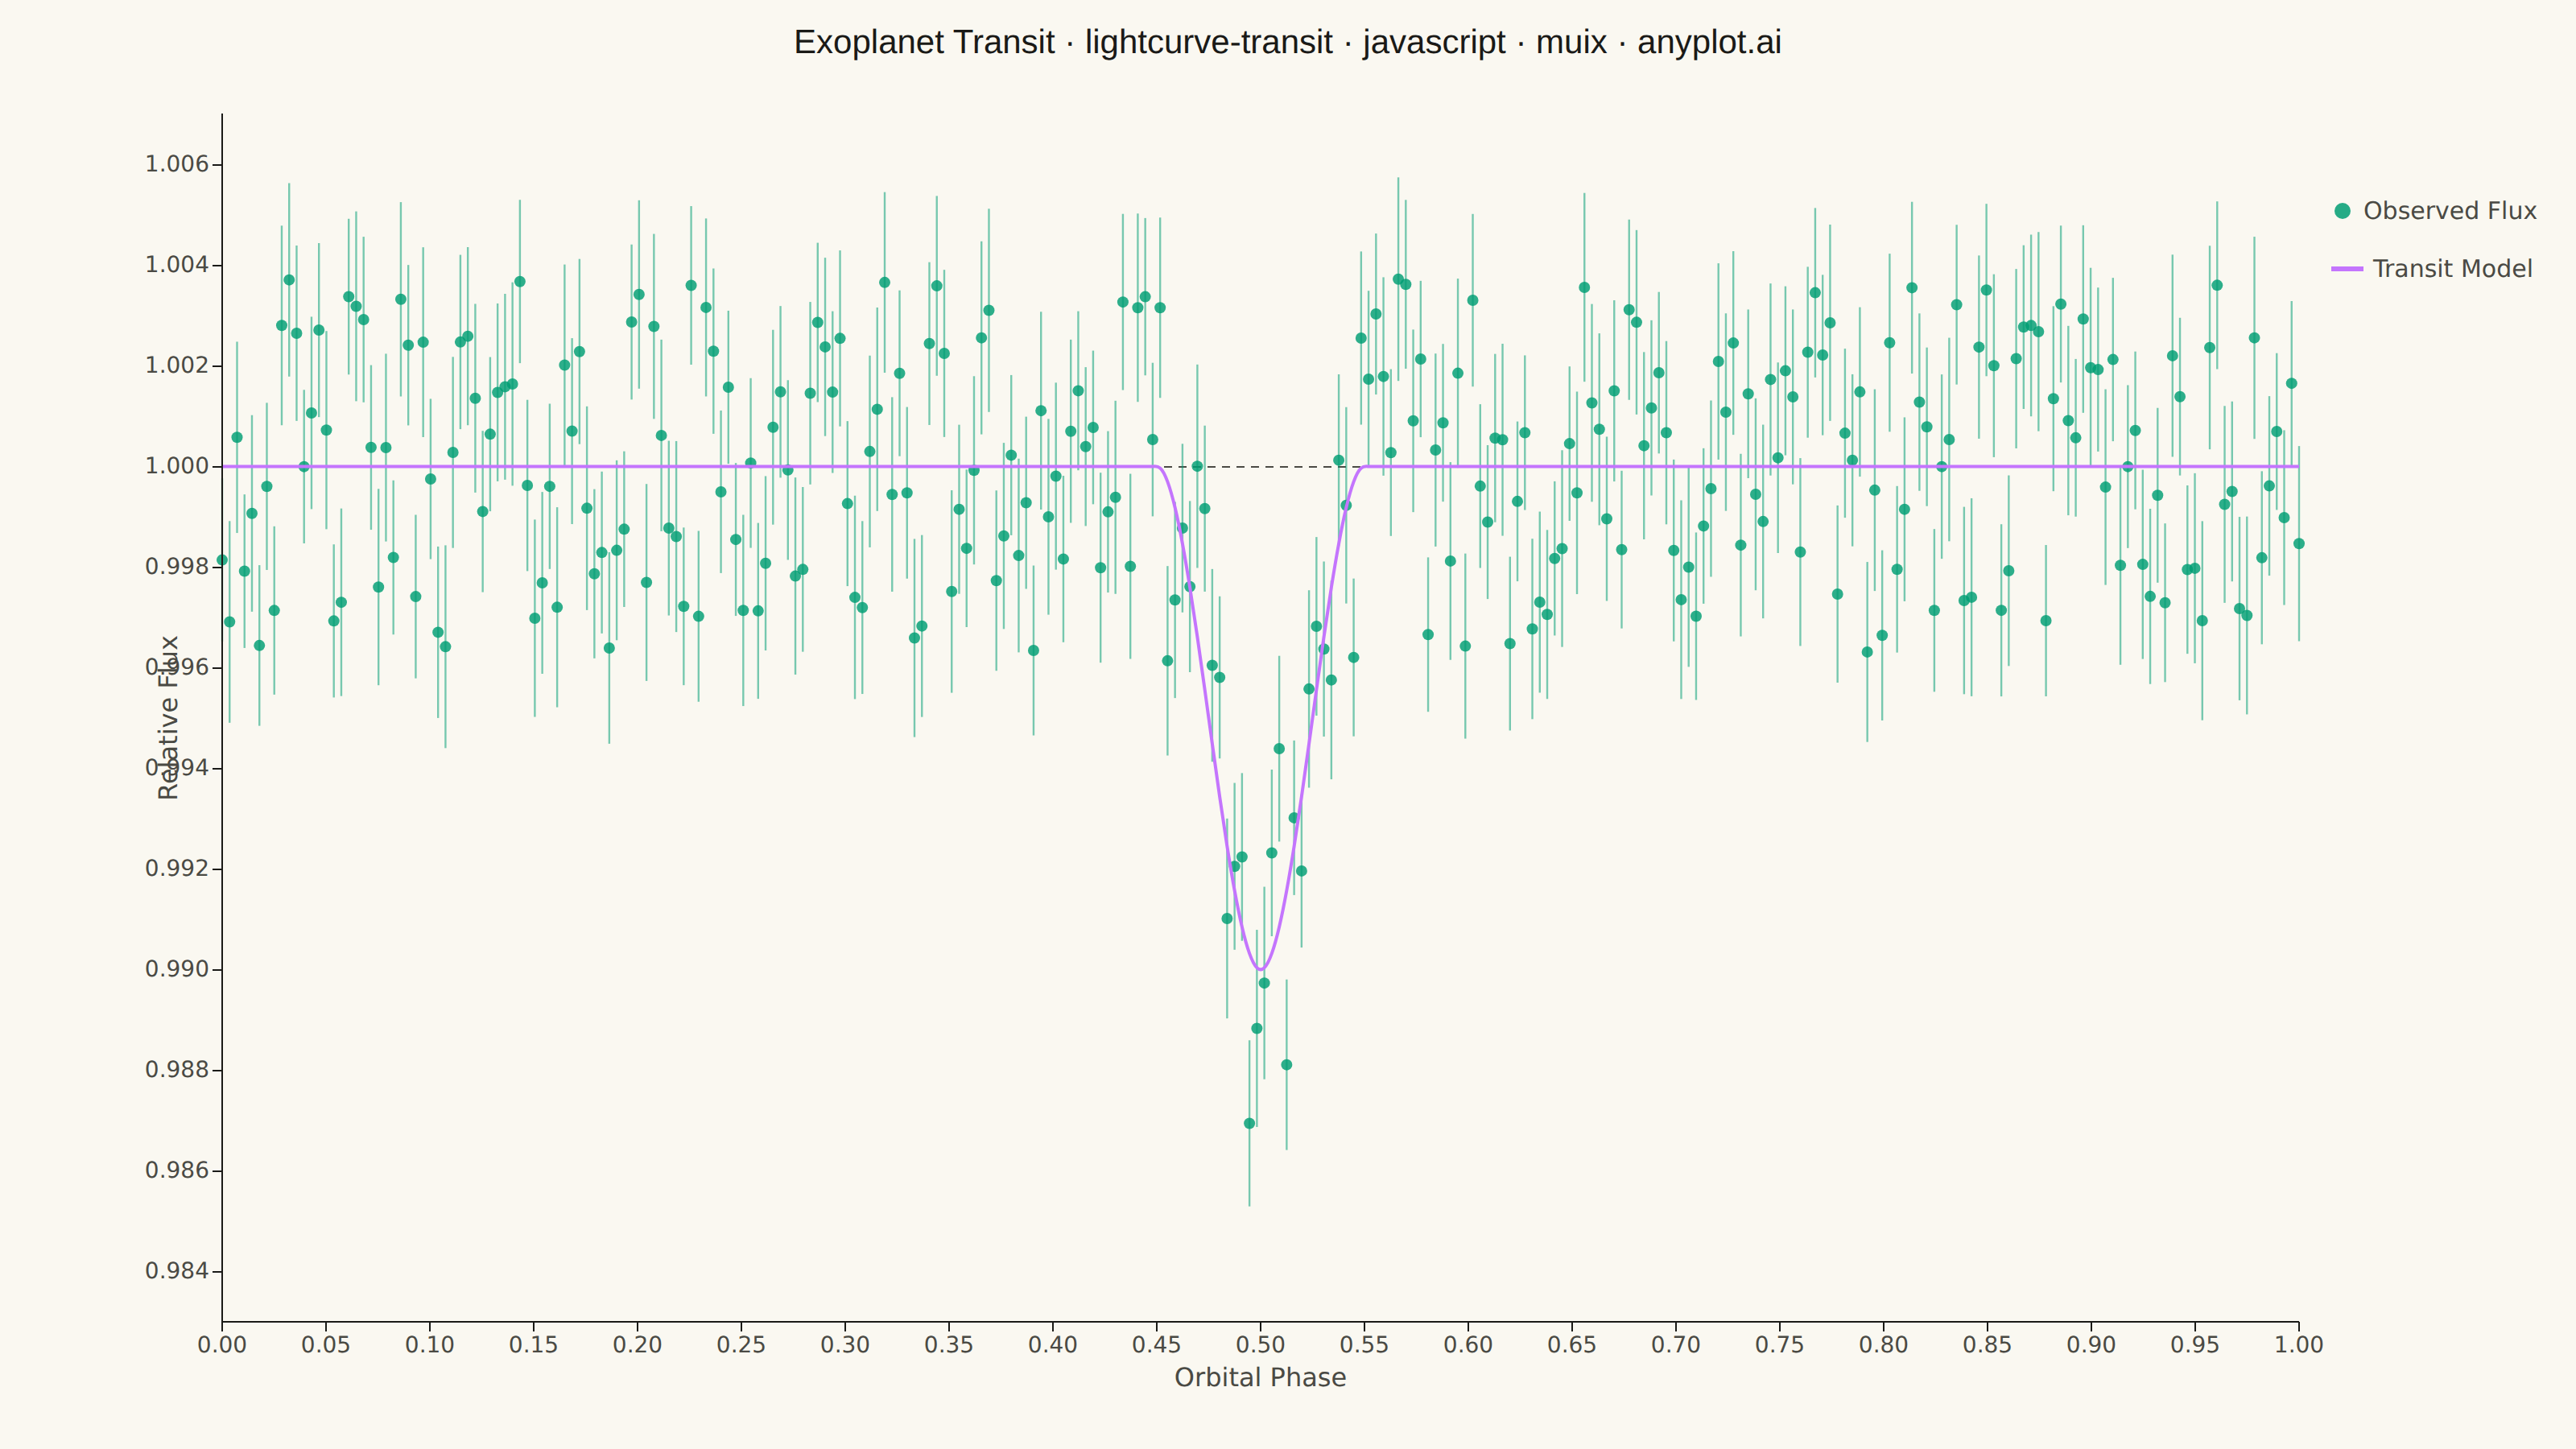
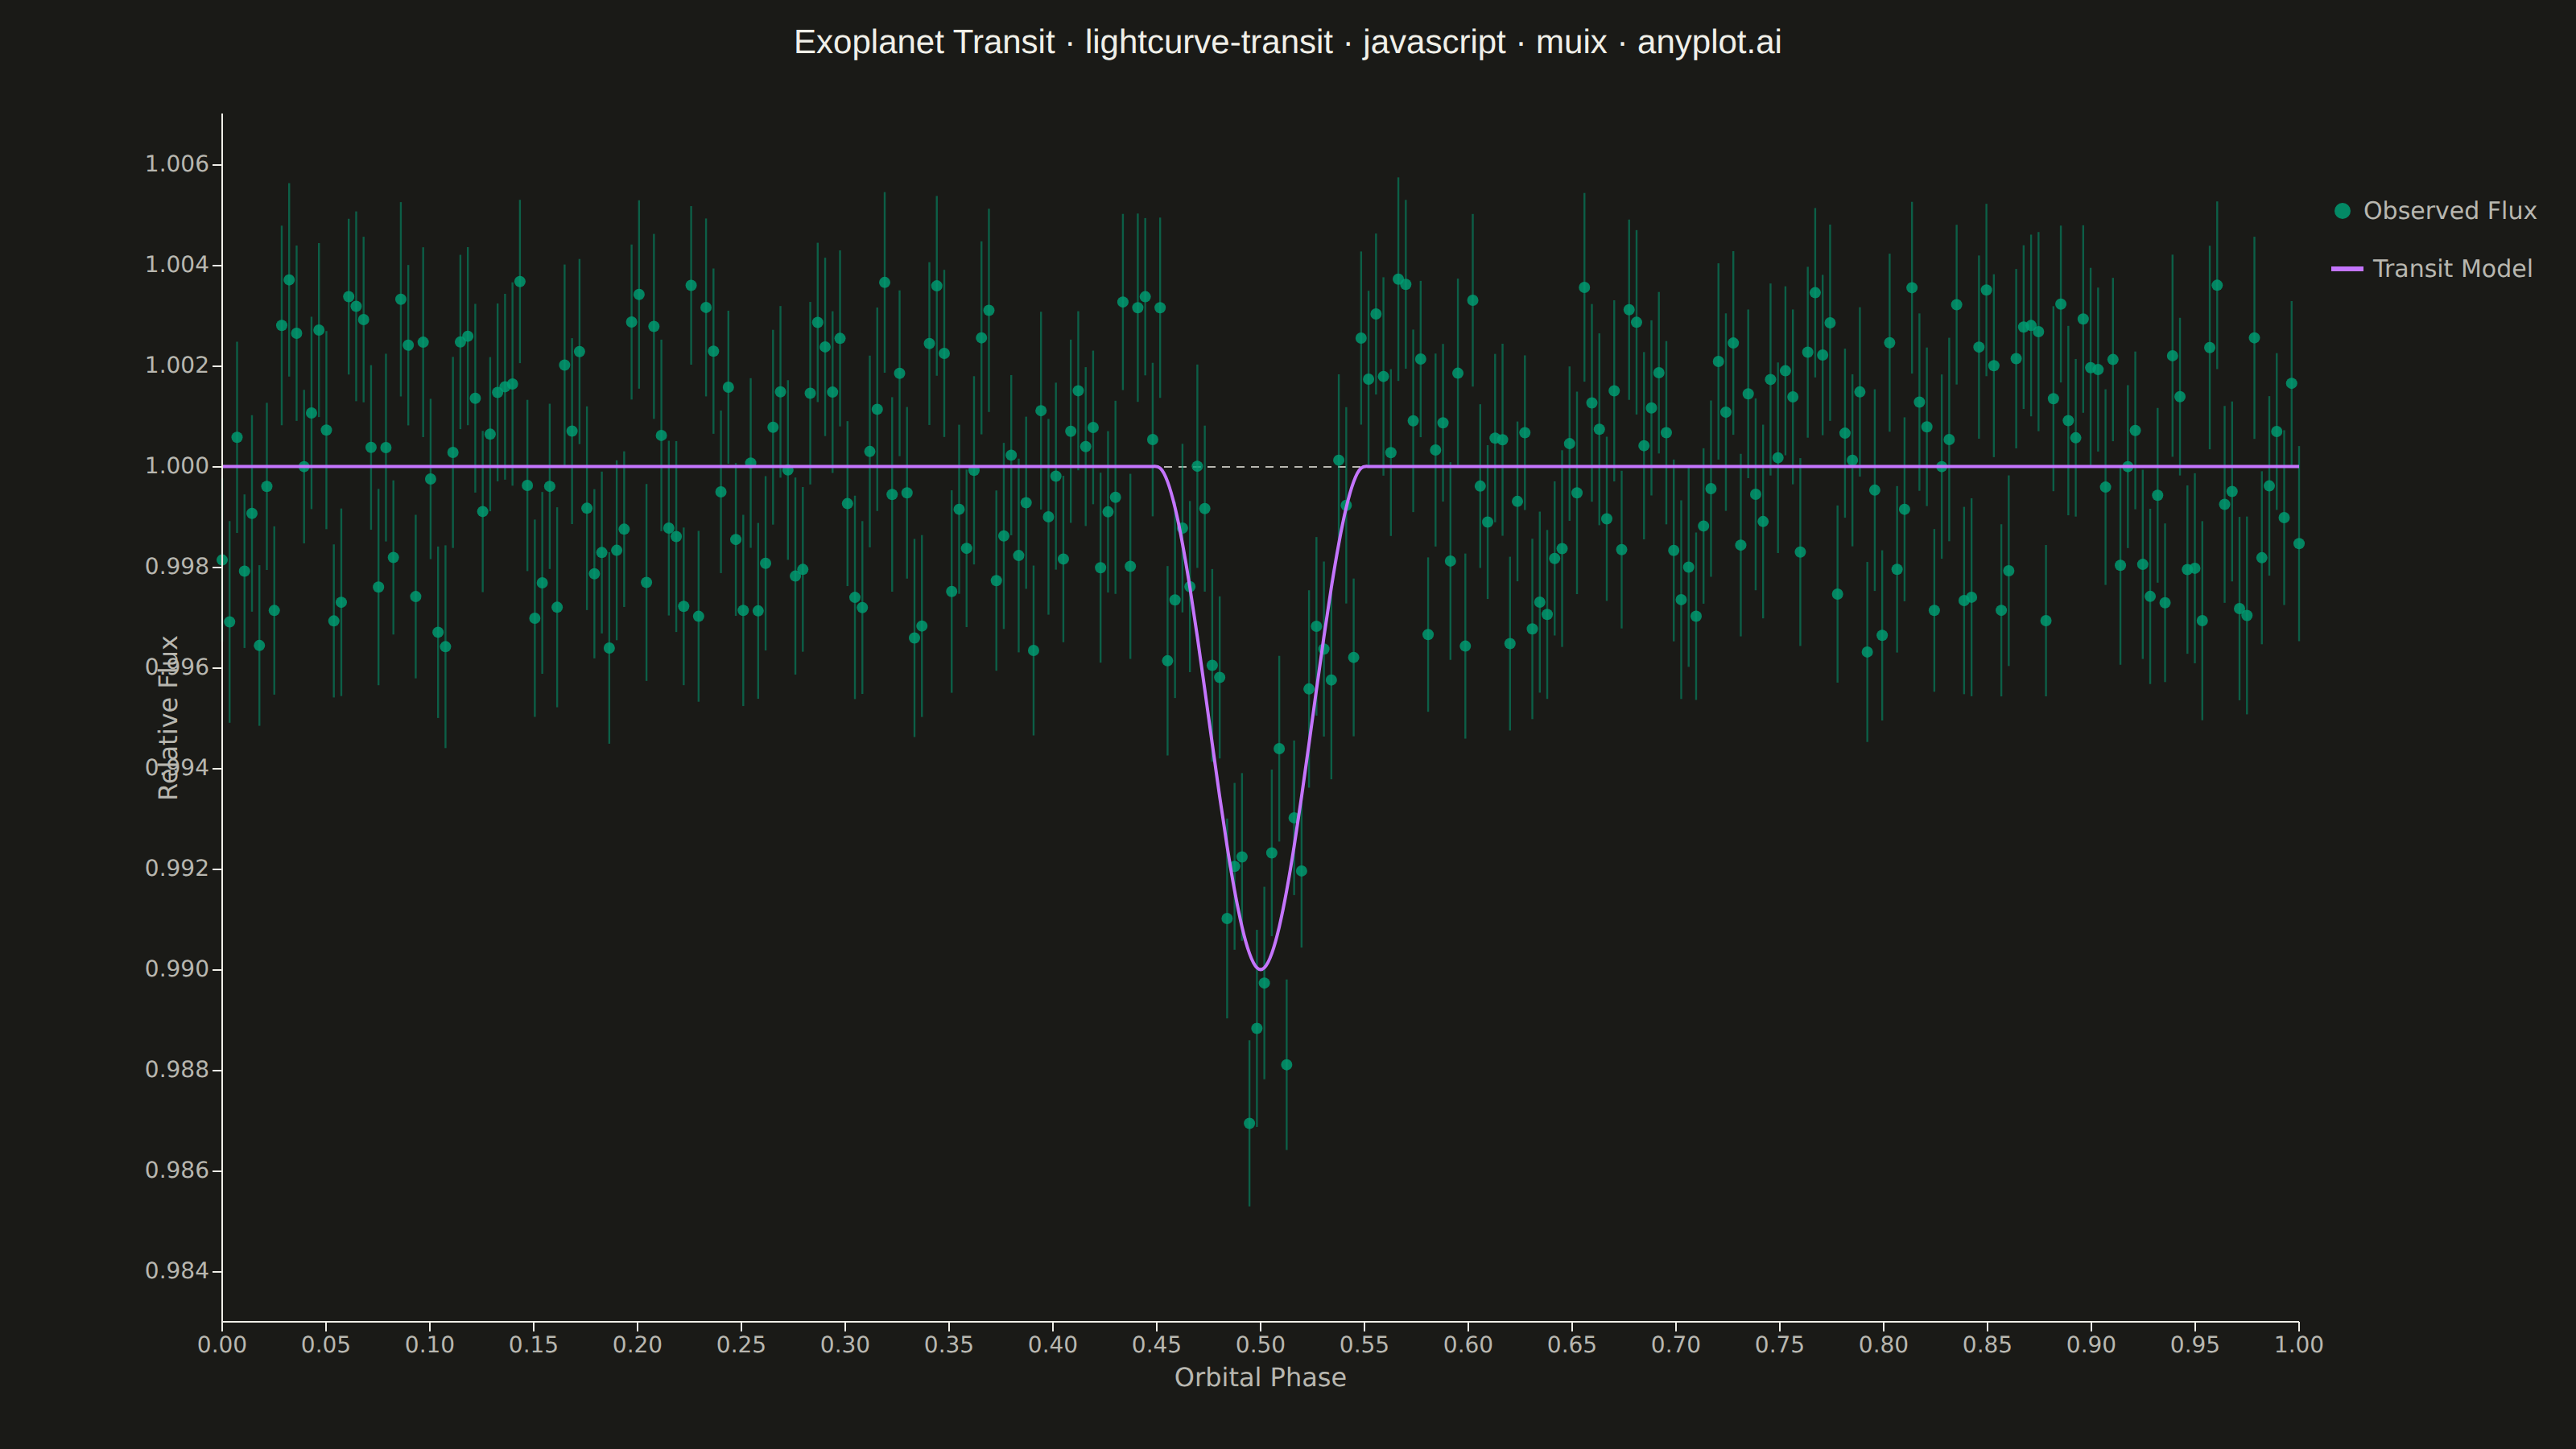
A time-series plot showing the brightness of an astronomical object over time, designed to reveal exoplanet transit events as characteristic dips in flux. The plot displays photometric measurements with error bars against time or orbital phase, with an optional fitted transit model overlay. This visualization is fundamental in observational astronomy for detecting and characterizing planetary transits, variable stars, and other periodic brightness variations.
// anyplot.ai
// lightcurve-transit: Astronomical Light Curve
// Library: muix 7.29.1 | JavaScript 22.22.3
// Quality: 92/100 | Created: 2026-06-20
//# anyplot-orientation: landscape
// anyplot.ai
// lightcurve-transit: Astronomical Light Curve
// Library: MUI X Charts | React | Node 22
// License: @mui/x-charts — MIT (community). Pro/Premium are out of scope.
// Quality: pending | Created: 2026-06-20

import { ChartContainer } from "@mui/x-charts/ChartContainer";
import { LinePlot } from "@mui/x-charts/LineChart";
import { ChartsXAxis } from "@mui/x-charts/ChartsXAxis";
import { ChartsYAxis } from "@mui/x-charts/ChartsYAxis";
import { ChartsReferenceLine } from "@mui/x-charts/ChartsReferenceLine";
import { useDrawingArea } from "@mui/x-charts/hooks";
import Box from "@mui/material/Box";
import Typography from "@mui/material/Typography";

const t = window.ANYPLOT_TOKENS;
const FONT = "system-ui, -apple-system, sans-serif";

// Deterministic LCG — no seeded Math.random in the browser
function makeLCG(seed) {
  let s = seed >>> 0;
  return () => {
    s = (Math.imul(1664525, s) + 1013904223) >>> 0;
    return s / 0x100000000;
  };
}

// Smooth limb-darkened transit model using smoothstep ingress/egress
const N_PTS = 280;
const TRANSIT_CENTER = 0.5;     // transit centered at mid-phase
const TRANSIT_HALF_DUR = 0.05;  // full duration = 0.10 phase units (0.45–0.55)
const TRANSIT_DEPTH = 0.01;     // 1% flux dip relative to out-of-transit baseline

function smoothstep(x) { return x * x * (3 - 2 * x); }

function computeModel(ph) {
  const dt = Math.abs(ph - TRANSIT_CENTER);
  if (dt >= TRANSIT_HALF_DUR) return 1.0;
  return 1 - TRANSIT_DEPTH * smoothstep(1 - dt / TRANSIT_HALF_DUR);
}

// Simulated TESS-like photometry: 280 phase-folded observations
const rng = makeLCG(42);
const phases = Array.from({ length: N_PTS }, (_, i) => i / (N_PTS - 1));
const modelFlux = phases.map(computeModel);
const NOISE_SIGMA = 0.0015;
const observedFlux = phases.map((_, i) => modelFlux[i] + (rng() * 2 - 1) * NOISE_SIGMA * 2.5);
const fluxErrors = phases.map(() => NOISE_SIGMA * (1 + rng() * 0.35));

// Explicit axis bounds — must match the coordinate mapping inside DataLayer
const FLUX_MIN = 0.983;
const FLUX_MAX = 1.007;

// Renders observed data points: vertical error bars + measurement dots
// Uses useDrawingArea to map data coordinates to SVG pixel positions.
// FLUX_MIN/FLUX_MAX must match the yAxis min/max above for correct alignment.
function DataLayer() {
  const { left, top, width, height } = useDrawingArea();
  const toX = (ph) => left + ph * width;
  const toY = (fl) => top + (FLUX_MAX - fl) / (FLUX_MAX - FLUX_MIN) * height;
  const toH = (e) => e / (FLUX_MAX - FLUX_MIN) * height;
  const C = t.palette[0];  // Imprint brand green — first categorical series

  return (
    <g>
      {/* Error bars (drawn behind dots) */}
      {phases.map((ph, i) => {
        const x = toX(ph);
        const y = toY(observedFlux[i]);
        const ey = toH(fluxErrors[i]);
        return (
          <line
            key={i}
            x1={x} y1={y - ey} x2={x} y2={y + ey}
            stroke={C} strokeWidth={1.2} opacity={0.52}
          />
        );
      })}
      {/* Data dots */}
      {phases.map((ph, i) => (
        <circle
          key={`d${i}`}
          cx={toX(ph)} cy={toY(observedFlux[i])} r={3.5}
          fill={C} opacity={0.82}
        />
      ))}
    </g>
  );
}

// Inline legend positioned in the right margin
function LegendPanel() {
  const { left, top, width } = useDrawingArea();
  const lx = left + width + 20;
  const ly = top + 60;

  return (
    <g fontFamily={FONT} fontSize={15} fill={t.inkSoft}>
      <circle cx={lx + 7} cy={ly} r={5} fill={t.palette[0]} opacity={0.85} />
      <text x={lx + 20} y={ly + 5}>Observed Flux</text>
      <line
        x1={lx} y1={ly + 36} x2={lx + 20} y2={ly + 36}
        stroke={t.palette[1]} strokeWidth={3}
      />
      <text x={lx + 26} y={ly + 41}>Transit Model</text>
    </g>
  );
}

export default function Chart() {
  const { width, height } = window.ANYPLOT_SIZE;
  const titleH = 50;

  return (
    <Box
      sx={{
        width,
        height,
        bgcolor: t.pageBg,
        display: "flex",
        flexDirection: "column",
        pt: "14px",
      }}
    >
      <Typography
        sx={{
          color: t.ink,
          fontSize: 21,
          fontWeight: 500,
          textAlign: "center",
          lineHeight: 1.2,
          mb: "4px",
          fontFamily: "inherit",
        }}
      >
        Exoplanet Transit · lightcurve-transit · javascript · muix · anyplot.ai
      </Typography>

      <ChartContainer
        width={width}
        height={height - titleH}
        margin={{ left: 138, right: 172, top: 28, bottom: 72 }}
        series={[
          {
            type: "line",
            id: "model",
            data: modelFlux,
            label: "Transit Model",
            color: t.palette[1],
            showMark: false,
            curve: "natural",
          },
        ]}
        xAxis={[{ data: phases, scaleType: "linear", min: 0, max: 1 }]}
        yAxis={[{ min: FLUX_MIN, max: FLUX_MAX, valueFormatter: (v) => v.toFixed(3) }]}
      >
        {/* Dashed reference at out-of-transit baseline (flux = 1.0) */}
        <ChartsReferenceLine
          y={1.0}
          lineStyle={{ stroke: t.inkSoft, strokeDasharray: "5 4", strokeWidth: 1 }}
        />

        {/* Observed flux: error bars + dots (rendered before model curve) */}
        <DataLayer />

        {/* Smooth transit model overlaid on top of scatter data */}
        <LinePlot skipAnimation />

        <ChartsXAxis
          label="Orbital Phase"
          tickLabelStyle={{ fontSize: 14, fill: t.inkSoft, fontFamily: FONT }}
          labelStyle={{ fontSize: 16, fontWeight: "500", fill: t.inkSoft, fontFamily: FONT }}
        />
        <ChartsYAxis
          label="Relative Flux"
          tickLabelStyle={{ fontSize: 14, fill: t.inkSoft, fontFamily: FONT }}
          labelStyle={{ fontSize: 16, fontWeight: "500", fill: t.inkSoft, fontFamily: FONT }}
        />

        <LegendPanel />
      </ChartContainer>
    </Box>
  );
}
Runnable source as JSON, for any HTTP client: https://api.anyplot.ai/specs/lightcurve-transit/muix/code. Any spec id and library id listed in llms-full.txt fit the same URL shape; every URL below is complete and callable.
{
  "spec_id": "lightcurve-transit",
  "language": "javascript",
  "library": "muix",
  "page": "https://anyplot.ai/lightcurve-transit/javascript/muix",
  "hub": "https://anyplot.ai/lightcurve-transit",
  "code_json": "https://api.anyplot.ai/specs/lightcurve-transit/muix/code",
  "spec_json": "https://api.anyplot.ai/specs/lightcurve-transit",
  "render_light_png": "https://storage.googleapis.com/anyplot-images/plots/lightcurve-transit/javascript/muix/plot-light.png",
  "render_dark_png": "https://storage.googleapis.com/anyplot-images/plots/lightcurve-transit/javascript/muix/plot-dark.png",
  "interactive_light_html": "https://storage.googleapis.com/anyplot-images/plots/lightcurve-transit/javascript/muix/plot-light.html",
  "interactive_dark_html": "https://storage.googleapis.com/anyplot-images/plots/lightcurve-transit/javascript/muix/plot-dark.html",
  "quality_score": 92.0,
  "license": "MIT",
  "guide": "https://anyplot.ai/llms.txt"
}
Part of Astronomical Light Curve on anyplot.ai.