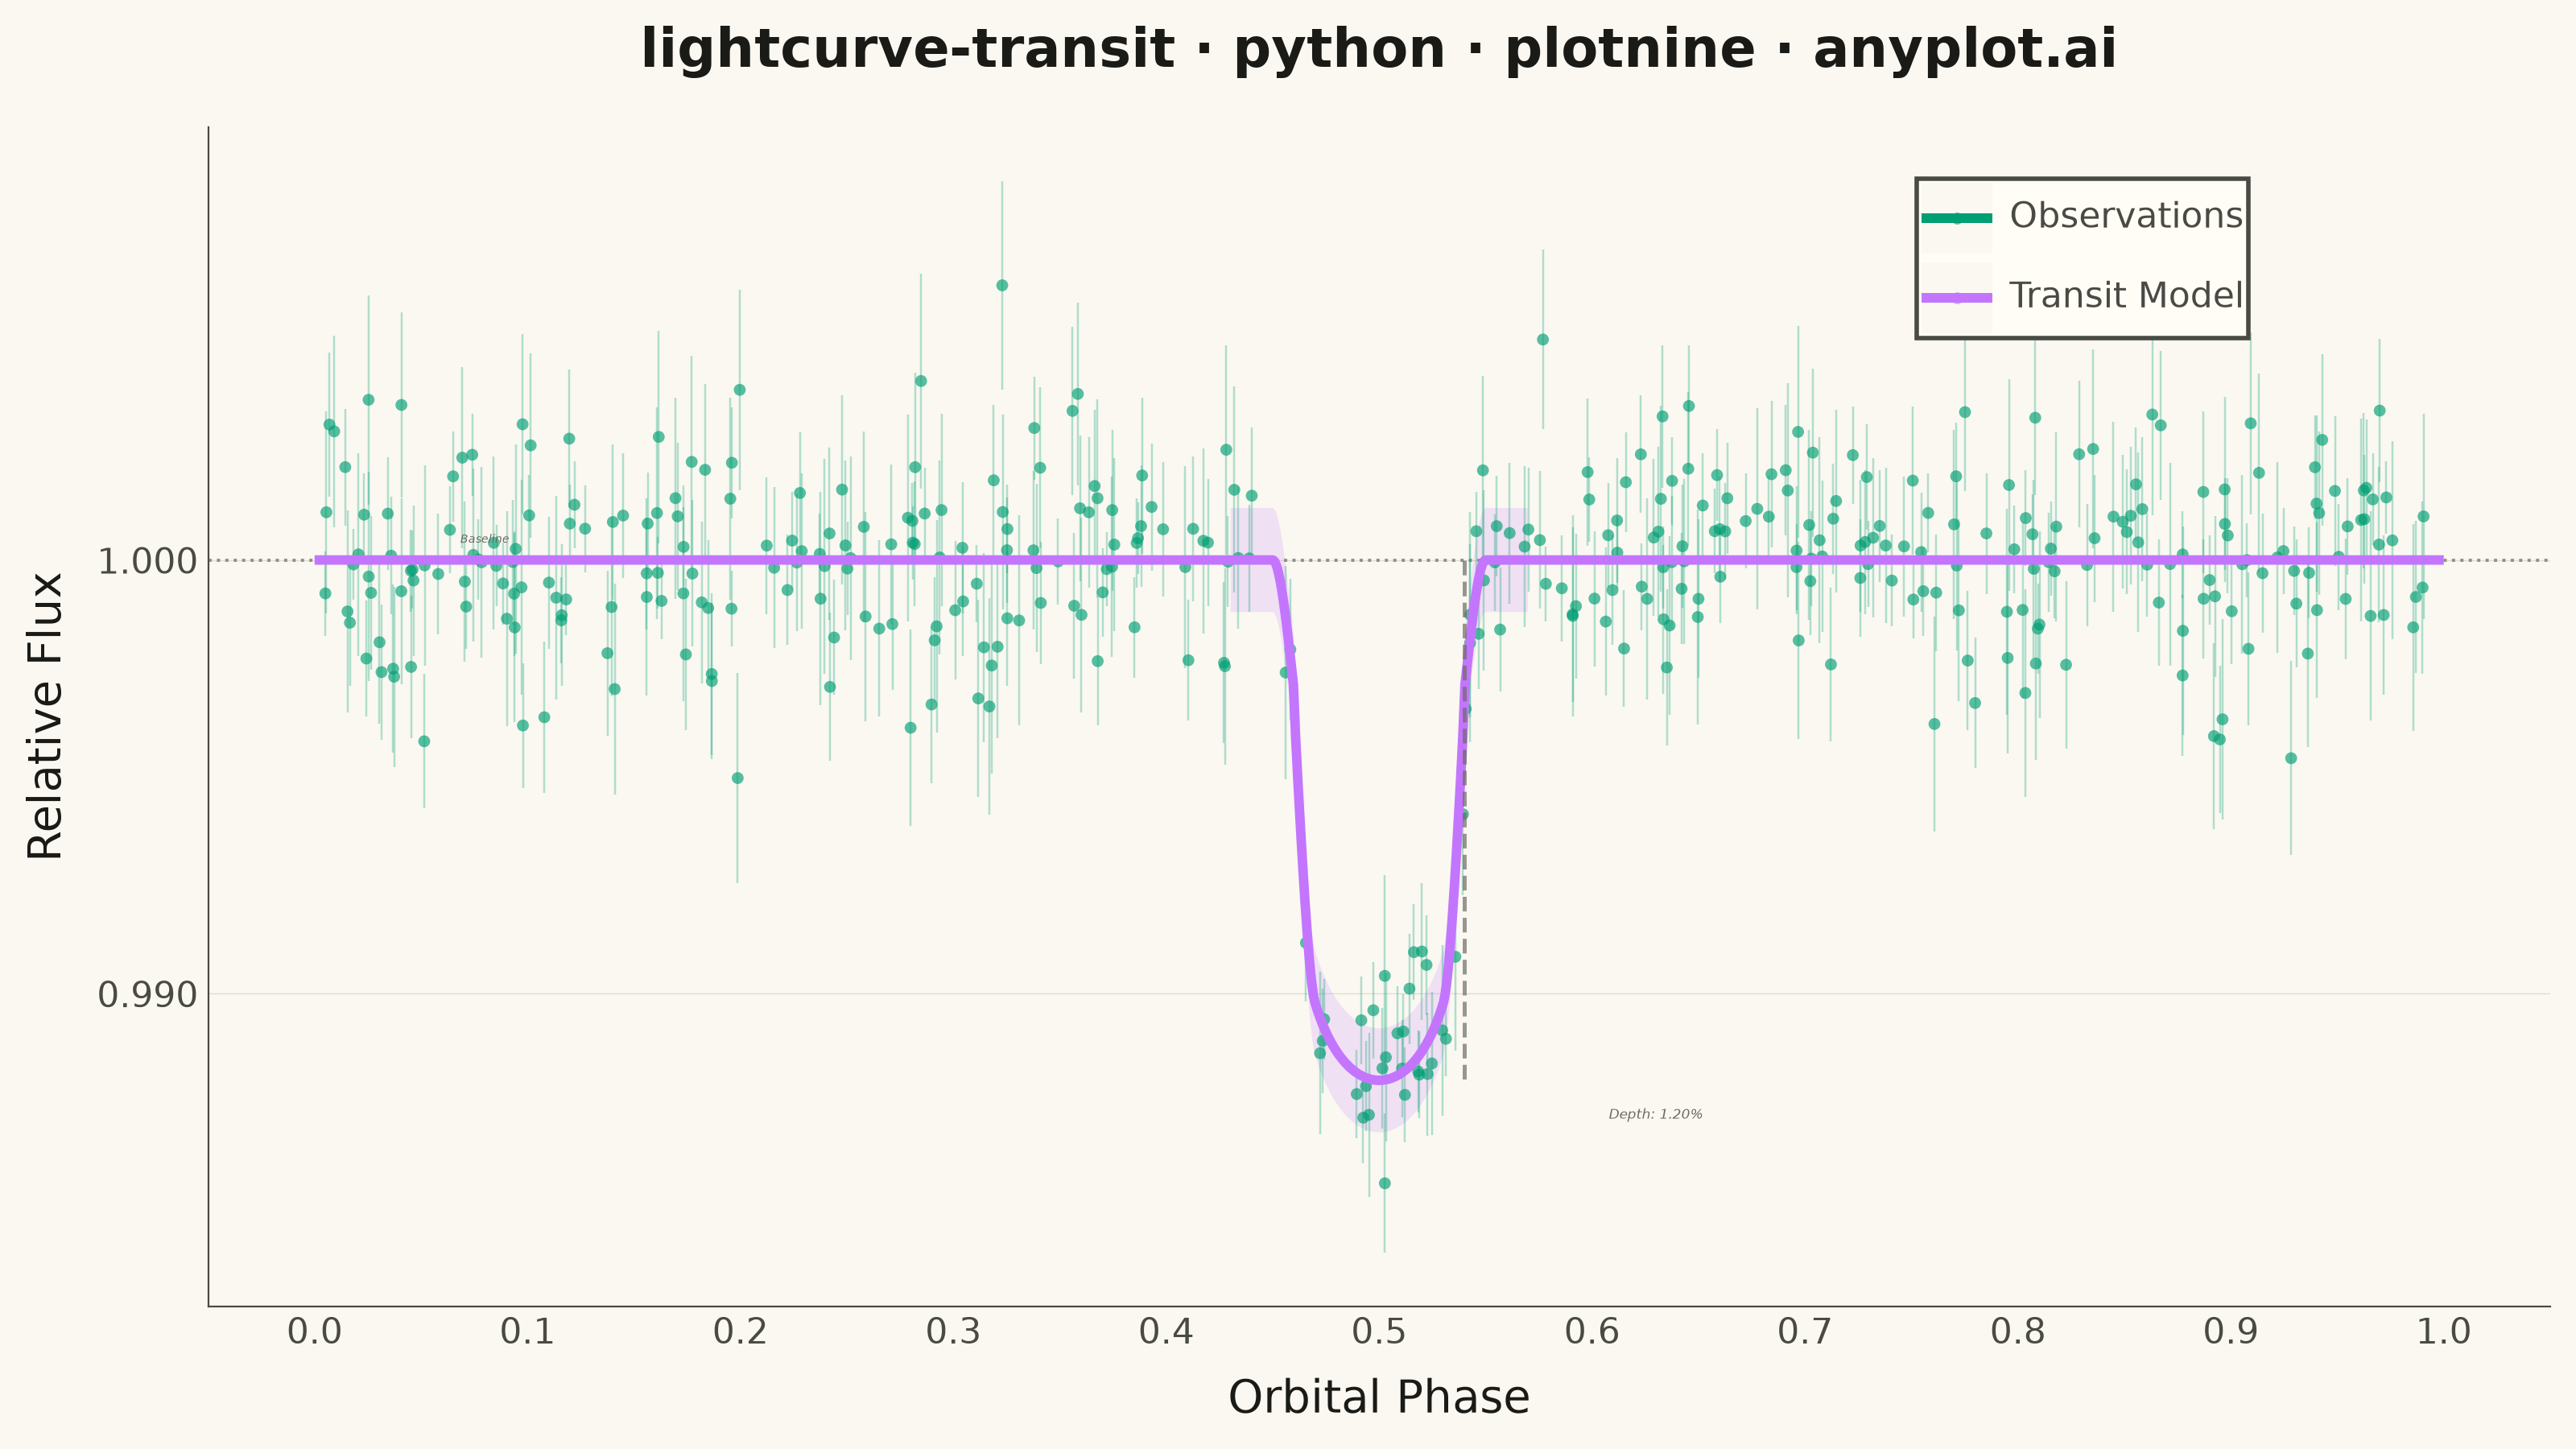
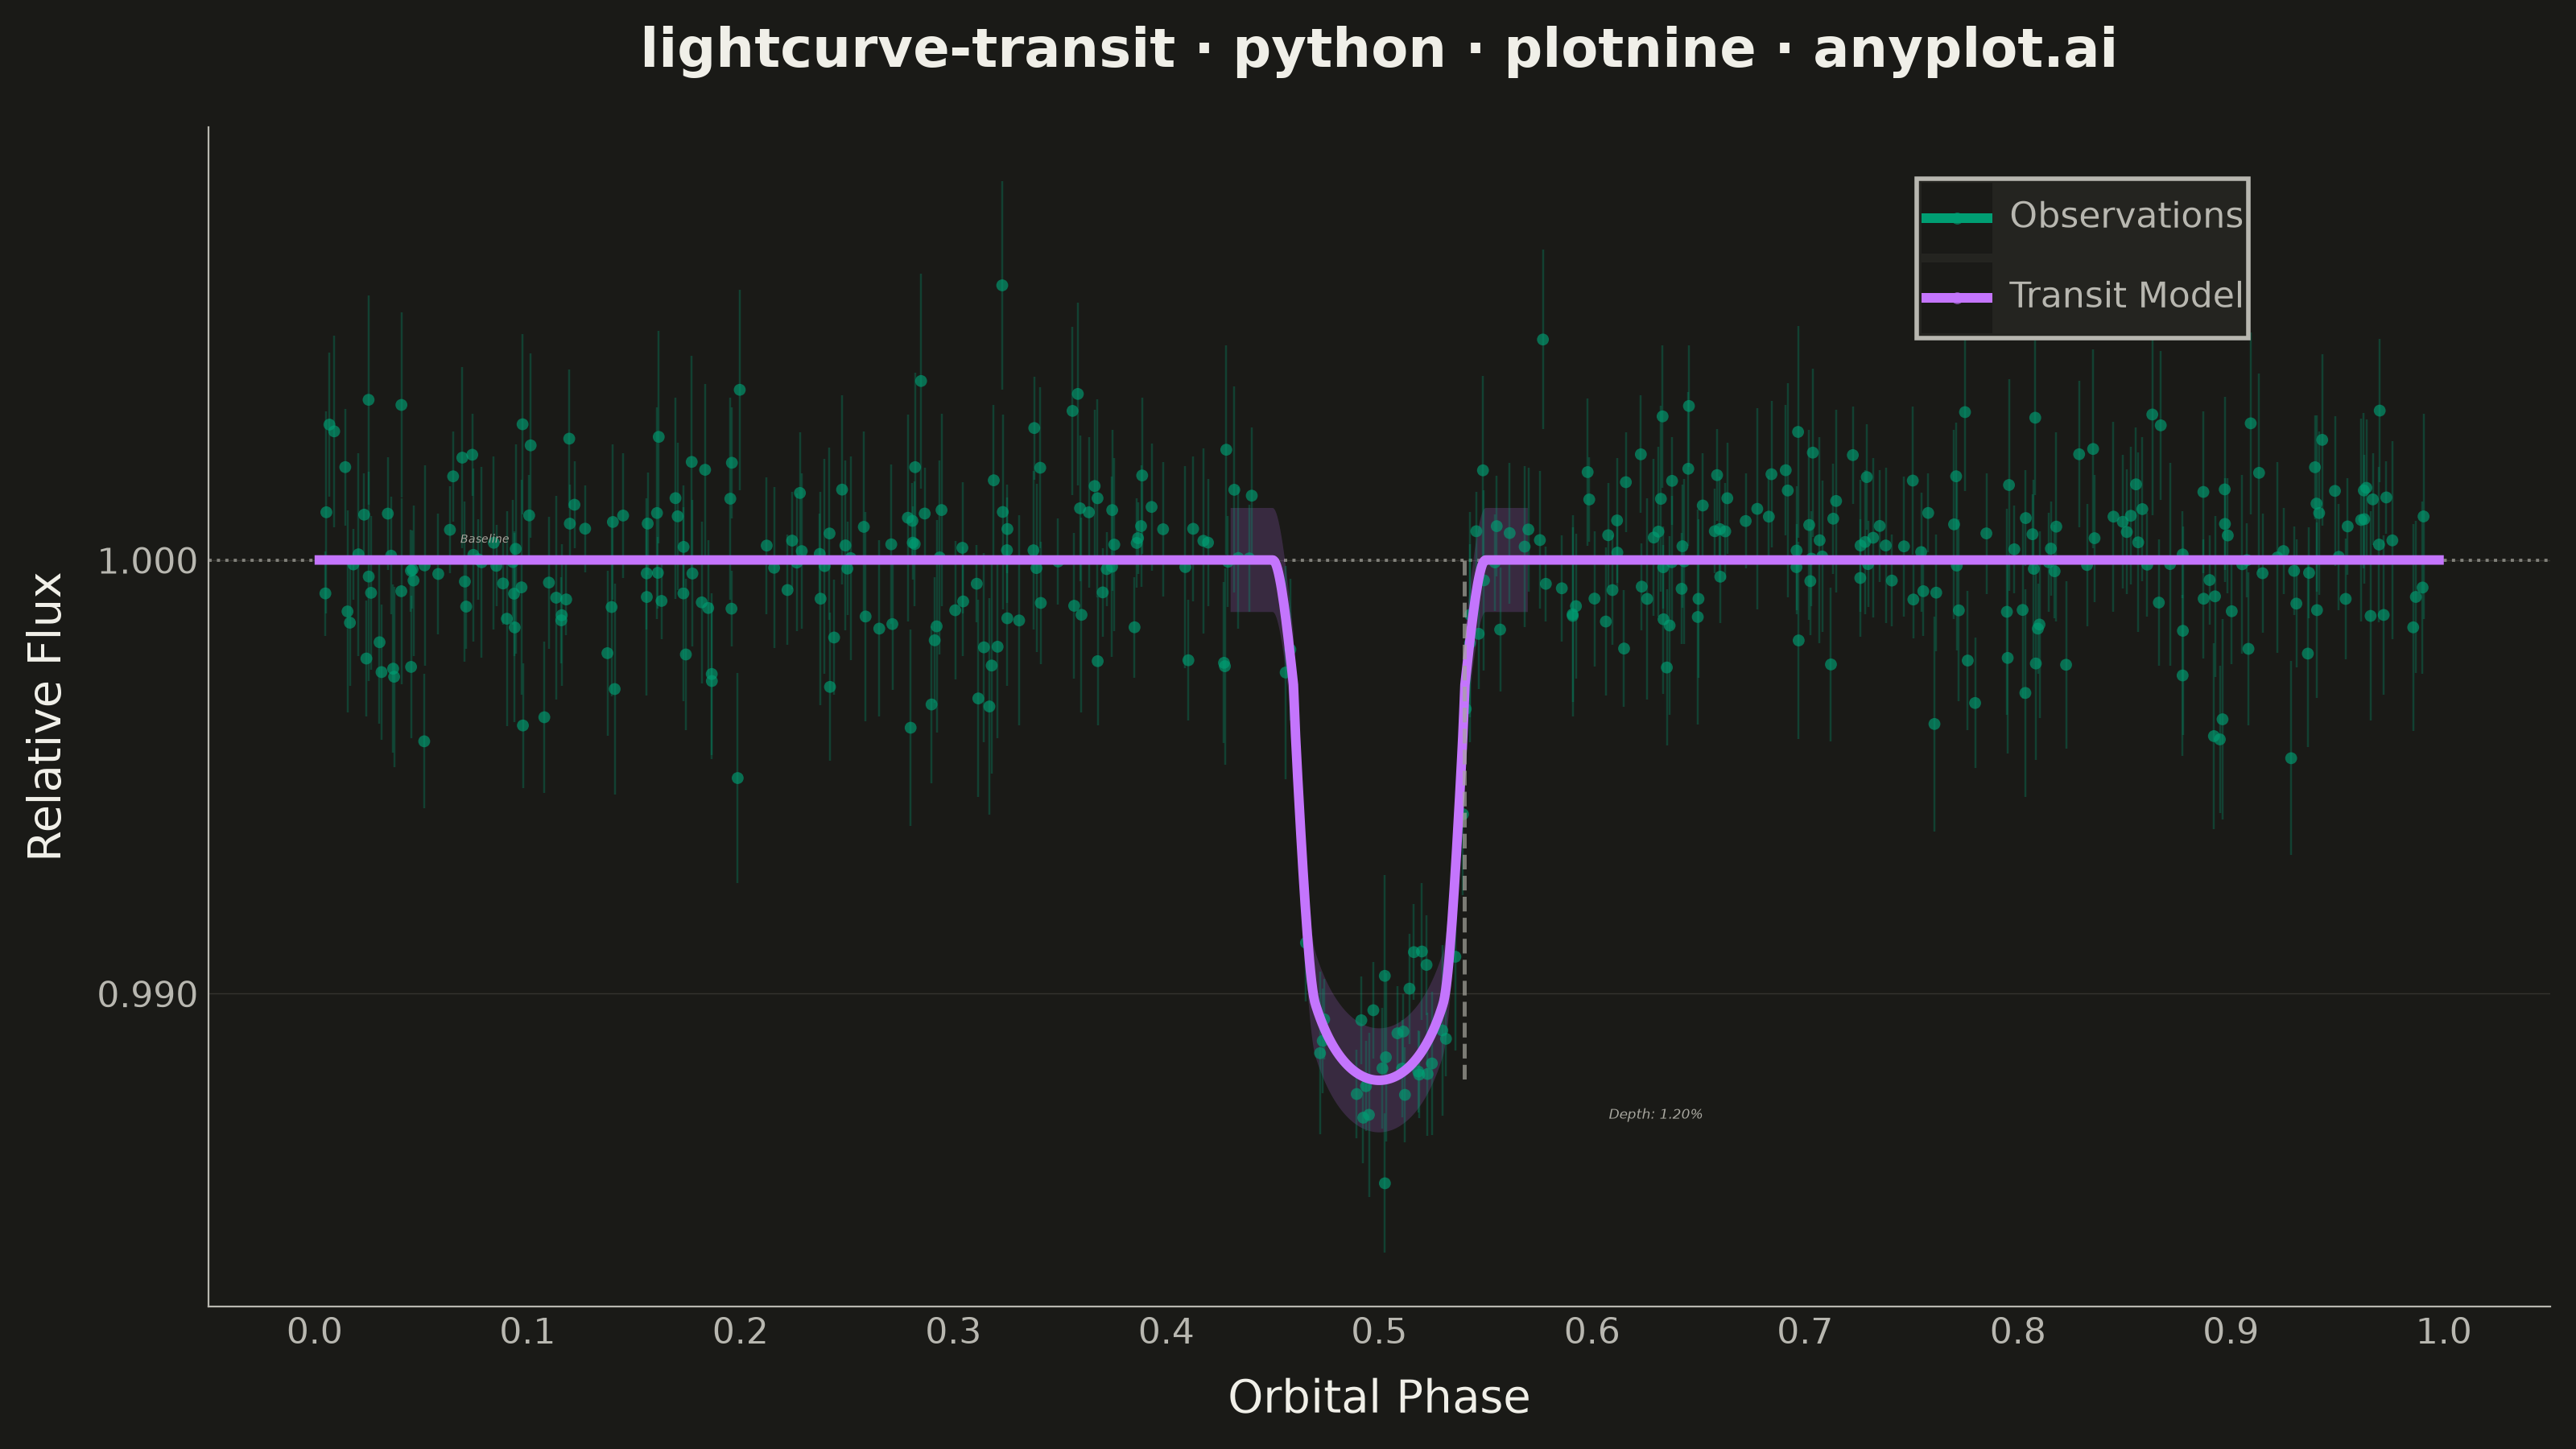
A time-series plot showing the brightness of an astronomical object over time, designed to reveal exoplanet transit events as characteristic dips in flux. The plot displays photometric measurements with error bars against time or orbital phase, with an optional fitted transit model overlay. This visualization is fundamental in observational astronomy for detecting and characterizing planetary transits, variable stars, and other periodic brightness variations.
""" anyplot.ai
lightcurve-transit: Astronomical Light Curve
Library: plotnine 0.15.7 | Python 3.13.14
Quality: 89/100 | Updated: 2026-06-20
"""

import os
import sys


# Prevent self-import: this file is named after the library it imports.
# Strip the script directory so Python finds the installed package instead.
sys.path = [p for p in sys.path if p and os.path.abspath(p) != os.path.dirname(os.path.abspath(__file__))]

import numpy as np
import pandas as pd
from plotnine import (
    aes,
    annotate,
    element_blank,
    element_line,
    element_rect,
    element_text,
    geom_hline,
    geom_line,
    geom_linerange,
    geom_point,
    geom_ribbon,
    ggplot,
    guide_legend,
    guides,
    labs,
    scale_color_manual,
    scale_x_continuous,
    scale_y_continuous,
    theme,
    theme_minimal,
)


THEME = os.getenv("ANYPLOT_THEME", "light")

# Imprint palette — positions 1–8
IMPRINT_PALETTE = ["#009E73", "#C475FD", "#4467A3", "#BD8233", "#AE3030", "#2ABCCD", "#954477", "#99B314"]

# Theme-adaptive chrome
PAGE_BG = "#FAF8F1" if THEME == "light" else "#1A1A17"
ELEVATED_BG = "#FFFDF6" if THEME == "light" else "#242420"
INK = "#1A1A17" if THEME == "light" else "#F0EFE8"
INK_SOFT = "#4A4A44" if THEME == "light" else "#B8B7B0"
INK_MUTED = "#6B6A63" if THEME == "light" else "#A8A79F"

# Data
np.random.seed(42)
n_points = 400
phase = np.sort(np.random.uniform(0.0, 1.0, n_points))

transit_center = 0.5
transit_half_dur = 0.04
ingress_half = 0.01
transit_depth = 0.012
u1, u2 = 0.4, 0.1

# Transit model — observation grid (vectorized)
dist = np.abs(phase - transit_center)
full_transit = dist < transit_half_dur - ingress_half
ingress = (dist >= transit_half_dur - ingress_half) & (dist < transit_half_dur + ingress_half)
r = np.clip(dist / transit_half_dur, 0, 1)
mu = np.sqrt(np.maximum(1 - r**2, 0))
limb = 1 - u1 * (1 - mu) - u2 * (1 - mu) ** 2
transit_model = np.ones(n_points)
transit_model[full_transit] = 1.0 - transit_depth * limb[full_transit]
frac = (transit_half_dur + ingress_half - dist[ingress]) / (2 * ingress_half)
frac = 3 * frac**2 - 2 * frac**3
transit_model[ingress] = 1.0 - transit_depth * limb[ingress] * frac

flux_err = np.random.uniform(0.0008, 0.0025, n_points)
flux = transit_model + np.random.normal(0, 1, n_points) * flux_err

# Fine grid for smooth model overlay
phase_fine = np.linspace(0.0, 1.0, 2000)
dist_f = np.abs(phase_fine - transit_center)
full_f = dist_f < transit_half_dur - ingress_half
ing_f = (dist_f >= transit_half_dur - ingress_half) & (dist_f < transit_half_dur + ingress_half)
r_f = np.clip(dist_f / transit_half_dur, 0, 1)
mu_f = np.sqrt(np.maximum(1 - r_f**2, 0))
limb_f = 1 - u1 * (1 - mu_f) - u2 * (1 - mu_f) ** 2
model_fine = np.ones(2000)
model_fine[full_f] = 1.0 - transit_depth * limb_f[full_f]
frac_f = (transit_half_dur + ingress_half - dist_f[ing_f]) / (2 * ingress_half)
frac_f = 3 * frac_f**2 - 2 * frac_f**3
model_fine[ing_f] = 1.0 - transit_depth * limb_f[ing_f] * frac_f

model_upper = model_fine + 0.0012
model_lower = model_fine - 0.0012
near_transit = np.abs(phase_fine - transit_center) < transit_half_dur + ingress_half + 0.02

df_obs = pd.DataFrame({"phase": phase, "flux": flux, "flux_err": flux_err, "series": "Observations"})
df_model = pd.DataFrame({"phase": phase_fine, "flux": model_fine, "series": "Transit Model"})
df_ribbon = pd.DataFrame(
    {"phase": phase_fine[near_transit], "upper": model_upper[near_transit], "lower": model_lower[near_transit]}
)

min_model = model_fine.min()
depth_pct = (1.0 - min_model) * 100

# Plot
plot = (
    ggplot()
    + geom_hline(yintercept=1.0, color=INK_MUTED, size=0.4, linetype="dotted", alpha=0.7)
    + geom_ribbon(aes(x="phase", ymin="lower", ymax="upper"), data=df_ribbon, fill=IMPRINT_PALETTE[1], alpha=0.18)
    + geom_linerange(
        aes(x="phase", ymin="flux - flux_err", ymax="flux + flux_err"),
        data=df_obs,
        color=IMPRINT_PALETTE[0],
        alpha=0.30,
        size=0.25,
    )
    + geom_point(aes(x="phase", y="flux", color="series"), data=df_obs, alpha=0.65, size=1.5, stroke=0)
    + geom_line(aes(x="phase", y="flux", color="series"), data=df_model, size=1.2)
    + scale_color_manual(values={"Observations": IMPRINT_PALETTE[0], "Transit Model": IMPRINT_PALETTE[1]})
    + guides(color=guide_legend(title=None))
    + annotate(
        "text",
        x=0.63,
        y=min_model - 0.0008,
        label=f"Depth: {depth_pct:.2f}%",
        size=3.0,
        color=INK_MUTED,
        fontstyle="italic",
    )
    + annotate(
        "segment", x=0.54, xend=0.54, y=1.0, yend=min_model, color=INK_MUTED, size=0.5, linetype="dashed", alpha=0.7
    )
    + annotate("text", x=0.08, y=1.0005, label="Baseline", size=2.5, color=INK_MUTED, fontstyle="italic")
    + labs(x="Orbital Phase", y="Relative Flux", title="lightcurve-transit · python · plotnine · anyplot.ai")
    + scale_x_continuous(breaks=np.arange(0, 1.1, 0.1))
    + scale_y_continuous(labels=lambda lst: [f"{v:.3f}" for v in lst])
    + theme_minimal()
    + theme(
        figure_size=(8, 4.5),
        plot_title=element_text(size=12, weight="bold", margin={"b": 6}, color=INK),
        axis_title=element_text(size=10, color=INK),
        axis_text=element_text(size=8, color=INK_SOFT),
        legend_text=element_text(size=8, color=INK_SOFT),
        legend_title=element_blank(),
        legend_position=(0.85, 0.95),
        legend_background=element_rect(fill=ELEVATED_BG, color=INK_SOFT),
        legend_key=element_rect(fill=PAGE_BG, color="none"),
        panel_grid_major_x=element_blank(),
        panel_grid_minor=element_blank(),
        panel_grid_major_y=element_line(color=INK, size=0.25, alpha=0.12),
        plot_background=element_rect(fill=PAGE_BG, color=PAGE_BG),
        panel_background=element_rect(fill=PAGE_BG),
        axis_line=element_line(color=INK_SOFT, size=0.4),
    )
)

plot.save(f"plot-{THEME}.png", dpi=400, width=8, height=4.5, units="in", verbose=False)
Runnable source as JSON, for any HTTP client: https://api.anyplot.ai/specs/lightcurve-transit/plotnine/code. Any spec id and library id listed in llms-full.txt fit the same URL shape; every URL below is complete and callable.
{
  "spec_id": "lightcurve-transit",
  "language": "python",
  "library": "plotnine",
  "page": "https://anyplot.ai/lightcurve-transit/python/plotnine",
  "hub": "https://anyplot.ai/lightcurve-transit",
  "code_json": "https://api.anyplot.ai/specs/lightcurve-transit/plotnine/code",
  "spec_json": "https://api.anyplot.ai/specs/lightcurve-transit",
  "render_light_png": "https://storage.googleapis.com/anyplot-images/plots/lightcurve-transit/python/plotnine/plot-light.png",
  "render_dark_png": "https://storage.googleapis.com/anyplot-images/plots/lightcurve-transit/python/plotnine/plot-dark.png",
  "quality_score": 89.0,
  "license": "MIT",
  "guide": "https://anyplot.ai/llms.txt"
}
Part of Astronomical Light Curve on anyplot.ai.