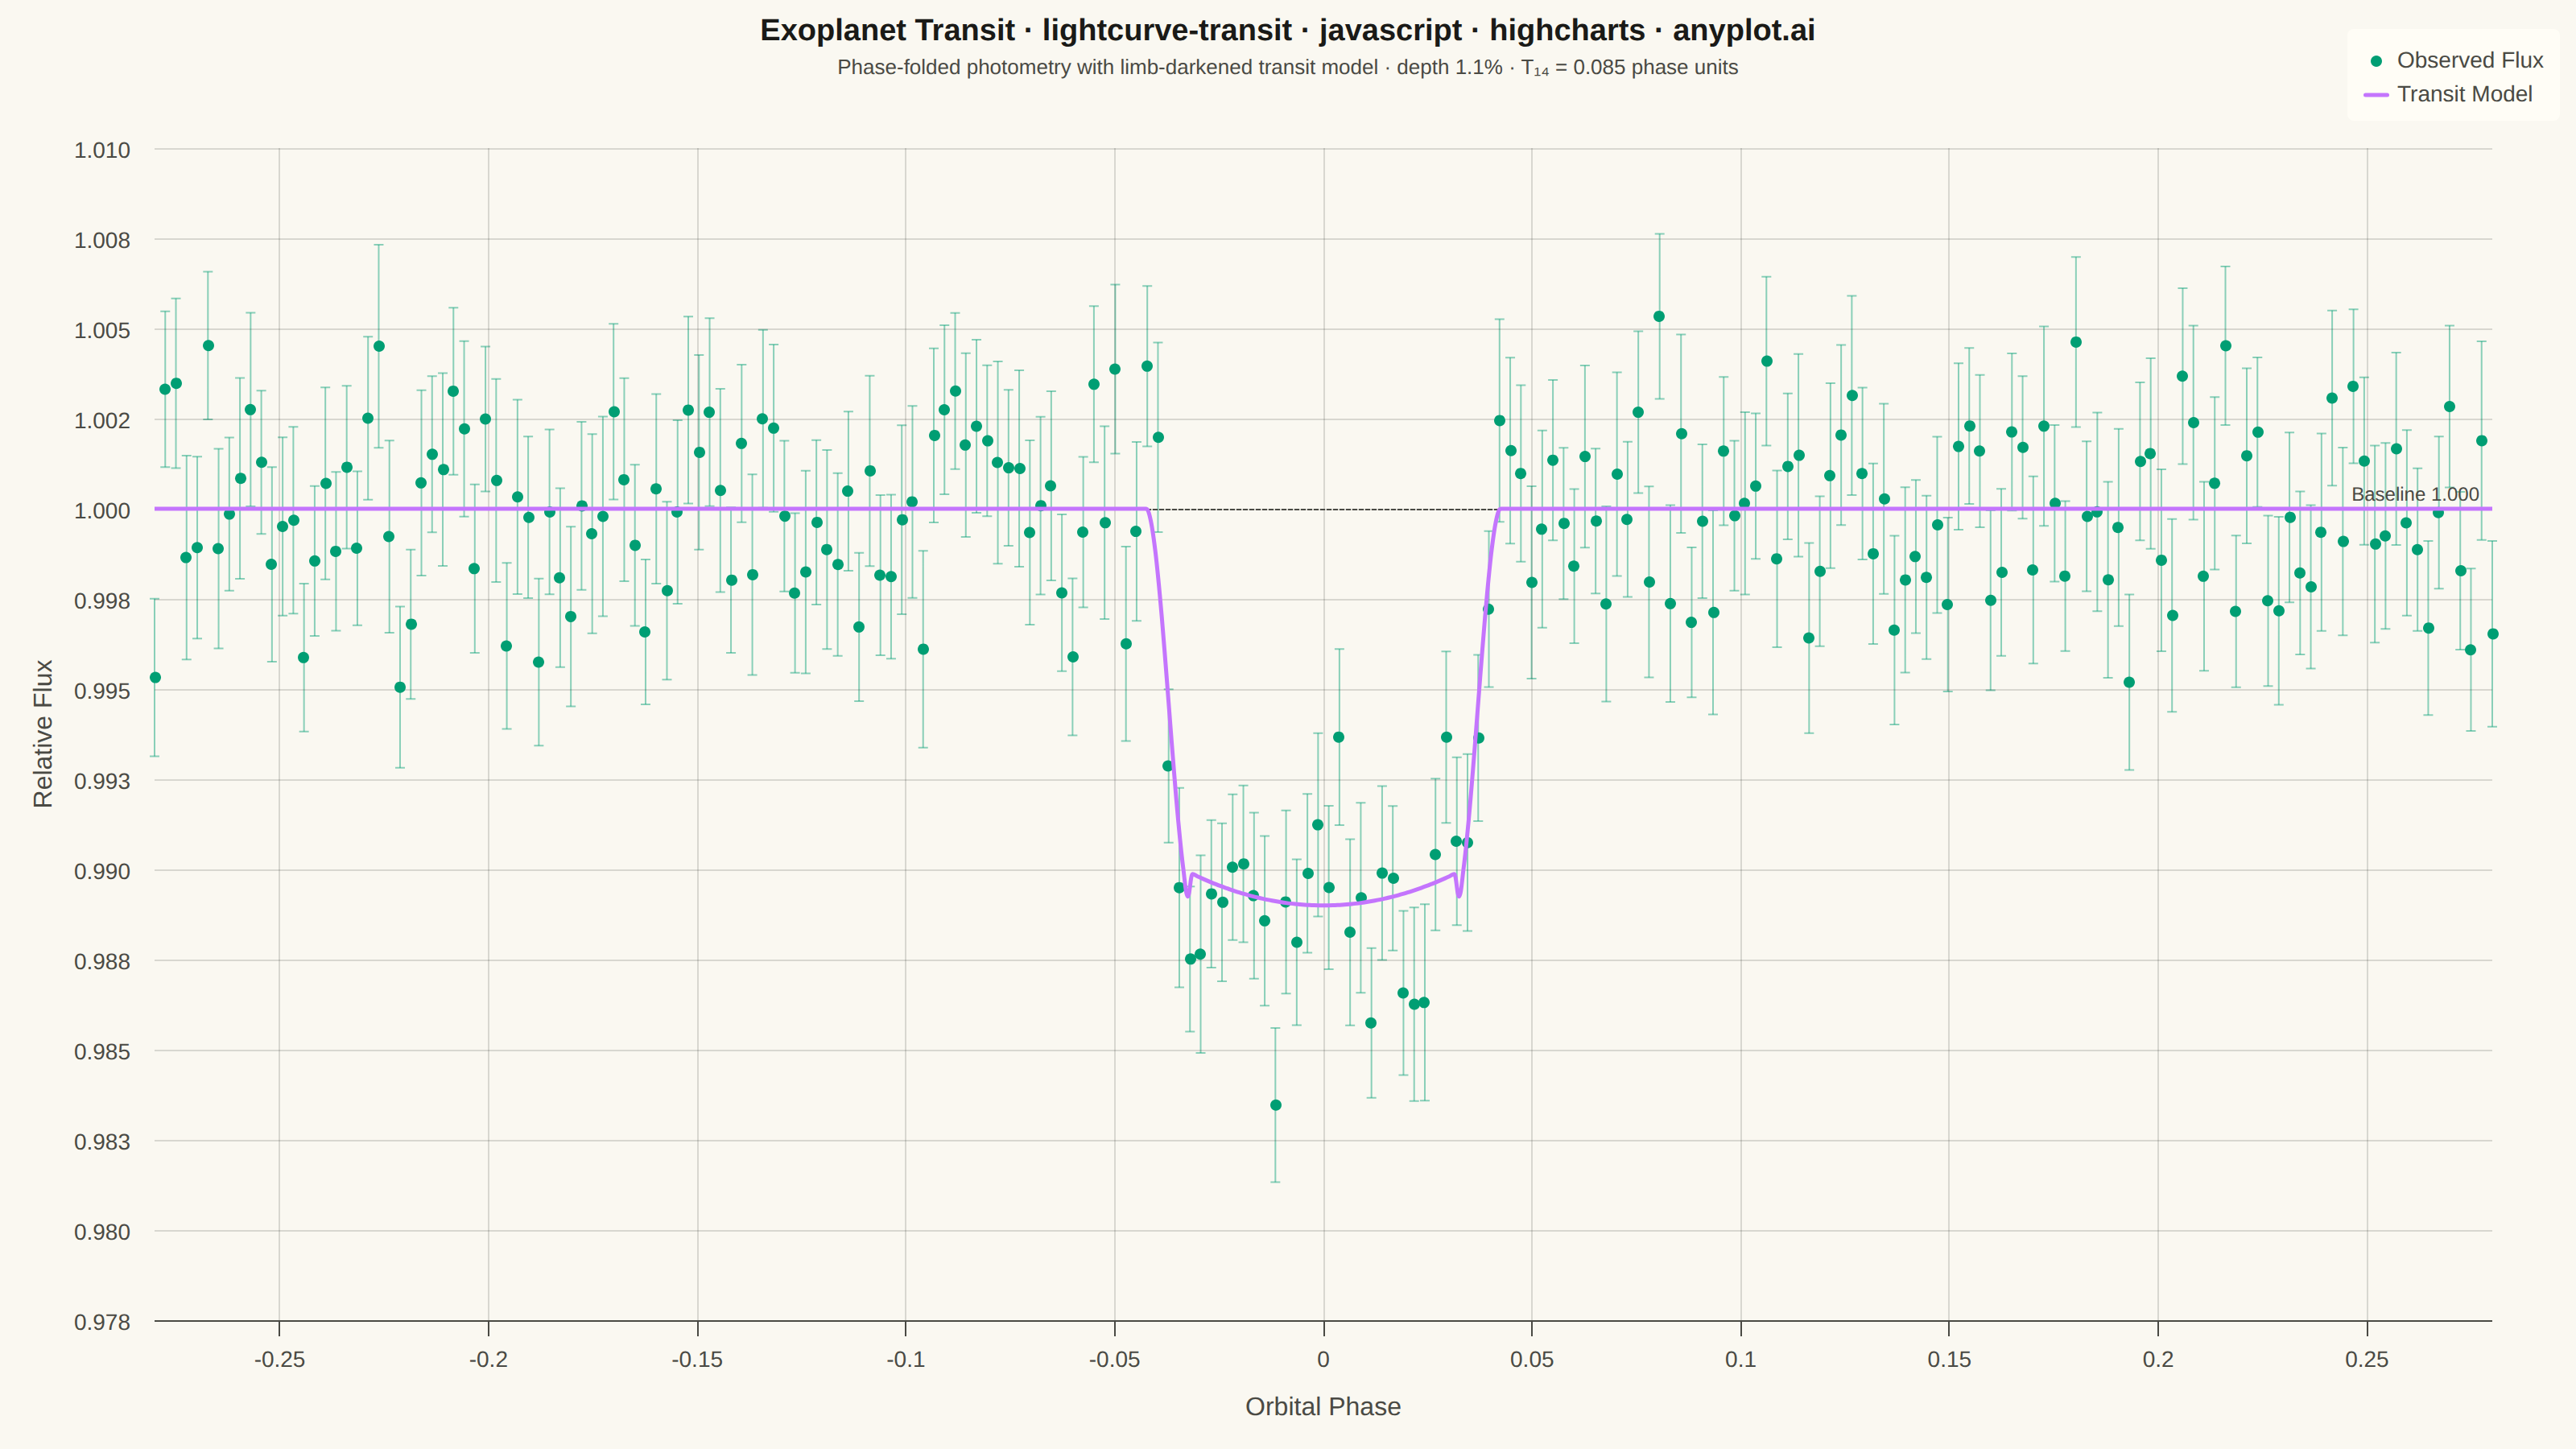
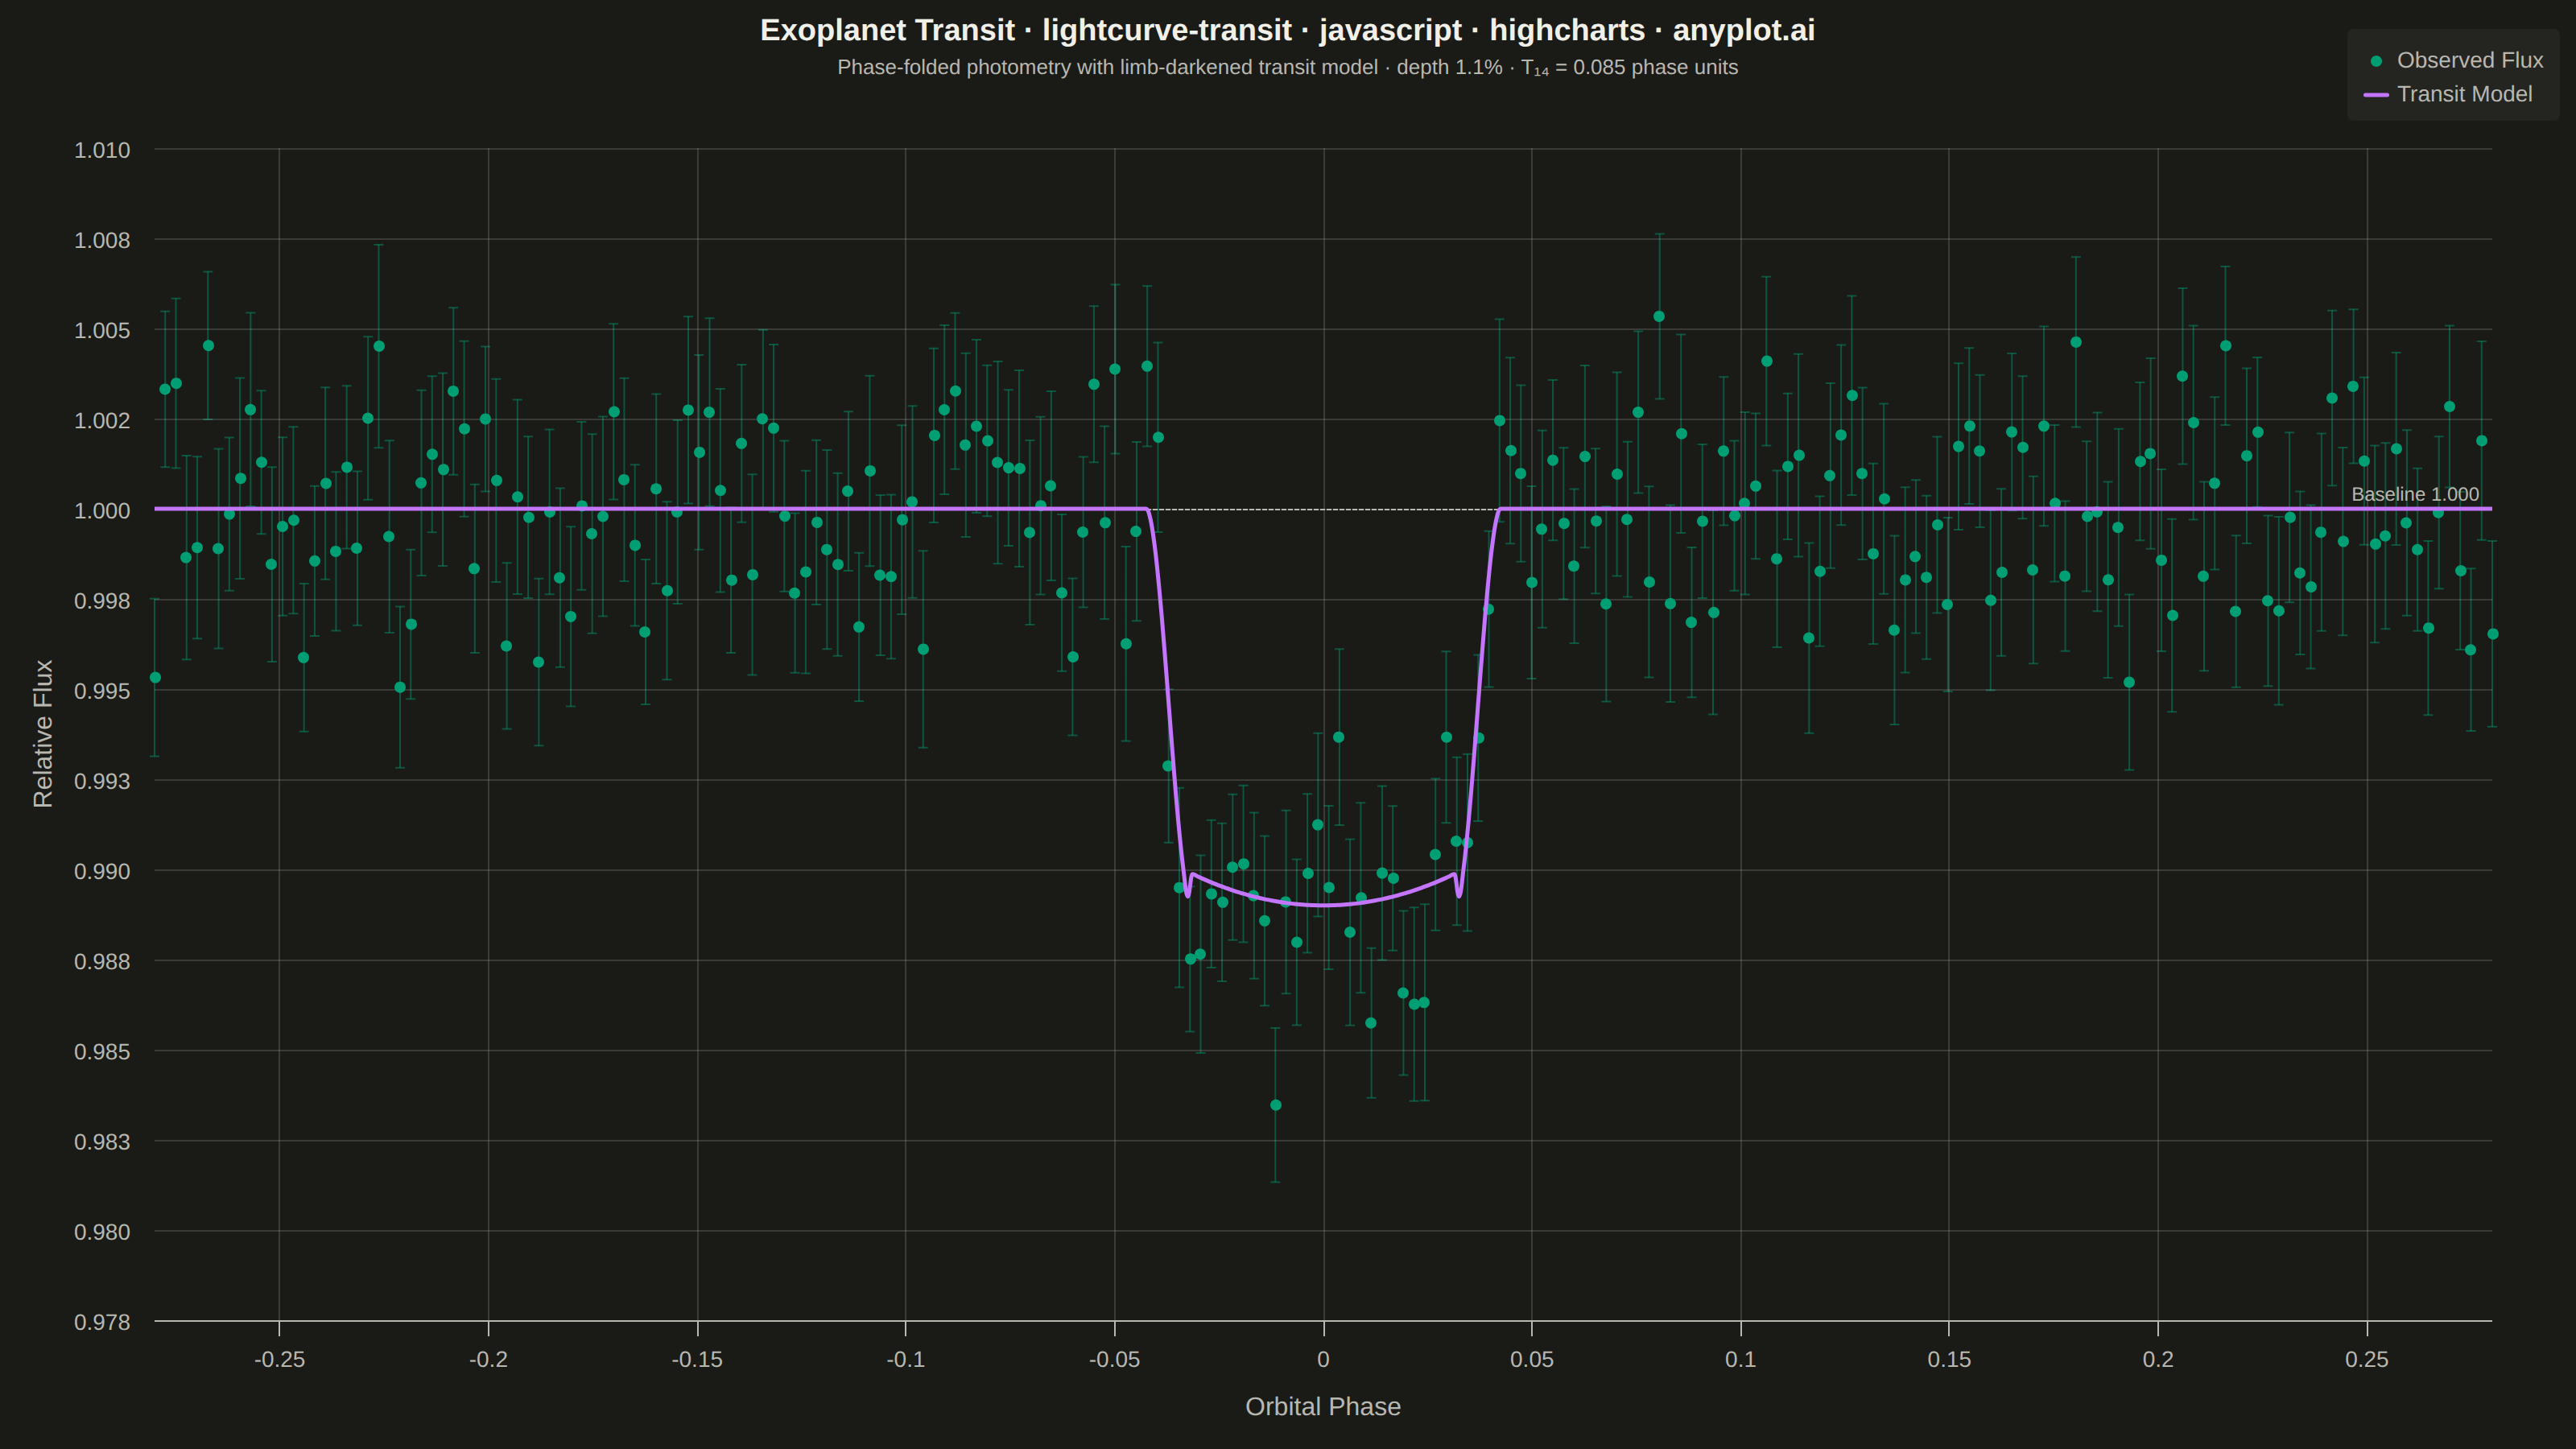
A time-series plot showing the brightness of an astronomical object over time, designed to reveal exoplanet transit events as characteristic dips in flux. The plot displays photometric measurements with error bars against time or orbital phase, with an optional fitted transit model overlay. This visualization is fundamental in observational astronomy for detecting and characterizing planetary transits, variable stars, and other periodic brightness variations.
// anyplot.ai
// lightcurve-transit: Astronomical Light Curve
// Library: highcharts 12.6.0 | JavaScript 22.22.3
// Quality: 89/100 | Created: 2026-06-20

//# anyplot-orientation: landscape

const t = window.ANYPLOT_TOKENS;

// Deterministic LCG — browser has no seeded RNG
let _rng = 42;
function rand() {
    _rng = (Math.imul(1664525, _rng) + 1013904223) >>> 0;
    return _rng / 4294967296;
}
function randn() {
    return Math.sqrt(-2 * Math.log(rand() + 1e-12)) * Math.cos(2 * Math.PI * rand());
}

// Transit model: simplified Mandel-Agol with smoothstep ingress and quadratic limb darkening
const DEPTH = 0.011;             // 1.1% fractional transit depth
const T14   = 0.085;             // total transit duration in phase units
const T23   = 0.063;             // flat-bottom (full occultation) duration
const T_ING = (T14 - T23) / 2;  // ingress / egress duration

function transitModel(ph) {
    const p = Math.abs(ph);
    if (p >= T14 / 2) return 1.0;
    if (p <= T23 / 2) {
        // Limb-darkening curve: slightly brighter at limb-center crossing
        const x = p / (T23 / 2);
        return 1.0 - DEPTH * (1.0 - 0.08 * x * x);
    }
    // Smoothstep ingress / egress
    const f = (p - T23 / 2) / T_ING;
    return 1.0 - DEPTH * (1.0 - f * f * (3.0 - 2.0 * f));
}

// 220 phase-folded photometric observations
const N      = 220;
const PH_MIN = -0.28;
const PH_MAX =  0.28;
const SIGMA  = 0.0024;  // typical photometric precision

const phases = [], fluxes = [], errs = [];
for (let i = 0; i < N; i++) {
    const ph  = PH_MIN + (PH_MAX - PH_MIN) * i / (N - 1);
    const err = SIGMA * (0.82 + 0.36 * rand());
    phases.push(ph);
    fluxes.push(transitModel(ph) + randn() * SIGMA);
    errs.push(err);
}

// Dense model curve for smooth spline overlay
const modelPts = [];
for (let i = 0; i <= 500; i++) {
    const ph = PH_MIN + (PH_MAX - PH_MIN) * i / 500;
    modelPts.push([ph, transitModel(ph)]);
}

// Y-axis range with padding
const allFlux = fluxes.concat(modelPts.map(d => d[1]));
const fMin = Math.min(...allFlux);
const fMax = Math.max(...allFlux);
const vPad = (fMax - fMin) * 0.20;

// Imprint palette — first series is always brand green
const obsColor = t.palette[0];  // #009E73 — observed photometry
const modColor = t.palette[1];  // #C475FD — fitted transit model

// Title length: 77 chars → fontSize = round(22 × 67/77) = 19px
const chart = Highcharts.chart("container", {
    chart: {
        backgroundColor: "transparent",
        animation: false,
        style: { fontFamily: "inherit" },
        marginTop: 92,
        marginBottom: 80,
        marginLeft: 96,
        marginRight: 52,
    },
    credits: { enabled: false },
    colors: t.palette,
    title: {
        text: "Exoplanet Transit · lightcurve-transit · javascript · highcharts · anyplot.ai",
        style: { color: t.ink, fontSize: "19px", fontWeight: "600" },
        margin: 6,
    },
    subtitle: {
        text: "Phase-folded photometry with limb-darkened transit model · depth 1.1% · T₁₄ = 0.085 phase units",
        style: { color: t.inkSoft, fontSize: "13px" },
    },
    xAxis: {
        min: PH_MIN,
        max: PH_MAX,
        title: {
            text: "Orbital Phase",
            style: { color: t.inkSoft, fontSize: "16px" },
            margin: 12,
        },
        labels: { style: { color: t.inkSoft, fontSize: "14px" } },
        lineColor: t.inkSoft,
        tickColor: t.inkSoft,
        gridLineColor: t.grid,
        gridLineWidth: 1,
    },
    yAxis: {
        min: fMin - vPad,
        max: fMax + vPad,
        title: {
            text: "Relative Flux",
            style: { color: t.inkSoft, fontSize: "16px" },
            margin: 14,
        },
        labels: {
            style: { color: t.inkSoft, fontSize: "14px" },
            formatter: function () { return this.value.toFixed(3); },
        },
        lineColor: t.inkSoft,
        tickColor: t.inkSoft,
        gridLineColor: t.grid,
        gridLineWidth: 1,
        plotLines: [{
            value: 1.0,
            color: t.inkSoft,
            dashStyle: "ShortDash",
            width: 1,
            zIndex: 2,
            label: {
                text: "Baseline 1.000",
                style: { color: t.inkSoft, fontSize: "12px" },
                align: "right",
                x: -8,
                y: -6,
            },
        }],
    },
    legend: {
        enabled: true,
        align: "right",
        verticalAlign: "top",
        layout: "vertical",
        itemStyle: { color: t.inkSoft, fontSize: "14px", fontWeight: "normal" },
        itemHoverStyle: { color: t.ink },
        backgroundColor: t.elevatedBg,
        borderRadius: 4,
        padding: 10,
        y: 8,
    },
    tooltip: { enabled: false },
    plotOptions: {
        series: { animation: false },
        scatter: {
            marker: {
                radius: 3.5,
                symbol: "circle",
                lineWidth: 0,
            },
            states: { hover: { enabled: false } },
        },
        spline: {
            lineWidth: 2.5,
            marker: { enabled: false },
            states: { hover: { enabled: false } },
        },
    },
    series: [
        {
            type: "scatter",
            name: "Observed Flux",
            color: obsColor,
            data: phases.map(function (ph, i) { return [ph, fluxes[i]]; }),
            zIndex: 2,
        },
        {
            type: "spline",
            name: "Transit Model",
            color: modColor,
            lineWidth: 2.5,
            data: modelPts,
            zIndex: 3,
            marker: { enabled: false },
        },
    ],
});

// Draw per-point error bars via SVG renderer — single combined path for efficiency
const xA  = chart.xAxis[0];
const yA  = chart.yAxis[0];
const ren = chart.renderer;
const CAP = 3;  // horizontal cap half-width in CSS px

const stems = [], caps = [];
phases.forEach(function (ph, i) {
    const flux = fluxes[i];
    const err  = errs[i];
    const px   = xA.toPixels(ph);
    const pyT  = yA.toPixels(flux + err);
    const pyB  = yA.toPixels(flux - err);

    stems.push("M", px, pyT, "L", px, pyB);
    caps.push(
        "M", px - CAP, pyT, "L", px + CAP, pyT,
        "M", px - CAP, pyB, "L", px + CAP, pyB
    );
});

const errGroup = ren.g("error-bars").add();
ren.path(stems)
    .attr({ stroke: obsColor, "stroke-width": 1, opacity: 0.45 })
    .add(errGroup);
ren.path(caps)
    .attr({ stroke: obsColor, "stroke-width": 1, opacity: 0.45 })
    .add(errGroup);
Runnable source as JSON, for any HTTP client: https://api.anyplot.ai/specs/lightcurve-transit/highcharts/code. Any spec id and library id listed in llms-full.txt fit the same URL shape; every URL below is complete and callable.
{
  "spec_id": "lightcurve-transit",
  "language": "javascript",
  "library": "highcharts",
  "page": "https://anyplot.ai/lightcurve-transit/javascript/highcharts",
  "hub": "https://anyplot.ai/lightcurve-transit",
  "code_json": "https://api.anyplot.ai/specs/lightcurve-transit/highcharts/code",
  "spec_json": "https://api.anyplot.ai/specs/lightcurve-transit",
  "render_light_png": "https://storage.googleapis.com/anyplot-images/plots/lightcurve-transit/javascript/highcharts/plot-light.png",
  "render_dark_png": "https://storage.googleapis.com/anyplot-images/plots/lightcurve-transit/javascript/highcharts/plot-dark.png",
  "interactive_light_html": "https://storage.googleapis.com/anyplot-images/plots/lightcurve-transit/javascript/highcharts/plot-light.html",
  "interactive_dark_html": "https://storage.googleapis.com/anyplot-images/plots/lightcurve-transit/javascript/highcharts/plot-dark.html",
  "quality_score": 89.0,
  "license": "MIT",
  "guide": "https://anyplot.ai/llms.txt"
}
Part of Astronomical Light Curve on anyplot.ai.