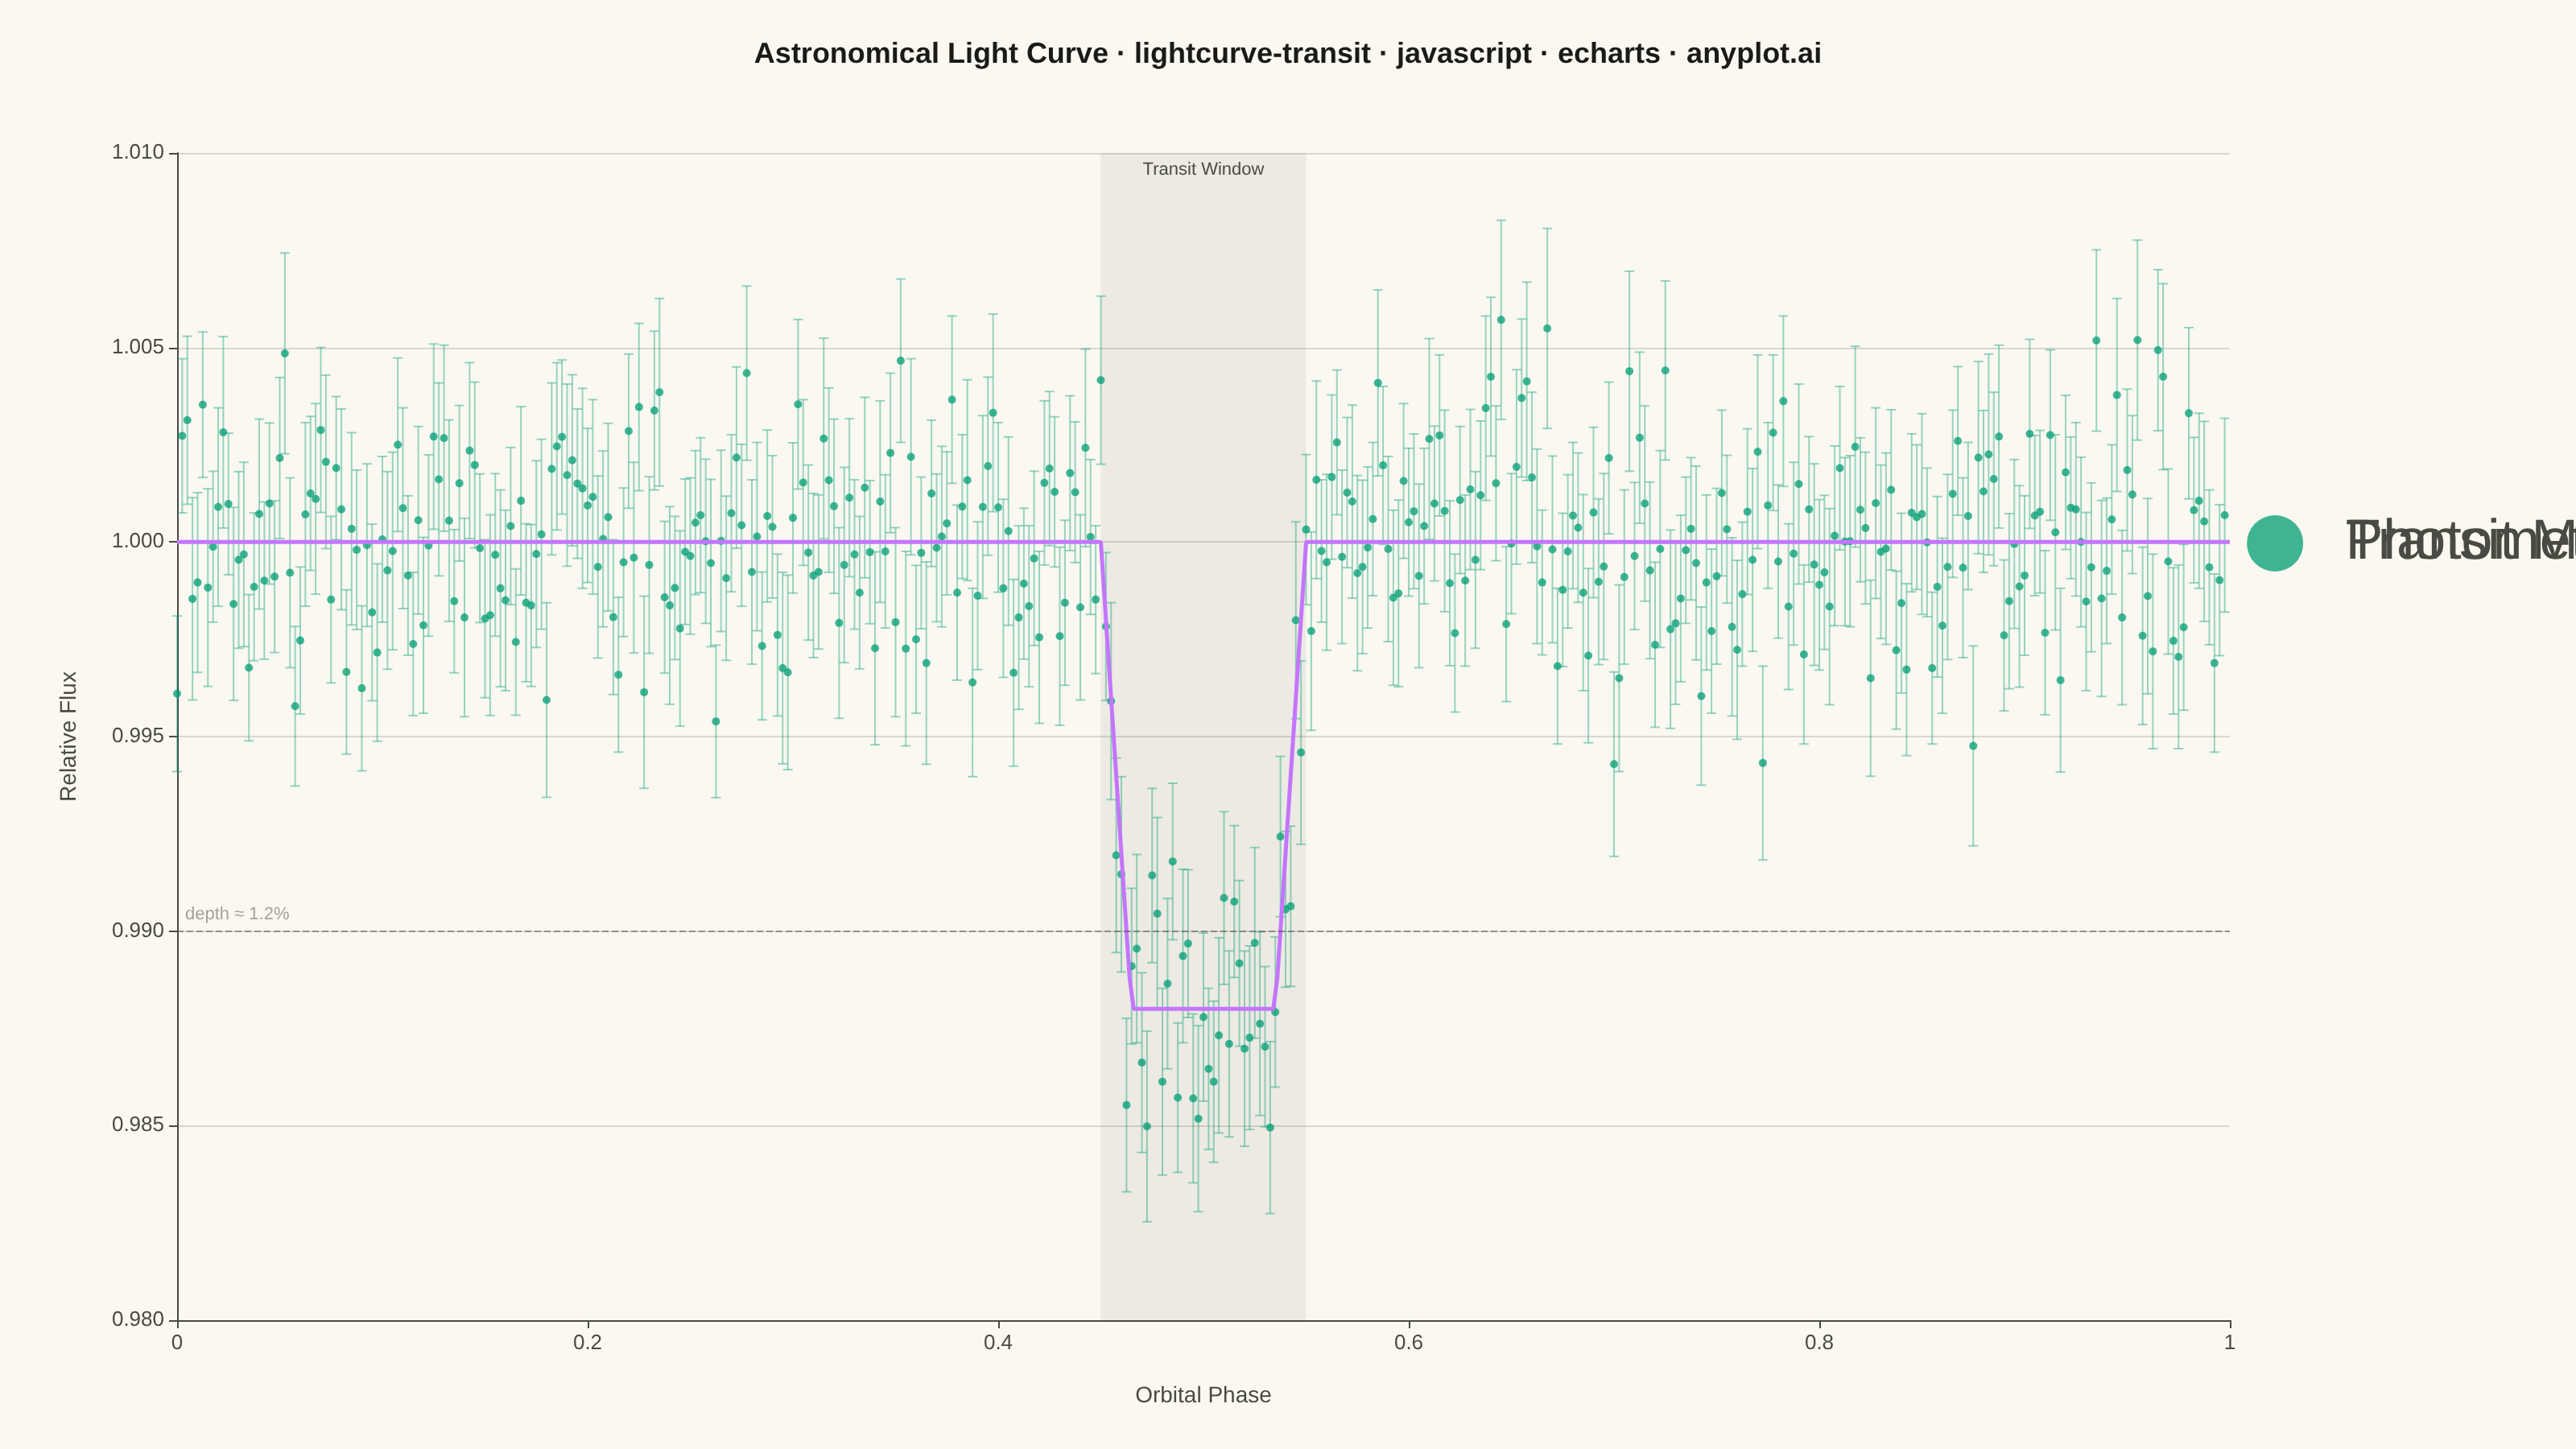
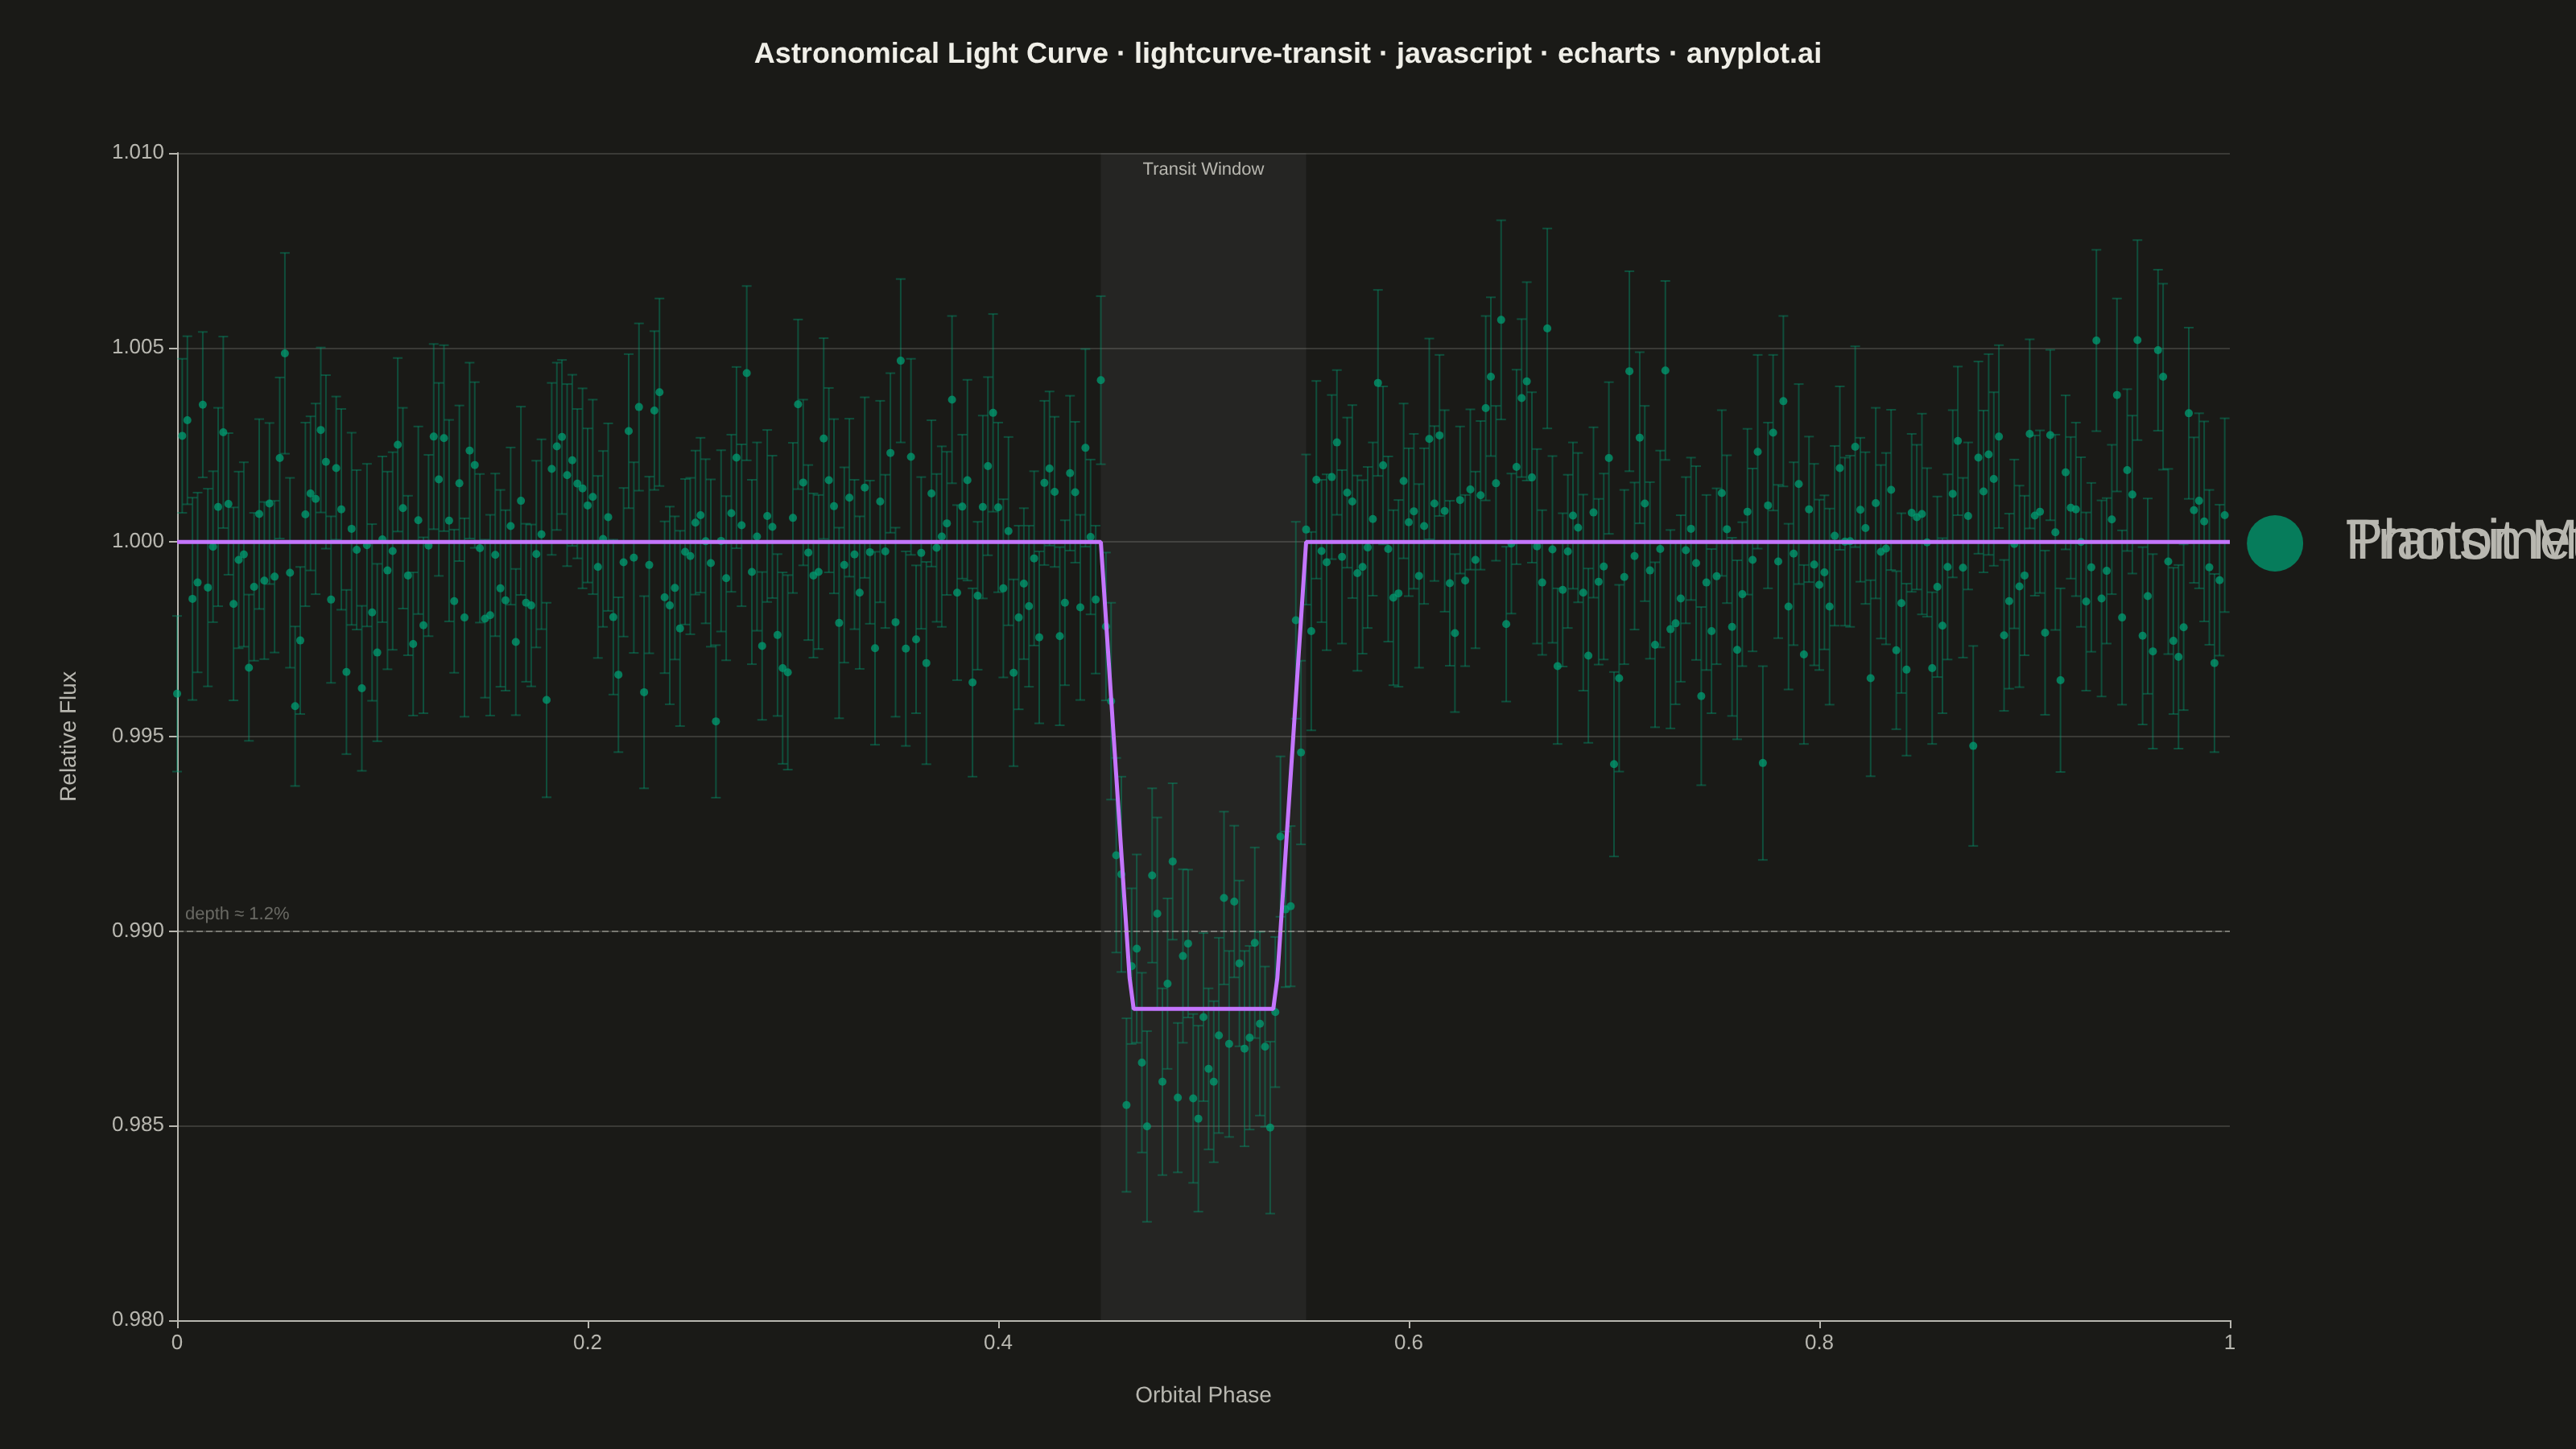
A time-series plot showing the brightness of an astronomical object over time, designed to reveal exoplanet transit events as characteristic dips in flux. The plot displays photometric measurements with error bars against time or orbital phase, with an optional fitted transit model overlay. This visualization is fundamental in observational astronomy for detecting and characterizing planetary transits, variable stars, and other periodic brightness variations.
// anyplot.ai
// lightcurve-transit: Astronomical Light Curve
// Library: echarts 5.5.1 | JavaScript 22.22.3
// Quality: 86/100 | Created: 2026-06-20

//# anyplot-orientation: landscape

const t = window.ANYPLOT_TOKENS;

// --- Data (deterministic LCG) -----------------------------------------------
let seed = 42;
function lcg() {
    seed = (seed * 1664525 + 1013904223) >>> 0;
    return seed / 0x100000000;
}
function randn() {
    const u1 = Math.max(lcg(), 1e-10);
    const u2 = lcg();
    return Math.sqrt(-2 * Math.log(u1)) * Math.cos(2 * Math.PI * u2);
}

function transitModel(phase) {
    const depth = 0.012, center = 0.5, halfDur = 0.05, halfFlat = 0.035;
    const d = Math.abs(phase - center);
    if (d >= halfDur) return 1.0;
    if (d <= halfFlat) return 1.0 - depth;
    return 1.0 - depth * (halfDur - d) / (halfDur - halfFlat);
}

const N = 400;
const scatterData = [];
const errorData = [];

for (let i = 0; i < N; i++) {
    const phase = i / N;
    const model = transitModel(phase);
    const err = 0.0018 + lcg() * 0.0008;
    const flux = model + randn() * err;
    scatterData.push([phase, +flux.toFixed(5)]);
    errorData.push([phase, +flux.toFixed(5), +err.toFixed(5)]);
}

const modelCurve = [];
for (let i = 0; i <= 500; i++) {
    const phase = i / 500;
    modelCurve.push([phase, +transitModel(phase).toFixed(5)]);
}

// --- Init -------------------------------------------------------------------
const chart = echarts.init(document.getElementById("container"));

// --- Option -----------------------------------------------------------------
chart.setOption({
    animation: false,
    color: t.palette,
    backgroundColor: "transparent",
    title: {
        text: "Astronomical Light Curve · lightcurve-transit · javascript · echarts · anyplot.ai",
        left: "center",
        top: 20,
        textStyle: { color: t.ink, fontSize: 18 }
    },
    legend: {
        right: 80,
        top: 75,
        orient: "vertical",
        textStyle: { color: t.inkSoft, fontSize: 14 },
        itemGap: 14,
        backgroundColor: t.elevatedBg,
        borderColor: t.grid,
        borderWidth: 1,
        padding: [10, 16],
        data: [
            { name: "Photometry", icon: "circle" },
            { name: "Transit Model", icon: "path://M0,8 L30,8" }
        ]
    },
    grid: { left: 110, right: 215, top: 95, bottom: 80 },
    xAxis: {
        type: "value",
        name: "Orbital Phase",
        nameLocation: "middle",
        nameGap: 40,
        nameTextStyle: { color: t.inkSoft, fontSize: 14 },
        min: 0,
        max: 1,
        axisLabel: { color: t.inkSoft, fontSize: 13 },
        axisLine: { lineStyle: { color: t.inkSoft } },
        axisTick: { lineStyle: { color: t.inkSoft } },
        splitLine: { show: false }
    },
    yAxis: {
        type: "value",
        name: "Relative Flux",
        nameLocation: "middle",
        nameGap: 60,
        nameTextStyle: { color: t.inkSoft, fontSize: 14 },
        scale: true,
        axisLabel: {
            color: t.inkSoft,
            fontSize: 13,
            formatter: v => v.toFixed(3)
        },
        axisLine: { lineStyle: { color: t.inkSoft } },
        axisTick: { lineStyle: { color: t.inkSoft } },
        splitLine: { lineStyle: { color: t.grid } }
    },
    series: [
        {
            type: "custom",
            silent: true,
            z: 2,
            data: errorData,
            renderItem(params, api) {
                const cx = api.coord([api.value(0), api.value(1)]);
                const top = api.coord([api.value(0), api.value(1) + api.value(2)]);
                const bot = api.coord([api.value(0), api.value(1) - api.value(2)]);
                const cap = 3;
                return {
                    type: "group",
                    children: [
                        {
                            type: "line",
                            shape: { x1: cx[0], y1: top[1], x2: cx[0], y2: bot[1] },
                            style: { stroke: t.palette[0], lineWidth: 1, opacity: 0.4 }
                        },
                        {
                            type: "line",
                            shape: { x1: cx[0] - cap, y1: top[1], x2: cx[0] + cap, y2: top[1] },
                            style: { stroke: t.palette[0], lineWidth: 1, opacity: 0.4 }
                        },
                        {
                            type: "line",
                            shape: { x1: cx[0] - cap, y1: bot[1], x2: cx[0] + cap, y2: bot[1] },
                            style: { stroke: t.palette[0], lineWidth: 1, opacity: 0.4 }
                        }
                    ]
                };
            }
        },
        {
            type: "scatter",
            name: "Photometry",
            data: scatterData,
            symbol: "circle",
            symbolSize: 5,
            itemStyle: { color: t.palette[0], opacity: 0.75 },
            z: 3,
            markArea: {
                silent: true,
                z: 1,
                itemStyle: { color: t.inkSoft, opacity: 0.08 },
                label: {
                    show: true,
                    position: "insideTop",
                    formatter: "Transit Window",
                    color: t.inkSoft,
                    fontSize: 11
                },
                data: [[{ xAxis: 0.45 }, { xAxis: 0.55 }]]
            },
            markLine: {
                silent: true,
                symbol: "none",
                lineStyle: { color: t.inkSoft, type: "dashed", width: 1, opacity: 0.5 },
                label: {
                    position: "insideStartTop",
                    formatter: "depth ≈ 1.2%",
                    color: t.inkSoft,
                    fontSize: 11
                },
                data: [{ yAxis: 0.988 }]
            }
        },
        {
            type: "line",
            name: "Transit Model",
            data: modelCurve,
            symbol: "none",
            lineStyle: { color: t.palette[1], width: 2.5 },
            z: 4
        }
    ]
});
Runnable source as JSON, for any HTTP client: https://api.anyplot.ai/specs/lightcurve-transit/echarts/code. Any spec id and library id listed in llms-full.txt fit the same URL shape; every URL below is complete and callable.
{
  "spec_id": "lightcurve-transit",
  "language": "javascript",
  "library": "echarts",
  "page": "https://anyplot.ai/lightcurve-transit/javascript/echarts",
  "hub": "https://anyplot.ai/lightcurve-transit",
  "code_json": "https://api.anyplot.ai/specs/lightcurve-transit/echarts/code",
  "spec_json": "https://api.anyplot.ai/specs/lightcurve-transit",
  "render_light_png": "https://storage.googleapis.com/anyplot-images/plots/lightcurve-transit/javascript/echarts/plot-light.png",
  "render_dark_png": "https://storage.googleapis.com/anyplot-images/plots/lightcurve-transit/javascript/echarts/plot-dark.png",
  "interactive_light_html": "https://storage.googleapis.com/anyplot-images/plots/lightcurve-transit/javascript/echarts/plot-light.html",
  "interactive_dark_html": "https://storage.googleapis.com/anyplot-images/plots/lightcurve-transit/javascript/echarts/plot-dark.html",
  "quality_score": 86.0,
  "license": "MIT",
  "guide": "https://anyplot.ai/llms.txt"
}
Part of Astronomical Light Curve on anyplot.ai.