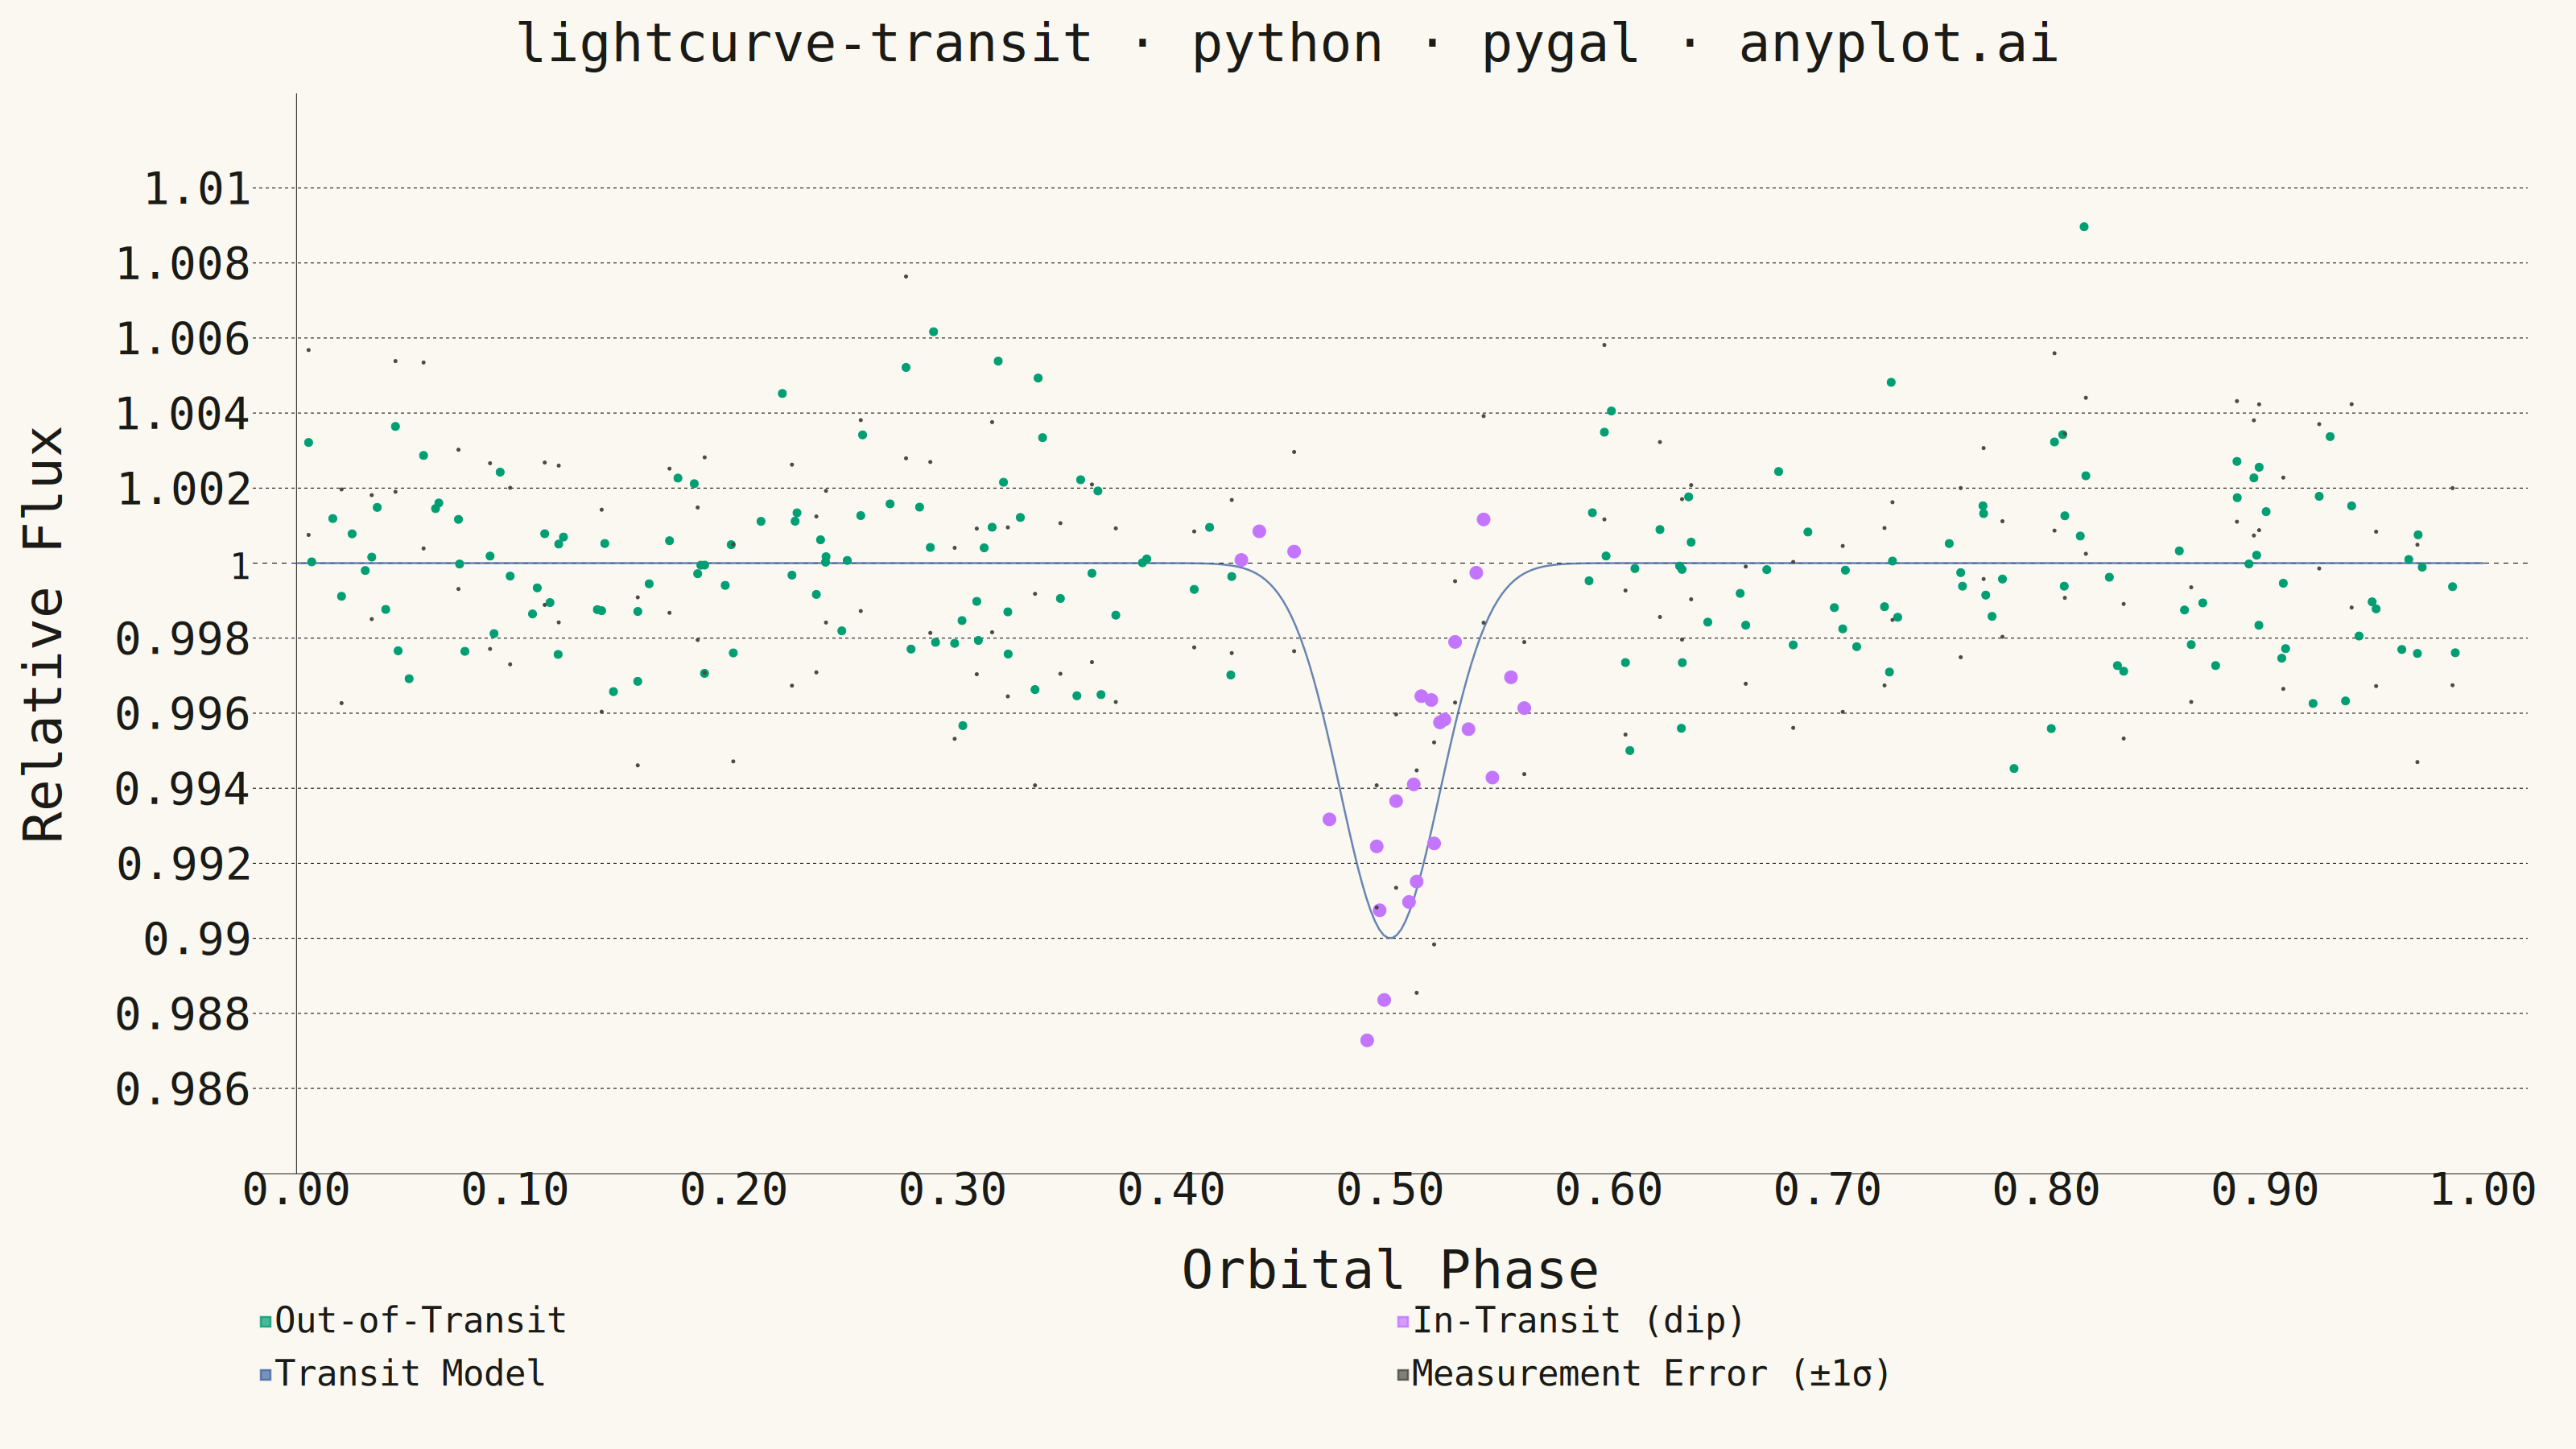
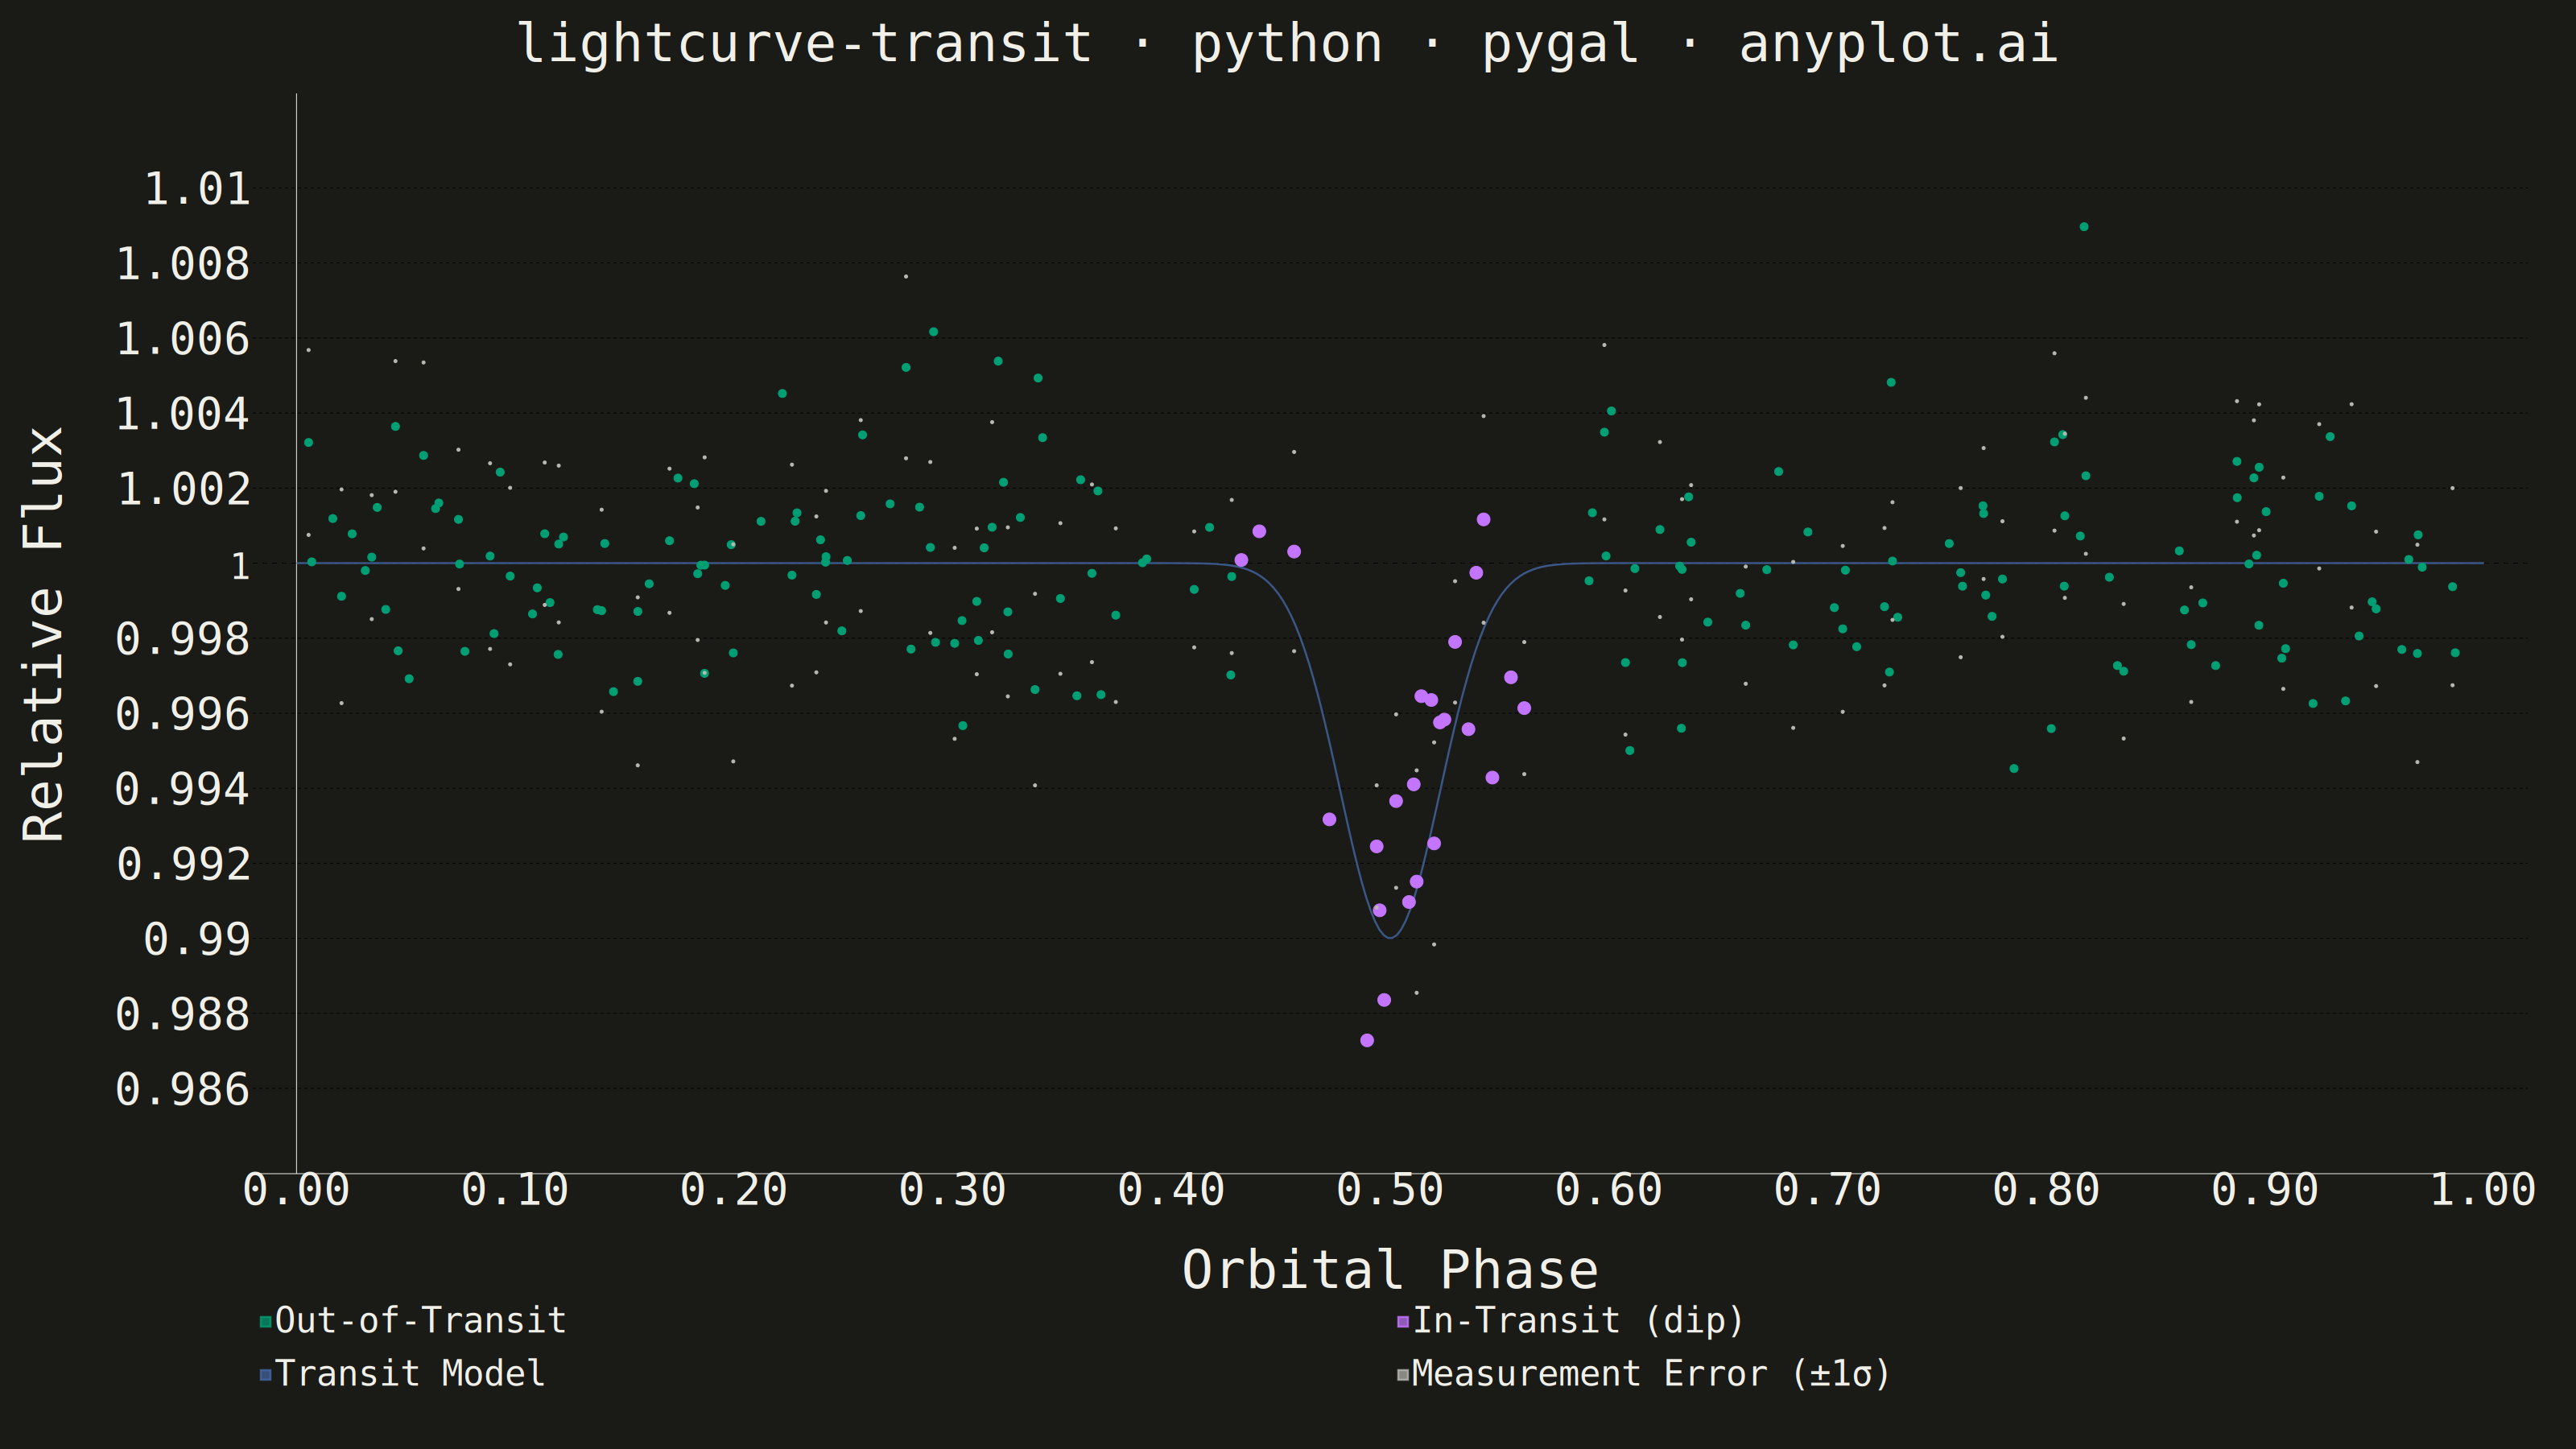
A time-series plot showing the brightness of an astronomical object over time, designed to reveal exoplanet transit events as characteristic dips in flux. The plot displays photometric measurements with error bars against time or orbital phase, with an optional fitted transit model overlay. This visualization is fundamental in observational astronomy for detecting and characterizing planetary transits, variable stars, and other periodic brightness variations.
""" anyplot.ai
lightcurve-transit: Astronomical Light Curve
Library: pygal 3.1.3 | Python 3.13.14
Quality: 82/100 | Updated: 2026-06-20
"""

import os

import numpy as np
import pygal
from pygal.style import Style


# Theme tokens (Imprint palette — theme-adaptive chrome)
THEME = os.getenv("ANYPLOT_THEME", "light")
PAGE_BG = "#FAF8F1" if THEME == "light" else "#1A1A17"
INK = "#1A1A17" if THEME == "light" else "#F0EFE8"
INK_SOFT = "#4A4A44" if THEME == "light" else "#B8B7B0"
INK_MUTED = "#6B6A63" if THEME == "light" else "#A8A79F"

# Data — simulated exoplanet transit (phase-folded, Kepler-style)
np.random.seed(42)

n_points = 200
phase = np.sort(np.random.uniform(0.0, 1.0, n_points))

transit_center = 0.5
transit_duration = 0.08
transit_depth = 0.01

# Limb-darkened transit model (Gaussian approximation)
model_phase = np.linspace(0.0, 1.0, 500)
sigma = transit_duration / 3.5
model_flux_curve = 1.0 - transit_depth * np.exp(-0.5 * ((model_phase - transit_center) / sigma) ** 2)

model_flux = np.interp(phase, model_phase, model_flux_curve)
flux_err = np.random.uniform(0.0015, 0.003, n_points)
flux = model_flux + np.random.normal(0, 1, n_points) * flux_err

in_transit = np.abs(phase - transit_center) < 3 * sigma

# Scatter data points split by transit status
out_transit_points = []
in_transit_points = []
for i in range(n_points):
    pt = {
        "value": (round(float(phase[i]), 5), round(float(flux[i]), 6)),
        "label": f"φ={phase[i]:.3f}  F={flux[i]:.4f}±{flux_err[i]:.4f}",
    }
    if in_transit[i]:
        in_transit_points.append(pt)
    else:
        out_transit_points.append(pt)

# Error bar caps — sampled every 3rd point to reduce visual clutter (±1σ endpoint dots)
err_cap_points = []
for i in range(0, n_points, 3):
    x = round(float(phase[i]), 5)
    err_cap_points.append(
        {"value": (x, round(float(flux[i] - flux_err[i]), 6)), "label": f"φ={phase[i]:.3f}  σ={flux_err[i]:.4f}"}
    )
    err_cap_points.append(
        {"value": (x, round(float(flux[i] + flux_err[i]), 6)), "label": f"φ={phase[i]:.3f}  σ={flux_err[i]:.4f}"}
    )

# Dense model curve for smooth transit shape
model_points = [
    (round(float(model_phase[i]), 5), round(float(model_flux_curve[i]), 6)) for i in range(len(model_phase))
]

# Style — Imprint palette, canonical order; error caps use INK_SOFT (secondary anchor)
title_str = "lightcurve-transit · python · pygal · anyplot.ai"
n = len(title_str)
default_title_fs = 66
title_fs = max(44, round(default_title_fs * 67 / n)) if n > 67 else default_title_fs

custom_style = Style(
    background=PAGE_BG,
    plot_background=PAGE_BG,
    foreground=INK,
    foreground_strong=INK,
    foreground_subtle=INK_MUTED,
    colors=("#009E73", "#C475FD", "#4467A3", INK_SOFT),
    title_font_size=title_fs,
    label_font_size=56,
    major_label_font_size=44,
    legend_font_size=44,
    value_font_size=36,
    stroke_width=2.5,
)

# Plot
flux_min = float(np.min(flux)) - 0.003
flux_max = float(np.max(flux)) + 0.003

chart = pygal.XY(
    style=custom_style,
    width=3200,
    height=1800,
    title=title_str,
    x_title="Orbital Phase",
    y_title="Relative Flux",
    show_x_guides=False,
    show_y_guides=True,
    dots_size=5,
    range=(flux_min, flux_max),
    xrange=(0.0, 1.0),
    margin_right=60,
    margin_left=60,
    margin_top=40,
    margin_bottom=80,
    legend_at_bottom=True,
    legend_at_bottom_columns=2,
    tooltip_border_radius=8,
    x_value_formatter=lambda x: f"{x:.2f}",
    y_value_formatter=lambda y: f"{y:.4f}",
)

# Out-of-transit observations — Imprint position 1 (#009E73)
chart.add("Out-of-Transit", out_transit_points, stroke=False, dots_size=5)

# In-transit observations — Imprint position 2 (#C475FD), larger for emphasis
chart.add("In-Transit (dip)", in_transit_points, stroke=False, dots_size=8)

# Best-fit transit model — Imprint position 3 (#4467A3), smooth line
chart.add("Transit Model", model_points, stroke=True, show_dots=False, stroke_width=5)

# Measurement error bounds (±1σ) — INK_SOFT secondary; small dots, sampled for clarity
chart.add("Measurement Error (±1σ)", err_cap_points, stroke=False, dots_size=2)

# Save
chart.render_to_png(f"plot-{THEME}.png")
with open(f"plot-{THEME}.html", "wb") as f:
    f.write(chart.render())
Runnable source as JSON, for any HTTP client: https://api.anyplot.ai/specs/lightcurve-transit/pygal/code. Any spec id and library id listed in llms-full.txt fit the same URL shape; every URL below is complete and callable.
{
  "spec_id": "lightcurve-transit",
  "language": "python",
  "library": "pygal",
  "page": "https://anyplot.ai/lightcurve-transit/python/pygal",
  "hub": "https://anyplot.ai/lightcurve-transit",
  "code_json": "https://api.anyplot.ai/specs/lightcurve-transit/pygal/code",
  "spec_json": "https://api.anyplot.ai/specs/lightcurve-transit",
  "render_light_png": "https://storage.googleapis.com/anyplot-images/plots/lightcurve-transit/python/pygal/plot-light.png",
  "render_dark_png": "https://storage.googleapis.com/anyplot-images/plots/lightcurve-transit/python/pygal/plot-dark.png",
  "interactive_light_html": "https://storage.googleapis.com/anyplot-images/plots/lightcurve-transit/python/pygal/plot-light.html",
  "interactive_dark_html": "https://storage.googleapis.com/anyplot-images/plots/lightcurve-transit/python/pygal/plot-dark.html",
  "quality_score": 82.0,
  "license": "MIT",
  "guide": "https://anyplot.ai/llms.txt"
}
Part of Astronomical Light Curve on anyplot.ai.