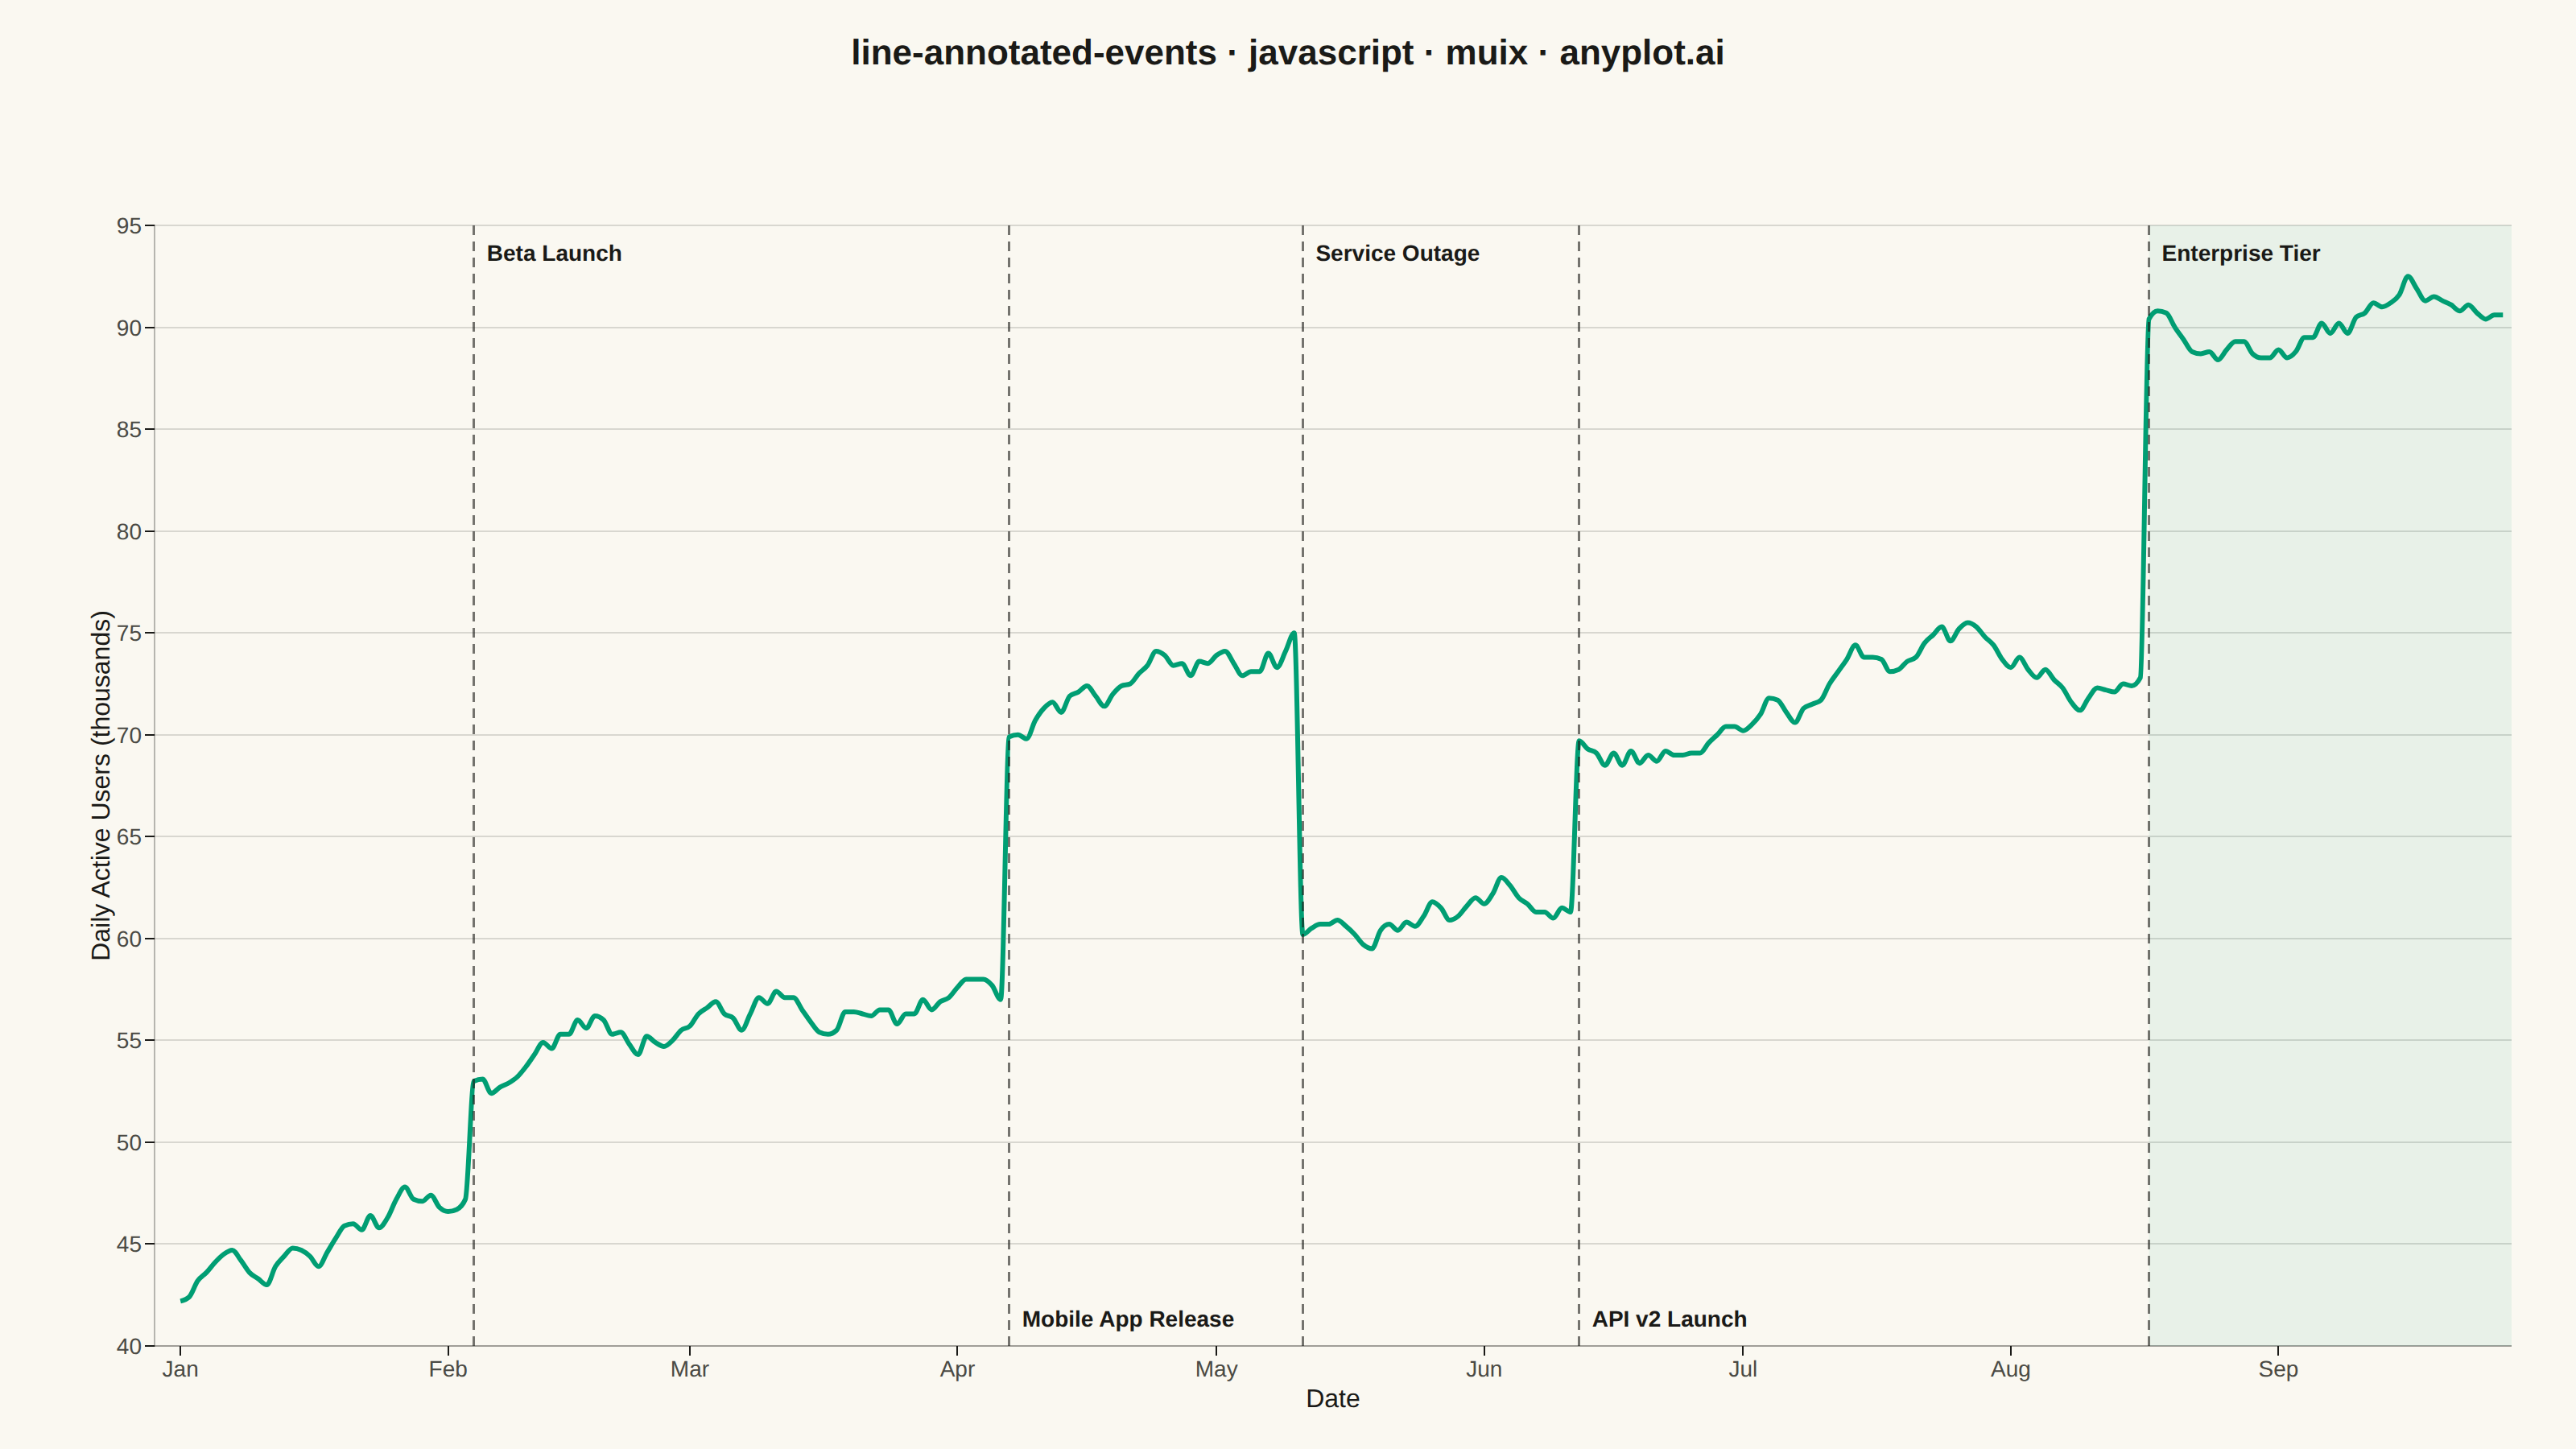
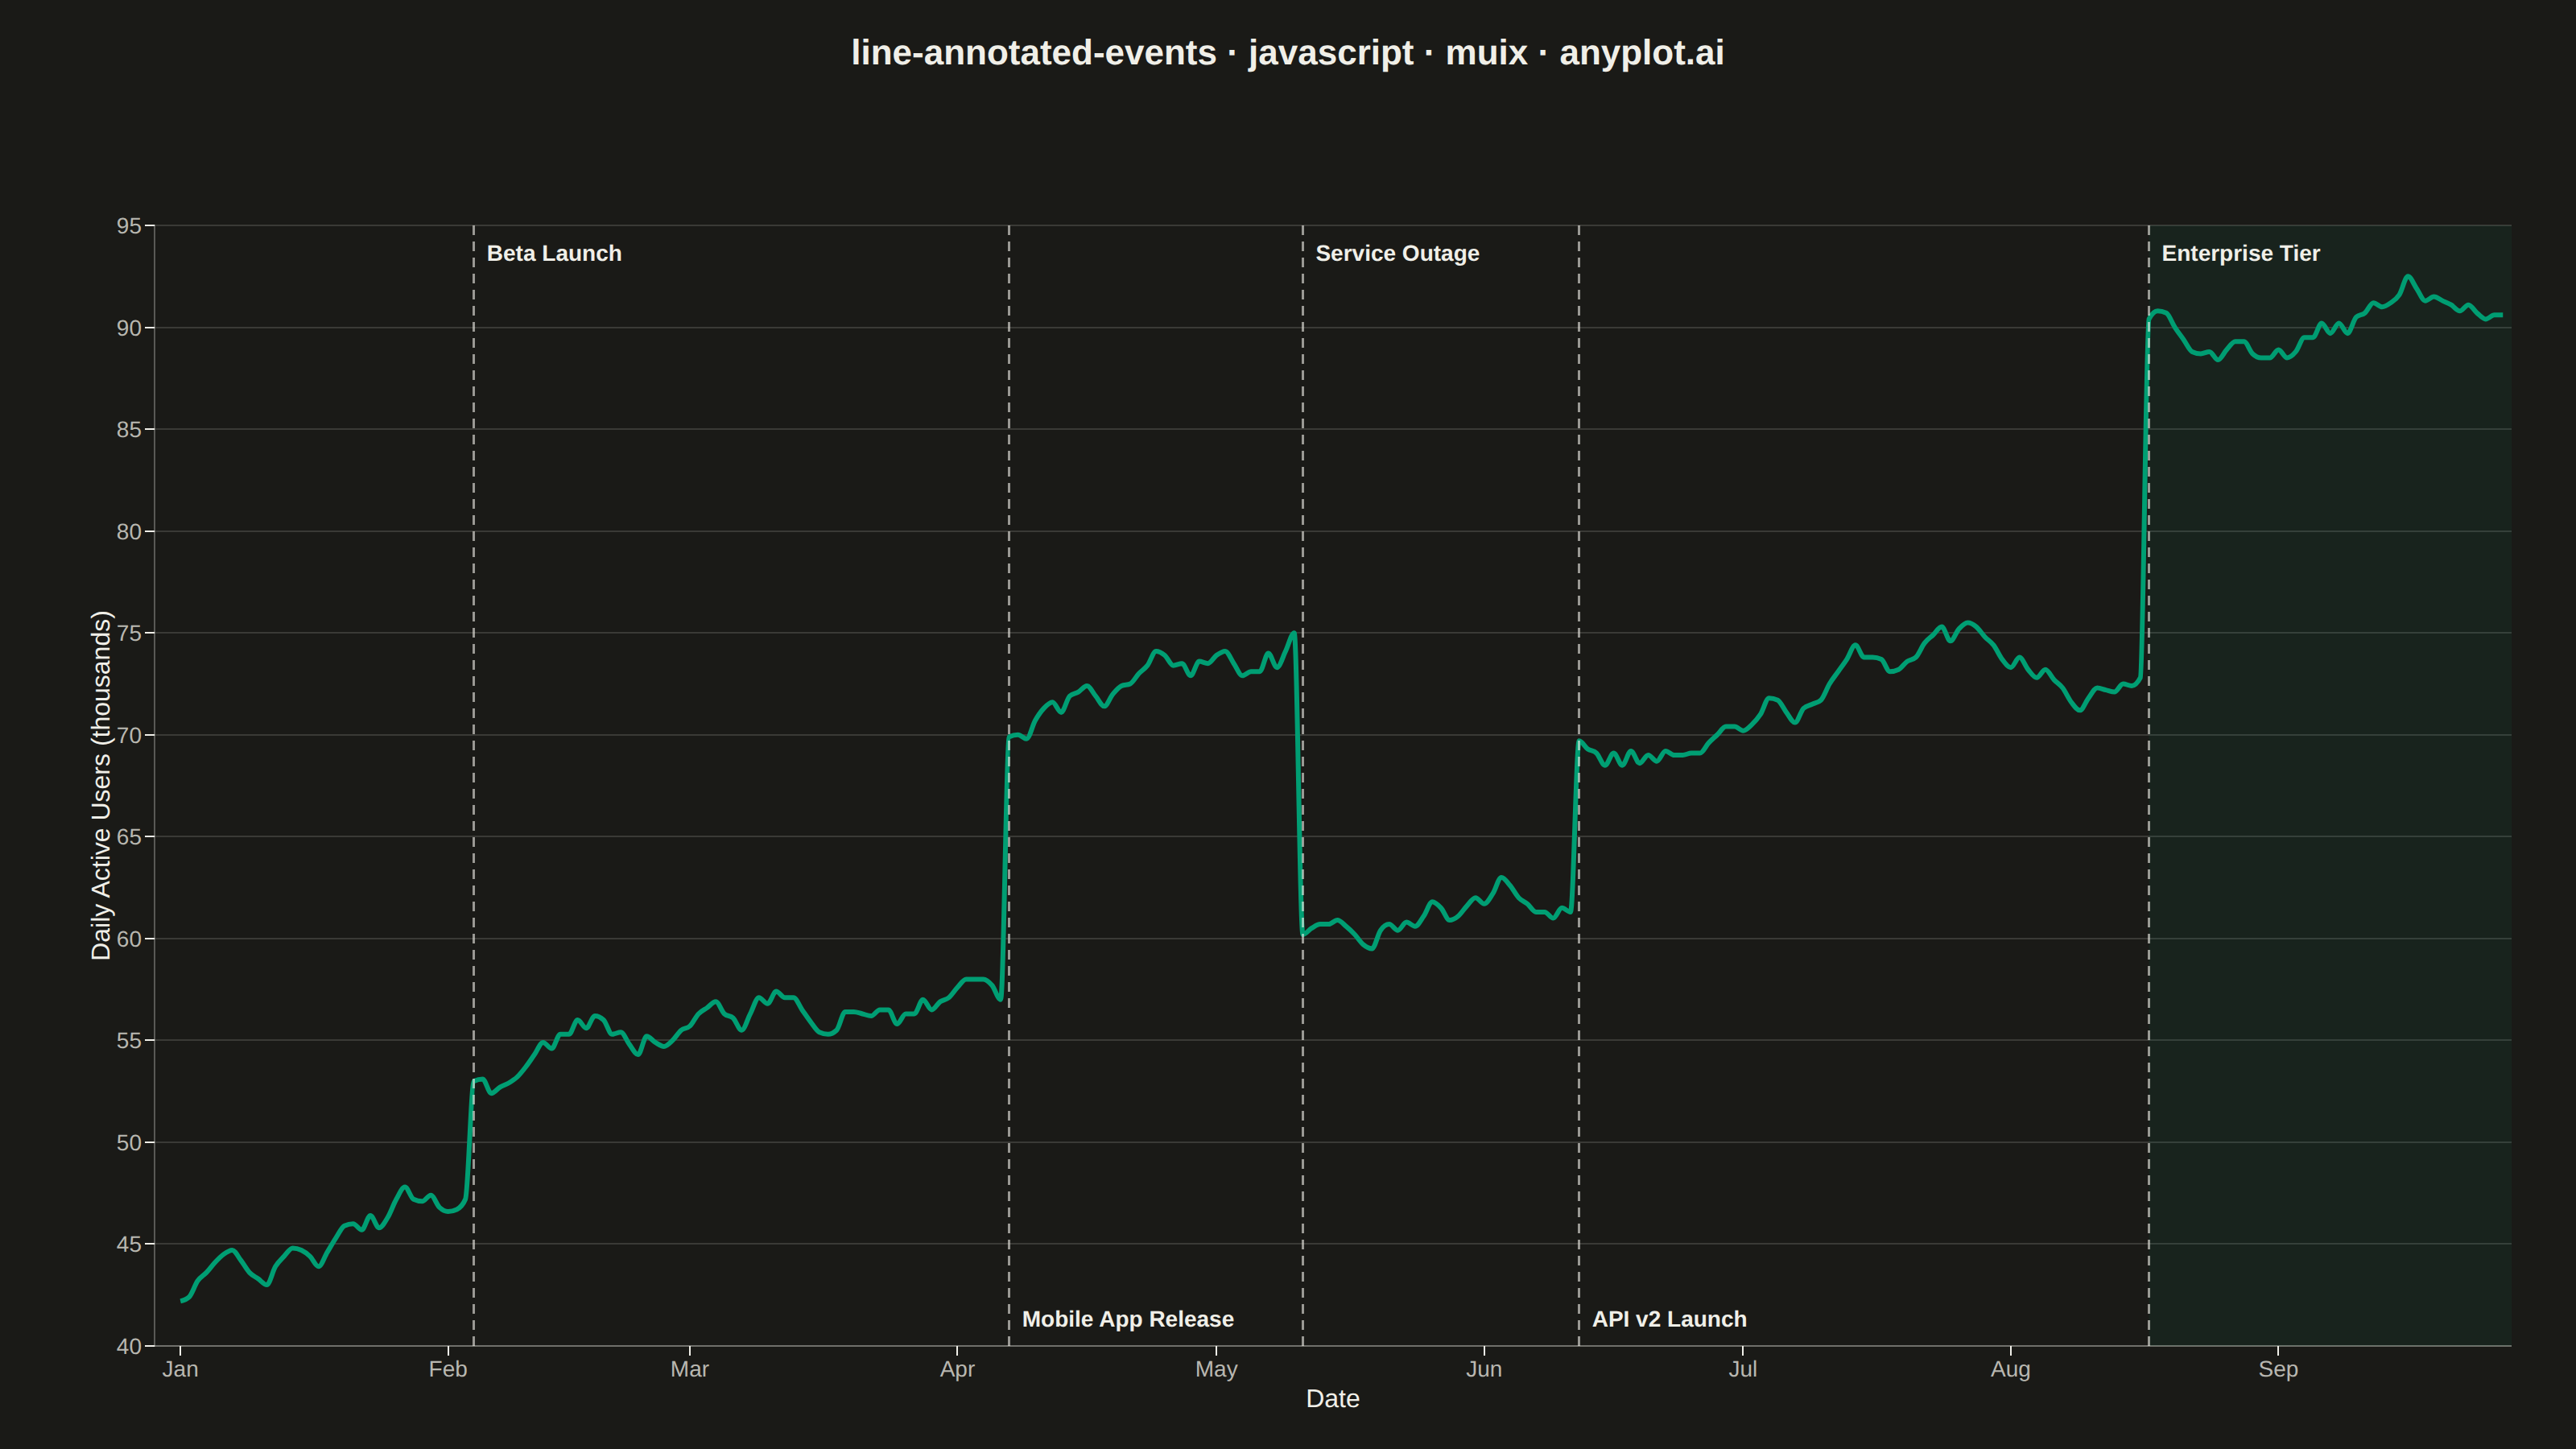
A line plot with annotations at key points marking important events or milestones. This visualization enhances time series data by highlighting significant occurrences such as product launches, policy changes, or market events directly on the chart. Vertical lines, markers, and text labels draw attention to specific moments in time, making it easy to correlate data trends with real-world events.
Preview render from the MUI X Charts implementation.