The same plot in 14 other libraries — JavaScript: Chart.js, D3.js, Apache ECharts, Highcharts; Python: Altair, Bokeh, lets-plot, Matplotlib, Plotly, plotnine, Pygal, Seaborn; R: ggplot2; Julia: Makie.jl. Compare all 15 side by side: Annotated Line Plot with Event Markers in Python, R, Julia and JavaScript.
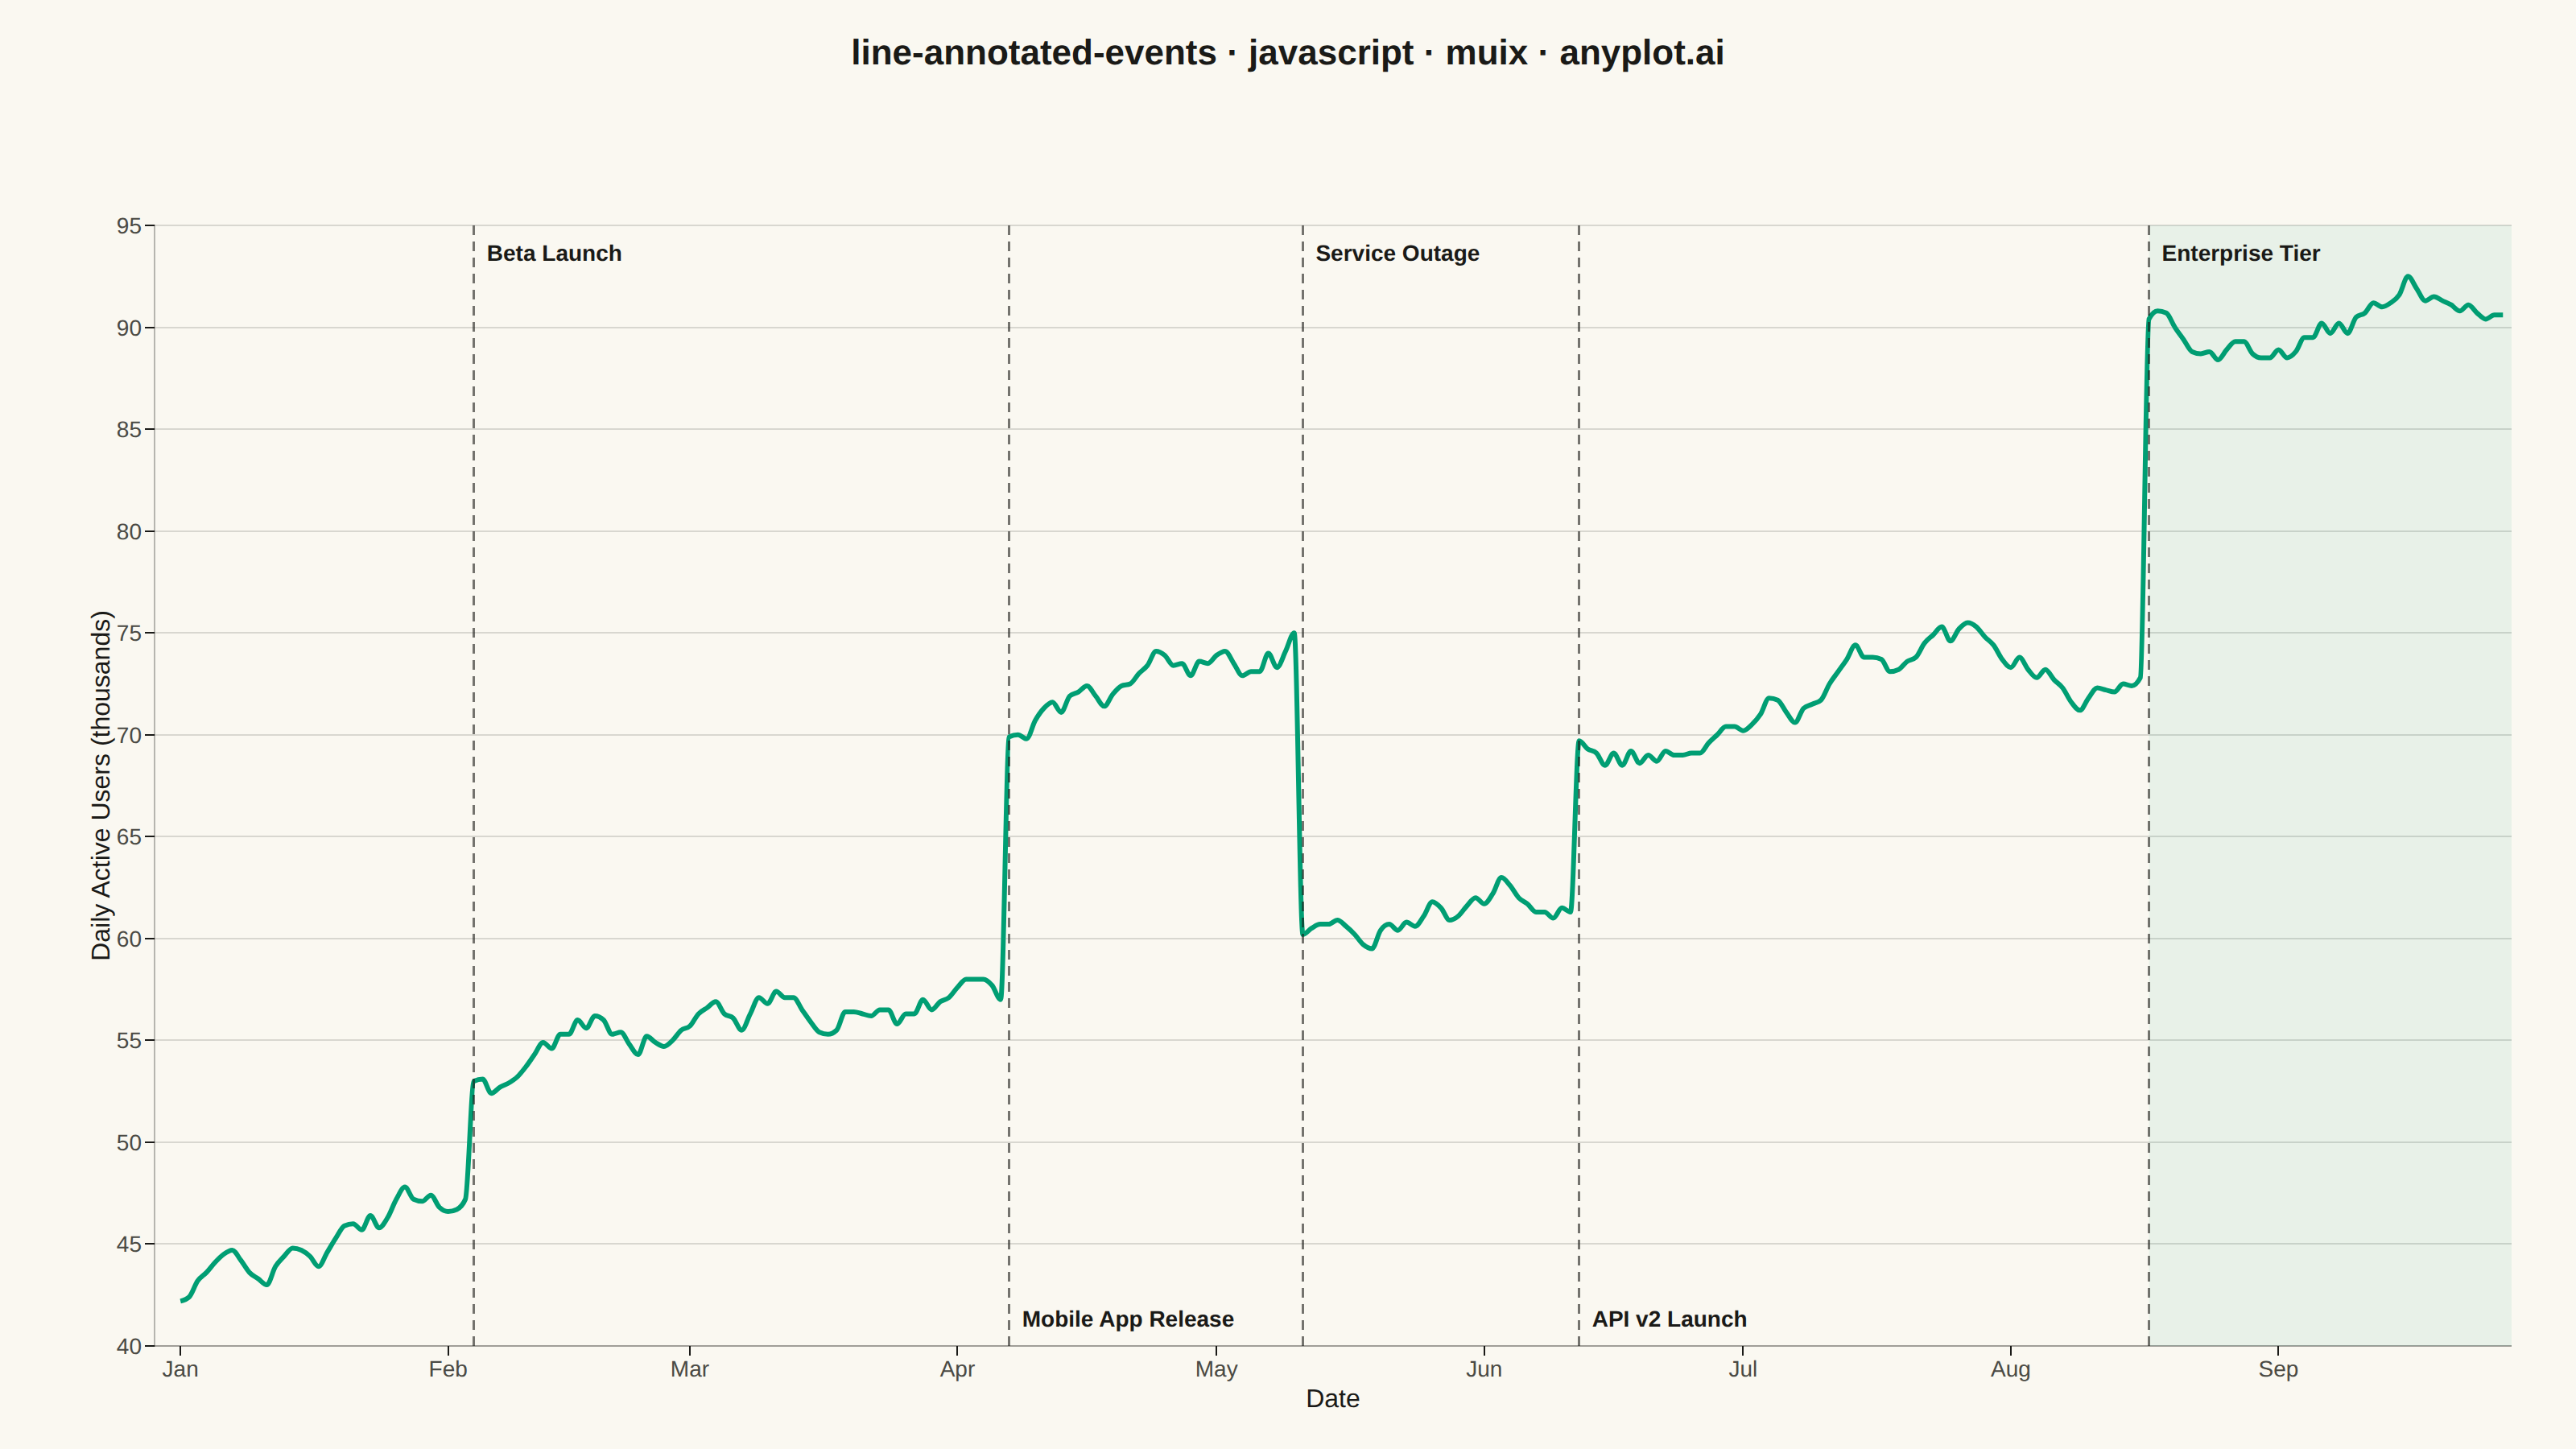
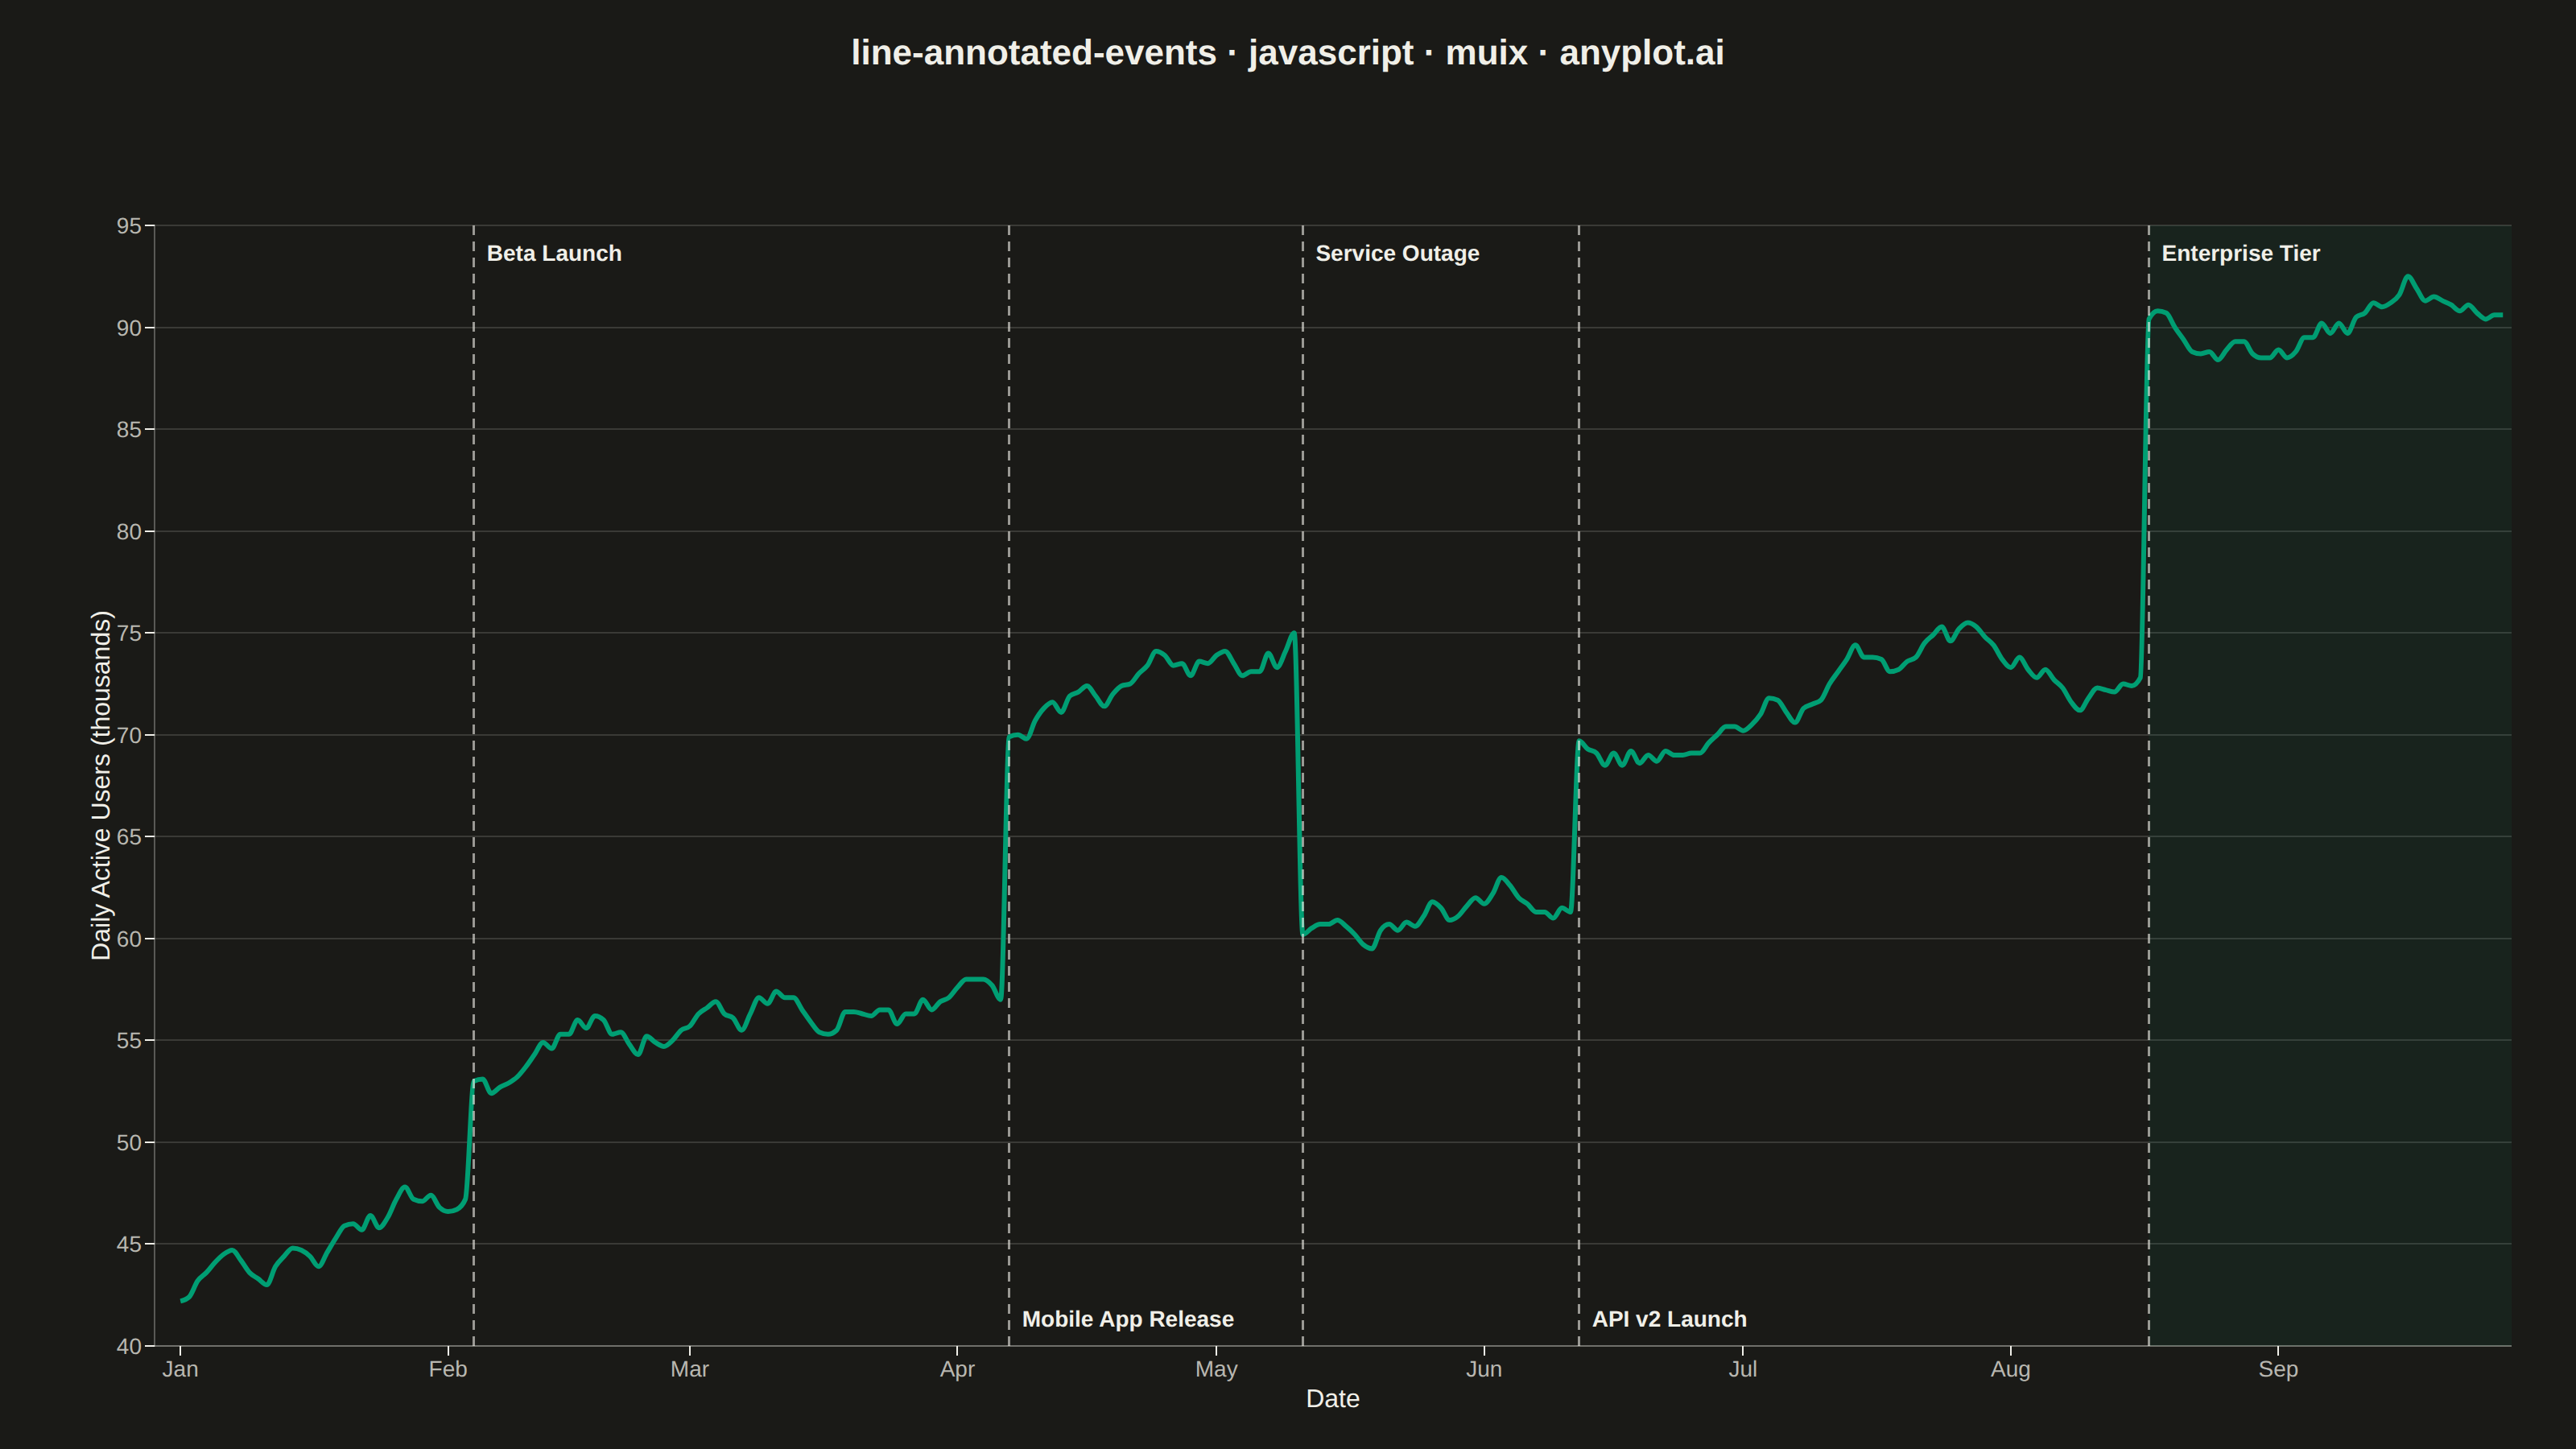
A line plot with annotations at key points marking important events or milestones. This visualization enhances time series data by highlighting significant occurrences such as product launches, policy changes, or market events directly on the chart. Vertical lines, markers, and text labels draw attention to specific moments in time, making it easy to correlate data trends with real-world events.
// anyplot.ai
// line-annotated-events: Annotated Line Plot with Event Markers
// Library: muix 7.29.1 | JavaScript 22.23.2
// Quality: 96/100 | Created: 2026-09-05
import { LineChart } from "@mui/x-charts/LineChart";
import { ChartsReferenceLine } from "@mui/x-charts/ChartsReferenceLine";
import { useXScale, useDrawingArea } from "@mui/x-charts/hooks";
import Box from "@mui/material/Box";
import Typography from "@mui/material/Typography";

const t = window.ANYPLOT_TOKENS;

// --- Data (in-memory, deterministic LCG PRNG — no fetch, no Math.random) ----
let seed = 42;
function rand() {
  seed = (seed * 1103515245 + 12345) & 0x7fffffff;
  return seed / 0x7fffffff;
}

const DAYS = 270; // roughly Jan through Sep
const START_DATE = new Date(2025, 0, 1);
const dates: Date[] = [];
for (let i = 0; i < DAYS; i += 1) {
  const d = new Date(START_DATE);
  d.setDate(d.getDate() + i);
  dates.push(d);
}

// Product/operational events that shift the daily-active-user trend. `bump`
// adds a one-time step to the running total the day the event lands — most
// launches step the level up, but the outage steps it down, showing both
// impact directions.
const EVENTS = [
  { dayIndex: 34, label: "Beta Launch", bump: 6 },
  { dayIndex: 96, label: "Mobile App Release", bump: 13 },
  { dayIndex: 130, label: "Service Outage", bump: -15 },
  { dayIndex: 162, label: "API v2 Launch", bump: 9 },
  { dayIndex: 228, label: "Enterprise Tier", bump: 17 },
];
const bumpByDay = new Map(EVENTS.map((e) => [e.dayIndex, e.bump]));

const dailyActiveUsers: number[] = [];
let level = 42; // thousands of daily active users
for (let i = 0; i < DAYS; i += 1) {
  const drift = 0.11;
  const noise = (rand() - 0.5) * 1.6;
  level = Math.max(5, level + drift + noise + (bumpByDay.get(i) ?? 0));
  dailyActiveUsers.push(Math.round(level * 10) / 10);
}

const dataset = dates.map((date, i) => ({ date, dau: dailyActiveUsers[i] }));

// One tick per calendar month — the time scale's "auto" tick picker otherwise
// crams in a tick every ~9 days, repeating the same month label many times.
const monthTicks: Date[] = [];
{
  const cursor = new Date(dates[0].getFullYear(), dates[0].getMonth(), 1);
  const last = dates[dates.length - 1];
  while (cursor <= last) {
    monthTicks.push(new Date(cursor));
    cursor.setMonth(cursor.getMonth() + 1);
  }
}

const TITLE = "line-annotated-events · javascript · muix · anyplot.ai";

// Subtle shaded region marking the sustained growth phase after the largest
// step-up (Enterprise Tier) — a deliberate accent beyond the reference lines
// themselves, reading the scale through the chart's own x-axis via hooks.
function GrowthPhaseBand({ from, color }: { from: Date; color: string }) {
  const xScale = useXScale();
  const { top, height, left, width } = useDrawingArea();
  const xStart = xScale(from);
  if (xStart == null || Number.isNaN(xStart)) return null;
  const bandWidth = left + width - xStart;
  if (bandWidth <= 0) return null;
  return (
    <rect
      x={xStart}
      y={top}
      width={bandWidth}
      height={height}
      fill={color}
      fillOpacity={0.07}
      pointerEvents="none"
    />
  );
}

// --- Chart (default-exported component — the harness mounts it) -----------
export default function Chart() {
  const W = window.ANYPLOT_SIZE.width;
  const H = window.ANYPLOT_SIZE.height;
  const titleSize =
    TITLE.length > 67 ? Math.max(14, Math.round((22 * 67) / TITLE.length)) : 22;

  const TITLE_H = 64;
  const chartH = H - TITLE_H;

  return (
    <Box
      sx={{
        width: W,
        height: H,
        bgcolor: t.pageBg,
        display: "flex",
        flexDirection: "column",
        fontFamily: "'Roboto', 'Helvetica Neue', Arial, sans-serif",
        boxSizing: "border-box",
      }}
    >
      <Box
        sx={{
          height: TITLE_H,
          display: "flex",
          alignItems: "center",
          justifyContent: "center",
        }}
      >
        <Typography sx={{ color: t.ink, fontSize: titleSize, fontWeight: 600 }}>
          {TITLE}
        </Typography>
      </Box>

      <LineChart
        width={W}
        height={chartH}
        skipAnimation
        dataset={dataset}
        series={[
          {
            dataKey: "dau",
            label: "Daily Active Users",
            showMark: false,
            color: t.palette[0],
            curve: "monotoneX",
            valueFormatter: (v: number | null) =>
              v == null ? "" : `${v.toFixed(1)}k`,
          },
        ]}
        xAxis={[
          {
            dataKey: "date",
            scaleType: "time",
            label: "Date",
            valueFormatter: (d: Date) =>
              d.toLocaleDateString("en-US", { month: "short" }),
            tickInterval: monthTicks,
            tickLabelStyle: { fontSize: 14, fill: t.inkSoft },
            labelStyle: { fontSize: 16, fill: t.ink },
          },
        ]}
        yAxis={[
          {
            label: "Daily Active Users (thousands)",
            tickLabelStyle: { fontSize: 14, fill: t.inkSoft },
            labelStyle: { fontSize: 16, fill: t.ink },
          },
        ]}
        grid={{ horizontal: true }}
        margin={{ top: 76, right: 40, bottom: 64, left: 96 }}
        slotProps={{ legend: { hidden: true } }}
        sx={{
          "& .MuiLineElement-root": { strokeWidth: 3 },
          "& .MuiChartsAxis-line": { stroke: t.inkSoft, strokeOpacity: 0.3 },
          "& .MuiChartsGrid-line": { stroke: t.grid },
        }}
      >
        <GrowthPhaseBand
          from={dates[EVENTS[EVENTS.length - 1].dayIndex]}
          color={t.palette[0]}
        />
        {EVENTS.map((event, i) => (
          <ChartsReferenceLine
            key={event.label}
            x={dates[event.dayIndex]}
            label={event.label}
            labelAlign={i % 2 === 0 ? "start" : "end"}
            spacing={{ x: 8, y: 12 }}
            lineStyle={{
              stroke: t.ink,
              strokeDasharray: "6 4",
              strokeWidth: 1.5,
              strokeOpacity: 0.6,
            }}
            labelStyle={{ fontSize: 14, fontWeight: 600, fill: t.ink }}
          />
        ))}
      </LineChart>
    </Box>
  );
}
Runnable source as JSON, for any HTTP client: https://api.anyplot.ai/specs/line-annotated-events/muix/code. Any spec id and library id listed in llms-full.txt fit the same URL shape; every URL below is complete and callable.
{
  "spec_id": "line-annotated-events",
  "language": "javascript",
  "library": "muix",
  "page": "https://anyplot.ai/line-annotated-events/javascript/muix",
  "hub": "https://anyplot.ai/line-annotated-events",
  "code_json": "https://api.anyplot.ai/specs/line-annotated-events/muix/code",
  "spec_json": "https://api.anyplot.ai/specs/line-annotated-events",
  "render_light_png": "https://storage.googleapis.com/anyplot-images/plots/line-annotated-events/javascript/muix/plot-light.png",
  "render_dark_png": "https://storage.googleapis.com/anyplot-images/plots/line-annotated-events/javascript/muix/plot-dark.png",
  "interactive_light_html": "https://storage.googleapis.com/anyplot-images/plots/line-annotated-events/javascript/muix/plot-light.html",
  "interactive_dark_html": "https://storage.googleapis.com/anyplot-images/plots/line-annotated-events/javascript/muix/plot-dark.html",
  "quality_score": 96.0,
  "license": "MIT",
  "guide": "https://anyplot.ai/llms.txt"
}
Part of Annotated Line Plot with Event Markers on anyplot.ai.