The same plot in 14 other libraries — JavaScript: Chart.js, D3.js, Highcharts, MUI X Charts; Python: Altair, Bokeh, lets-plot, Matplotlib, Plotly, plotnine, Pygal, Seaborn; R: ggplot2; Julia: Makie.jl. Compare all 15 side by side: Annotated Line Plot with Event Markers in Python, R, Julia and JavaScript.
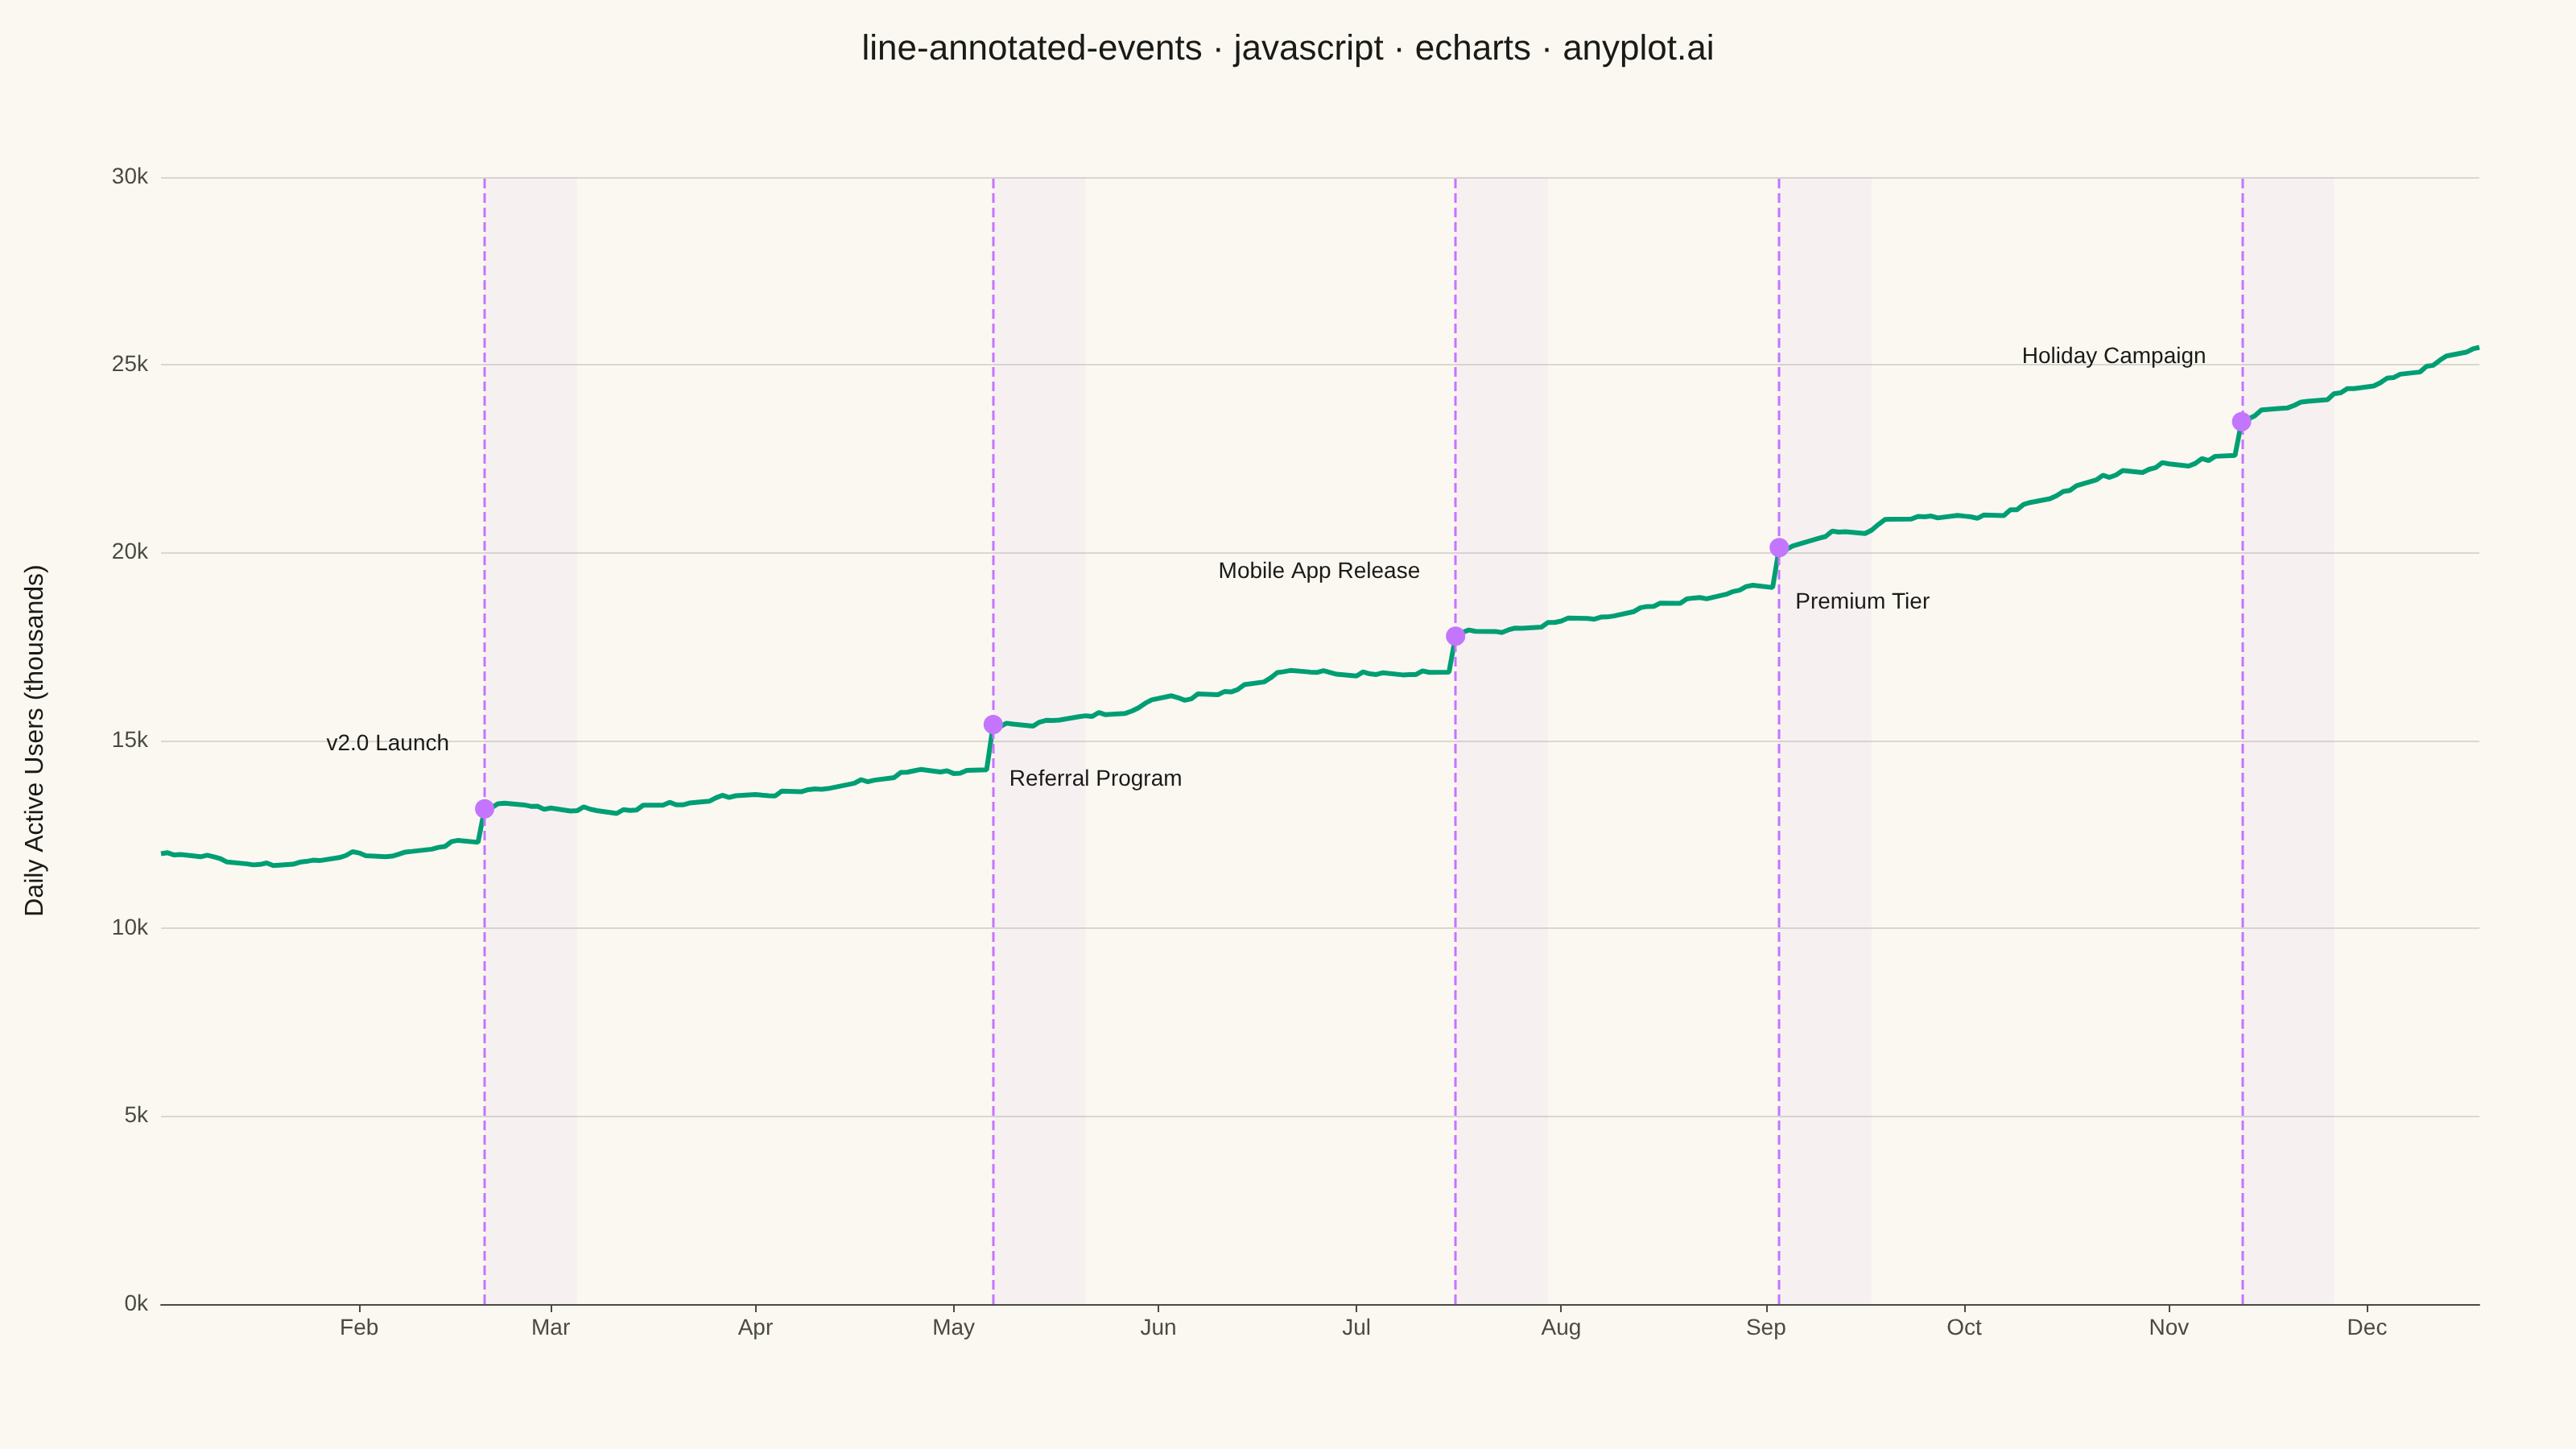
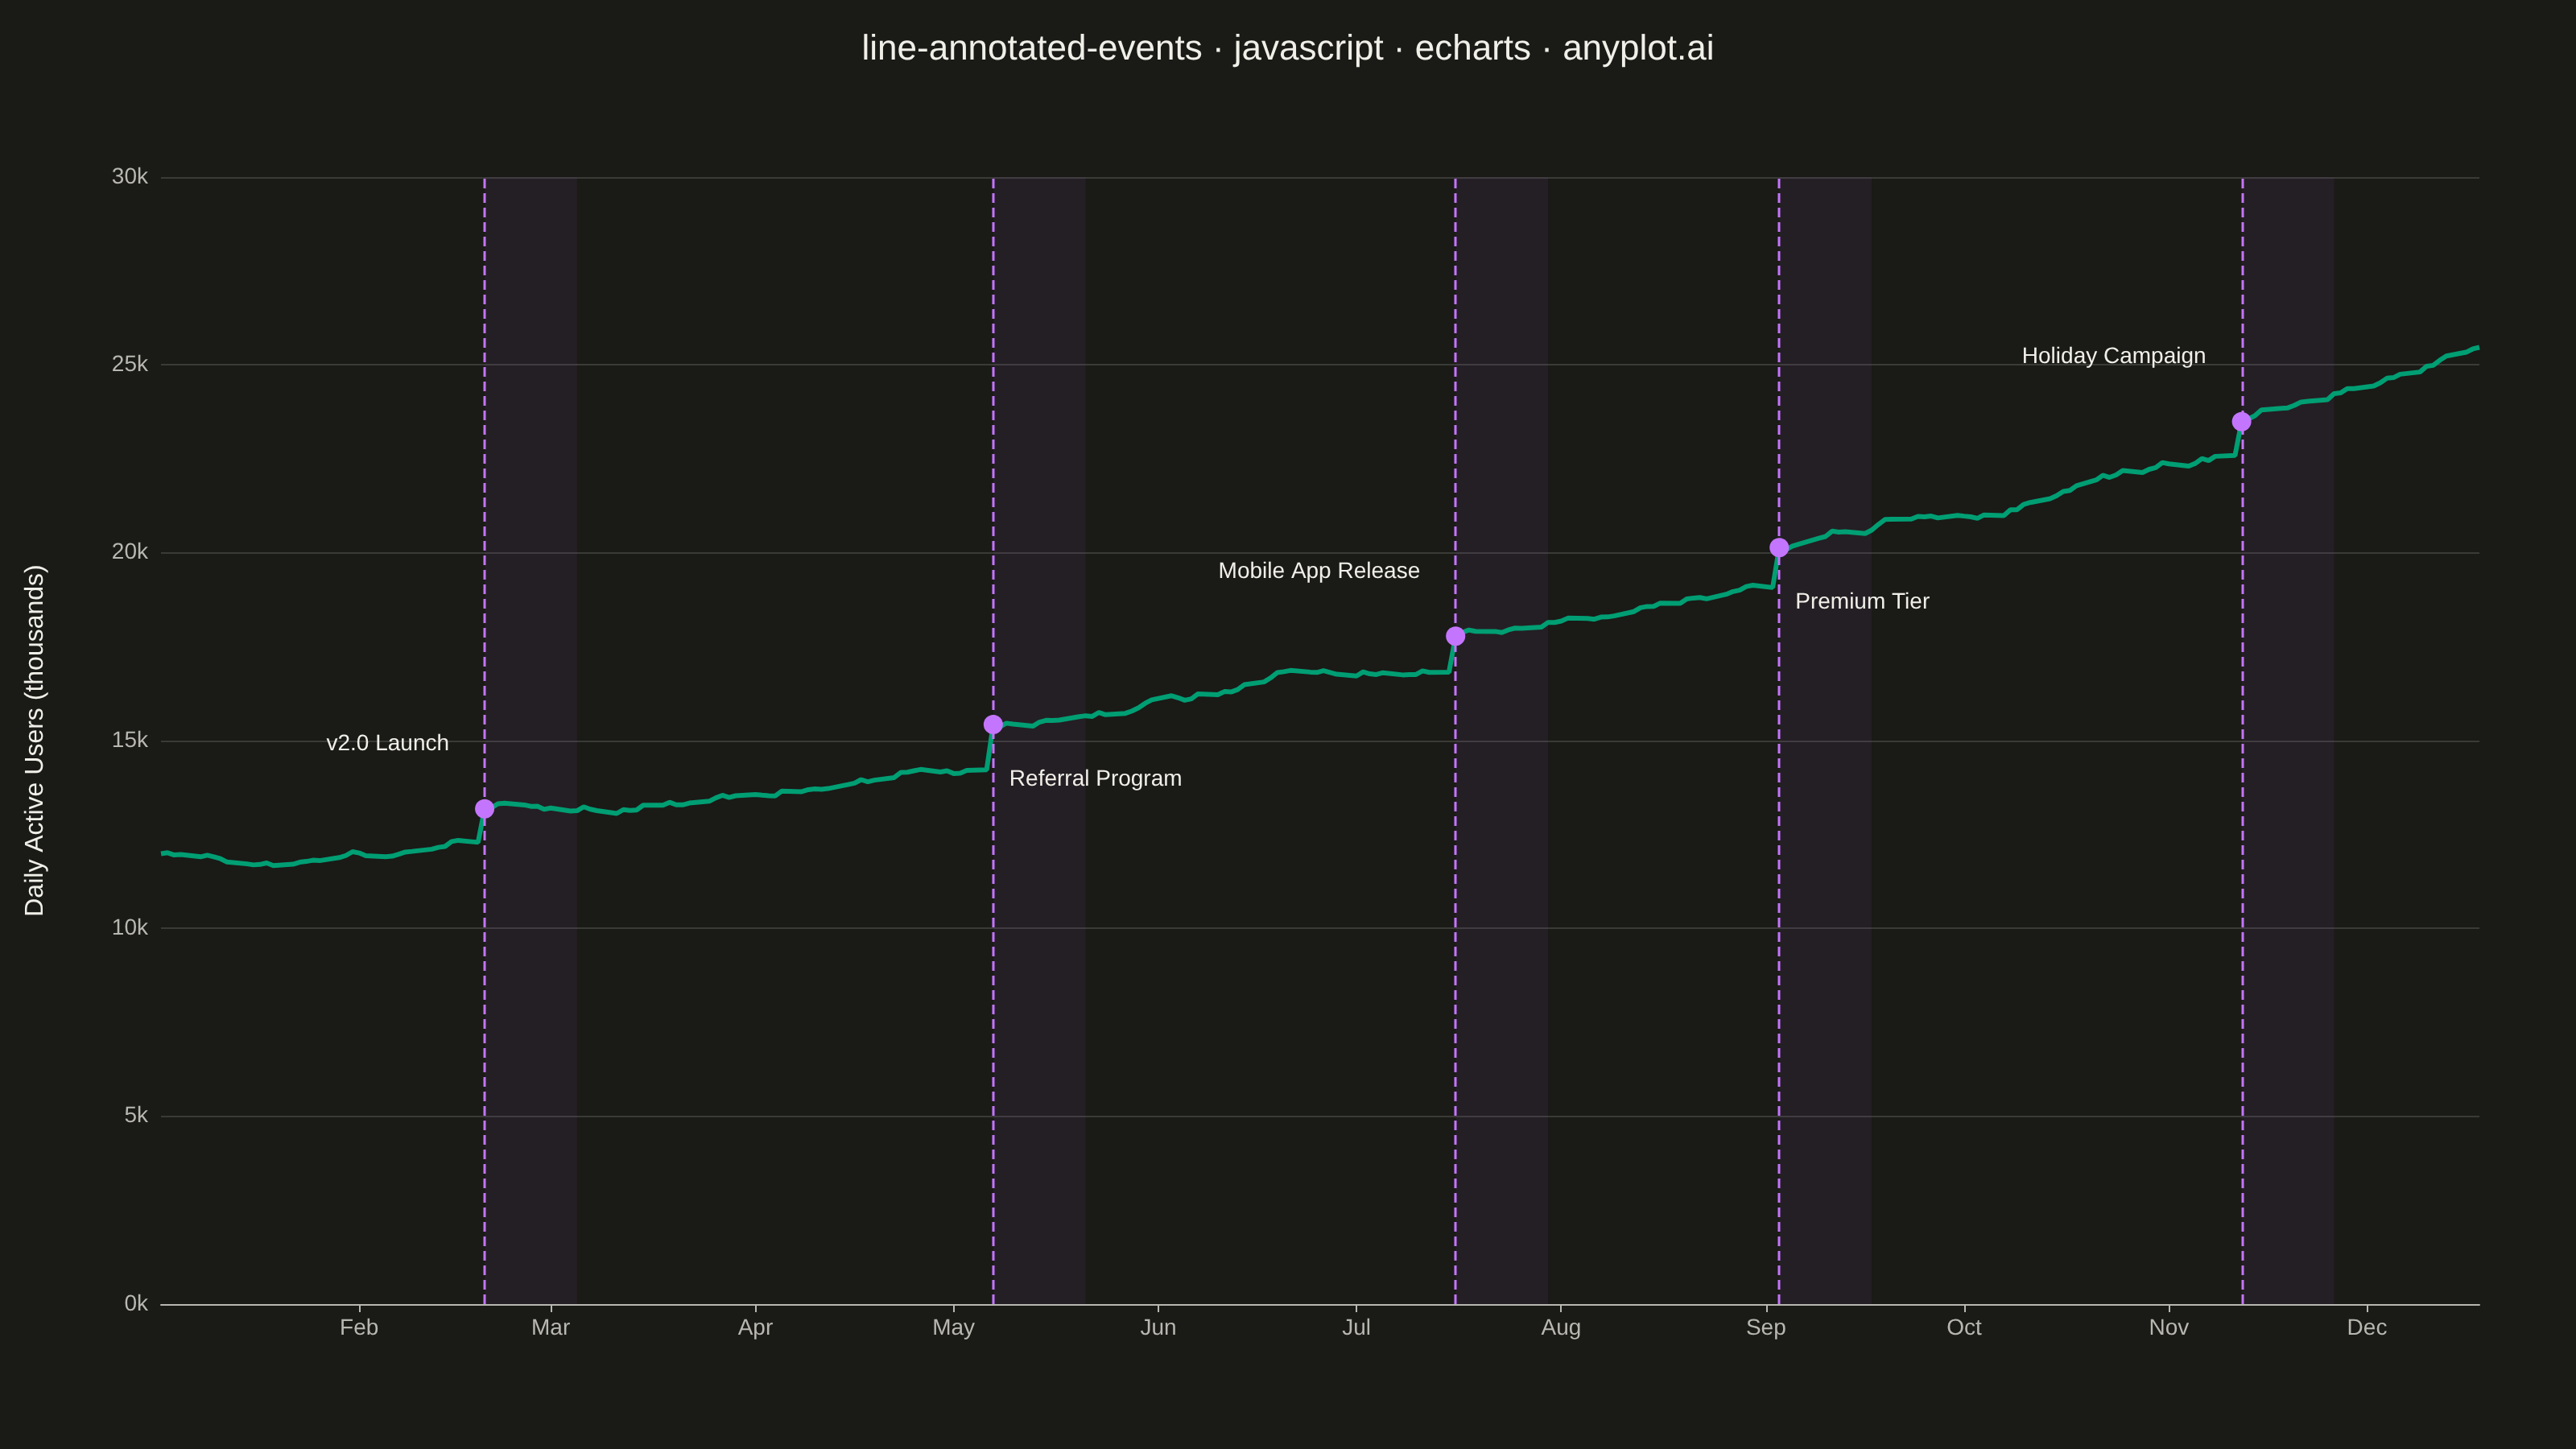
A line plot with annotations at key points marking important events or milestones. This visualization enhances time series data by highlighting significant occurrences such as product launches, policy changes, or market events directly on the chart. Vertical lines, markers, and text labels draw attention to specific moments in time, making it easy to correlate data trends with real-world events.
// anyplot.ai
// line-annotated-events: Annotated Line Plot with Event Markers
// Library: echarts 6.1.0 | JavaScript 22.23.2
// Quality: 93/100 | Created: 2026-09-05

const t = window.ANYPLOT_TOKENS;

// --- Data (in-memory, deterministic LCG) ------------------------------------
// Daily active users over one year, with product-launch events boosting growth.
let lcgState = 20260905;
function nextRandom() {
  lcgState = (lcgState * 1103515245 + 12345) % 2147483648;
  return lcgState / 2147483648;
}

const START_DATE = new Date("2024-01-02T00:00:00Z");
const NUM_DAYS = 252; // one trading year, business days only
const dates = [];
for (let i = 0, d = 0; d < NUM_DAYS; i++) {
  const day = new Date(START_DATE.getTime() + i * 86400000);
  const weekday = day.getUTCDay();
  if (weekday !== 0 && weekday !== 6) {
    dates.push(day);
    d++;
  }
}

const events = [
  { dayIndex: 35, label: "v2.0 Launch" },
  { dayIndex: 90, label: "Referral Program", steep: true },
  { dayIndex: 140, label: "Mobile App Release" },
  { dayIndex: 175, label: "Premium Tier", steep: true },
  { dayIndex: 225, label: "Holiday Campaign" },
];
const eventDayIndices = new Set(events.map((e) => e.dayIndex));

let dau = 12000;
const series = [];
for (let i = 0; i < dates.length; i++) {
  const trend = 18 + i * 0.15;
  const noise = (nextRandom() - 0.5) * 220;
  const boost = eventDayIndices.has(i) ? 900 + nextRandom() * 400 : 0;
  dau = Math.max(8000, dau + trend + noise + boost);
  series.push([dates[i].getTime(), Math.round(dau)]);
}

// Offset labels left of their marker and alternate above/below so they never
// sit on top of the vertical dashed event line or the rising data line.
// A label offset backward in time (negative x) lands over the pre-event
// trace, which sits at roughly the same height as a "below" placement right
// after a steep step — so steep events shift the label forward in time
// instead, over the flatter post-event trace, to get real clearance.
const eventPoints = events.map((e, idx) => {
  const magnitude = e.steep ? 40 : 34;
  const below = idx % 2 !== 0;
  return {
    coord: [dates[e.dayIndex].getTime(), series[e.dayIndex][1]],
    label: e.label,
    offset: [e.steep && below ? 16 : -16, below ? magnitude : -magnitude],
    align: e.steep && below ? "left" : "right",
  };
});

// Shade a 10-business-day post-event window so viewers can see how quickly
// each launch/campaign moved the trend, not just where it started.
const postEventWindows = events.map((e) => {
  const endIdx = Math.min(dates.length - 1, e.dayIndex + 10);
  return [{ xAxis: dates[e.dayIndex].getTime() }, { xAxis: dates[endIdx].getTime() }];
});

// --- Init --------------------------------------------------------------------
const chart = echarts.init(document.getElementById("container"));

// --- Option -------------------------------------------------------------------
chart.setOption({
  animation: false,
  color: t.palette,
  backgroundColor: "transparent",
  title: {
    text: "line-annotated-events · javascript · echarts · anyplot.ai",
    left: "center",
    textStyle: { color: t.ink, fontSize: 22, fontWeight: 500 },
  },
  tooltip: {
    trigger: "axis",
    valueFormatter: (v) => `${v.toLocaleString()} DAU`,
  },
  grid: { left: 100, right: 60, top: 110, bottom: 90 },
  xAxis: {
    type: "time",
    axisLabel: { color: t.inkSoft, fontSize: 14 },
    axisLine: { lineStyle: { color: t.inkSoft } },
    splitLine: { show: false },
  },
  yAxis: {
    type: "value",
    name: "Daily Active Users (thousands)",
    nameLocation: "middle",
    nameGap: 70,
    nameTextStyle: { color: t.ink, fontSize: 16 },
    axisLabel: { color: t.inkSoft, fontSize: 14, formatter: (v) => (v / 1000).toFixed(0) + "k" },
    axisLine: { show: false },
    splitLine: { lineStyle: { color: t.grid } },
  },
  series: [
    {
      name: "Daily Active Users",
      type: "line",
      data: series,
      showSymbol: false,
      lineStyle: { width: 3, color: t.palette[0] },
      itemStyle: { color: t.palette[0] },
      markLine: {
        silent: true,
        symbol: "none",
        label: { show: false },
        lineStyle: { type: "dashed", width: 1.5, color: t.palette[1] },
        data: events.map((e) => ({ xAxis: dates[e.dayIndex].getTime() })),
      },
      markArea: {
        silent: true,
        itemStyle: { color: t.palette[1], opacity: 0.06 },
        data: postEventWindows,
      },
      markPoint: {
        symbol: "circle",
        symbolSize: 12,
        itemStyle: { color: t.palette[1] },
        label: {
          show: true,
          formatter: (p) => p.data.label,
          color: t.ink,
          fontSize: 14,
          fontWeight: 500,
        },
        data: eventPoints.map((p) => ({
          coord: p.coord,
          label: {
            position: p.offset,
            align: p.align,
            verticalAlign: "middle",
            formatter: () => p.label,
          },
        })),
      },
    },
  ],
});
Runnable source as JSON, for any HTTP client: https://api.anyplot.ai/specs/line-annotated-events/echarts/code. Any spec id and library id listed in llms-full.txt fit the same URL shape; every URL below is complete and callable.
{
  "spec_id": "line-annotated-events",
  "language": "javascript",
  "library": "echarts",
  "page": "https://anyplot.ai/line-annotated-events/javascript/echarts",
  "hub": "https://anyplot.ai/line-annotated-events",
  "code_json": "https://api.anyplot.ai/specs/line-annotated-events/echarts/code",
  "spec_json": "https://api.anyplot.ai/specs/line-annotated-events",
  "render_light_png": "https://storage.googleapis.com/anyplot-images/plots/line-annotated-events/javascript/echarts/plot-light.png",
  "render_dark_png": "https://storage.googleapis.com/anyplot-images/plots/line-annotated-events/javascript/echarts/plot-dark.png",
  "interactive_light_html": "https://storage.googleapis.com/anyplot-images/plots/line-annotated-events/javascript/echarts/plot-light.html",
  "interactive_dark_html": "https://storage.googleapis.com/anyplot-images/plots/line-annotated-events/javascript/echarts/plot-dark.html",
  "quality_score": 93.0,
  "license": "MIT",
  "guide": "https://anyplot.ai/llms.txt"
}
Part of Annotated Line Plot with Event Markers on anyplot.ai.