The same plot in 14 other libraries — JavaScript: D3.js, Apache ECharts, Highcharts, MUI X Charts; Python: Altair, Bokeh, lets-plot, Matplotlib, Plotly, plotnine, Pygal, Seaborn; R: ggplot2; Julia: Makie.jl. Compare all 15 side by side: Annotated Line Plot with Event Markers in Python, R, Julia and JavaScript.
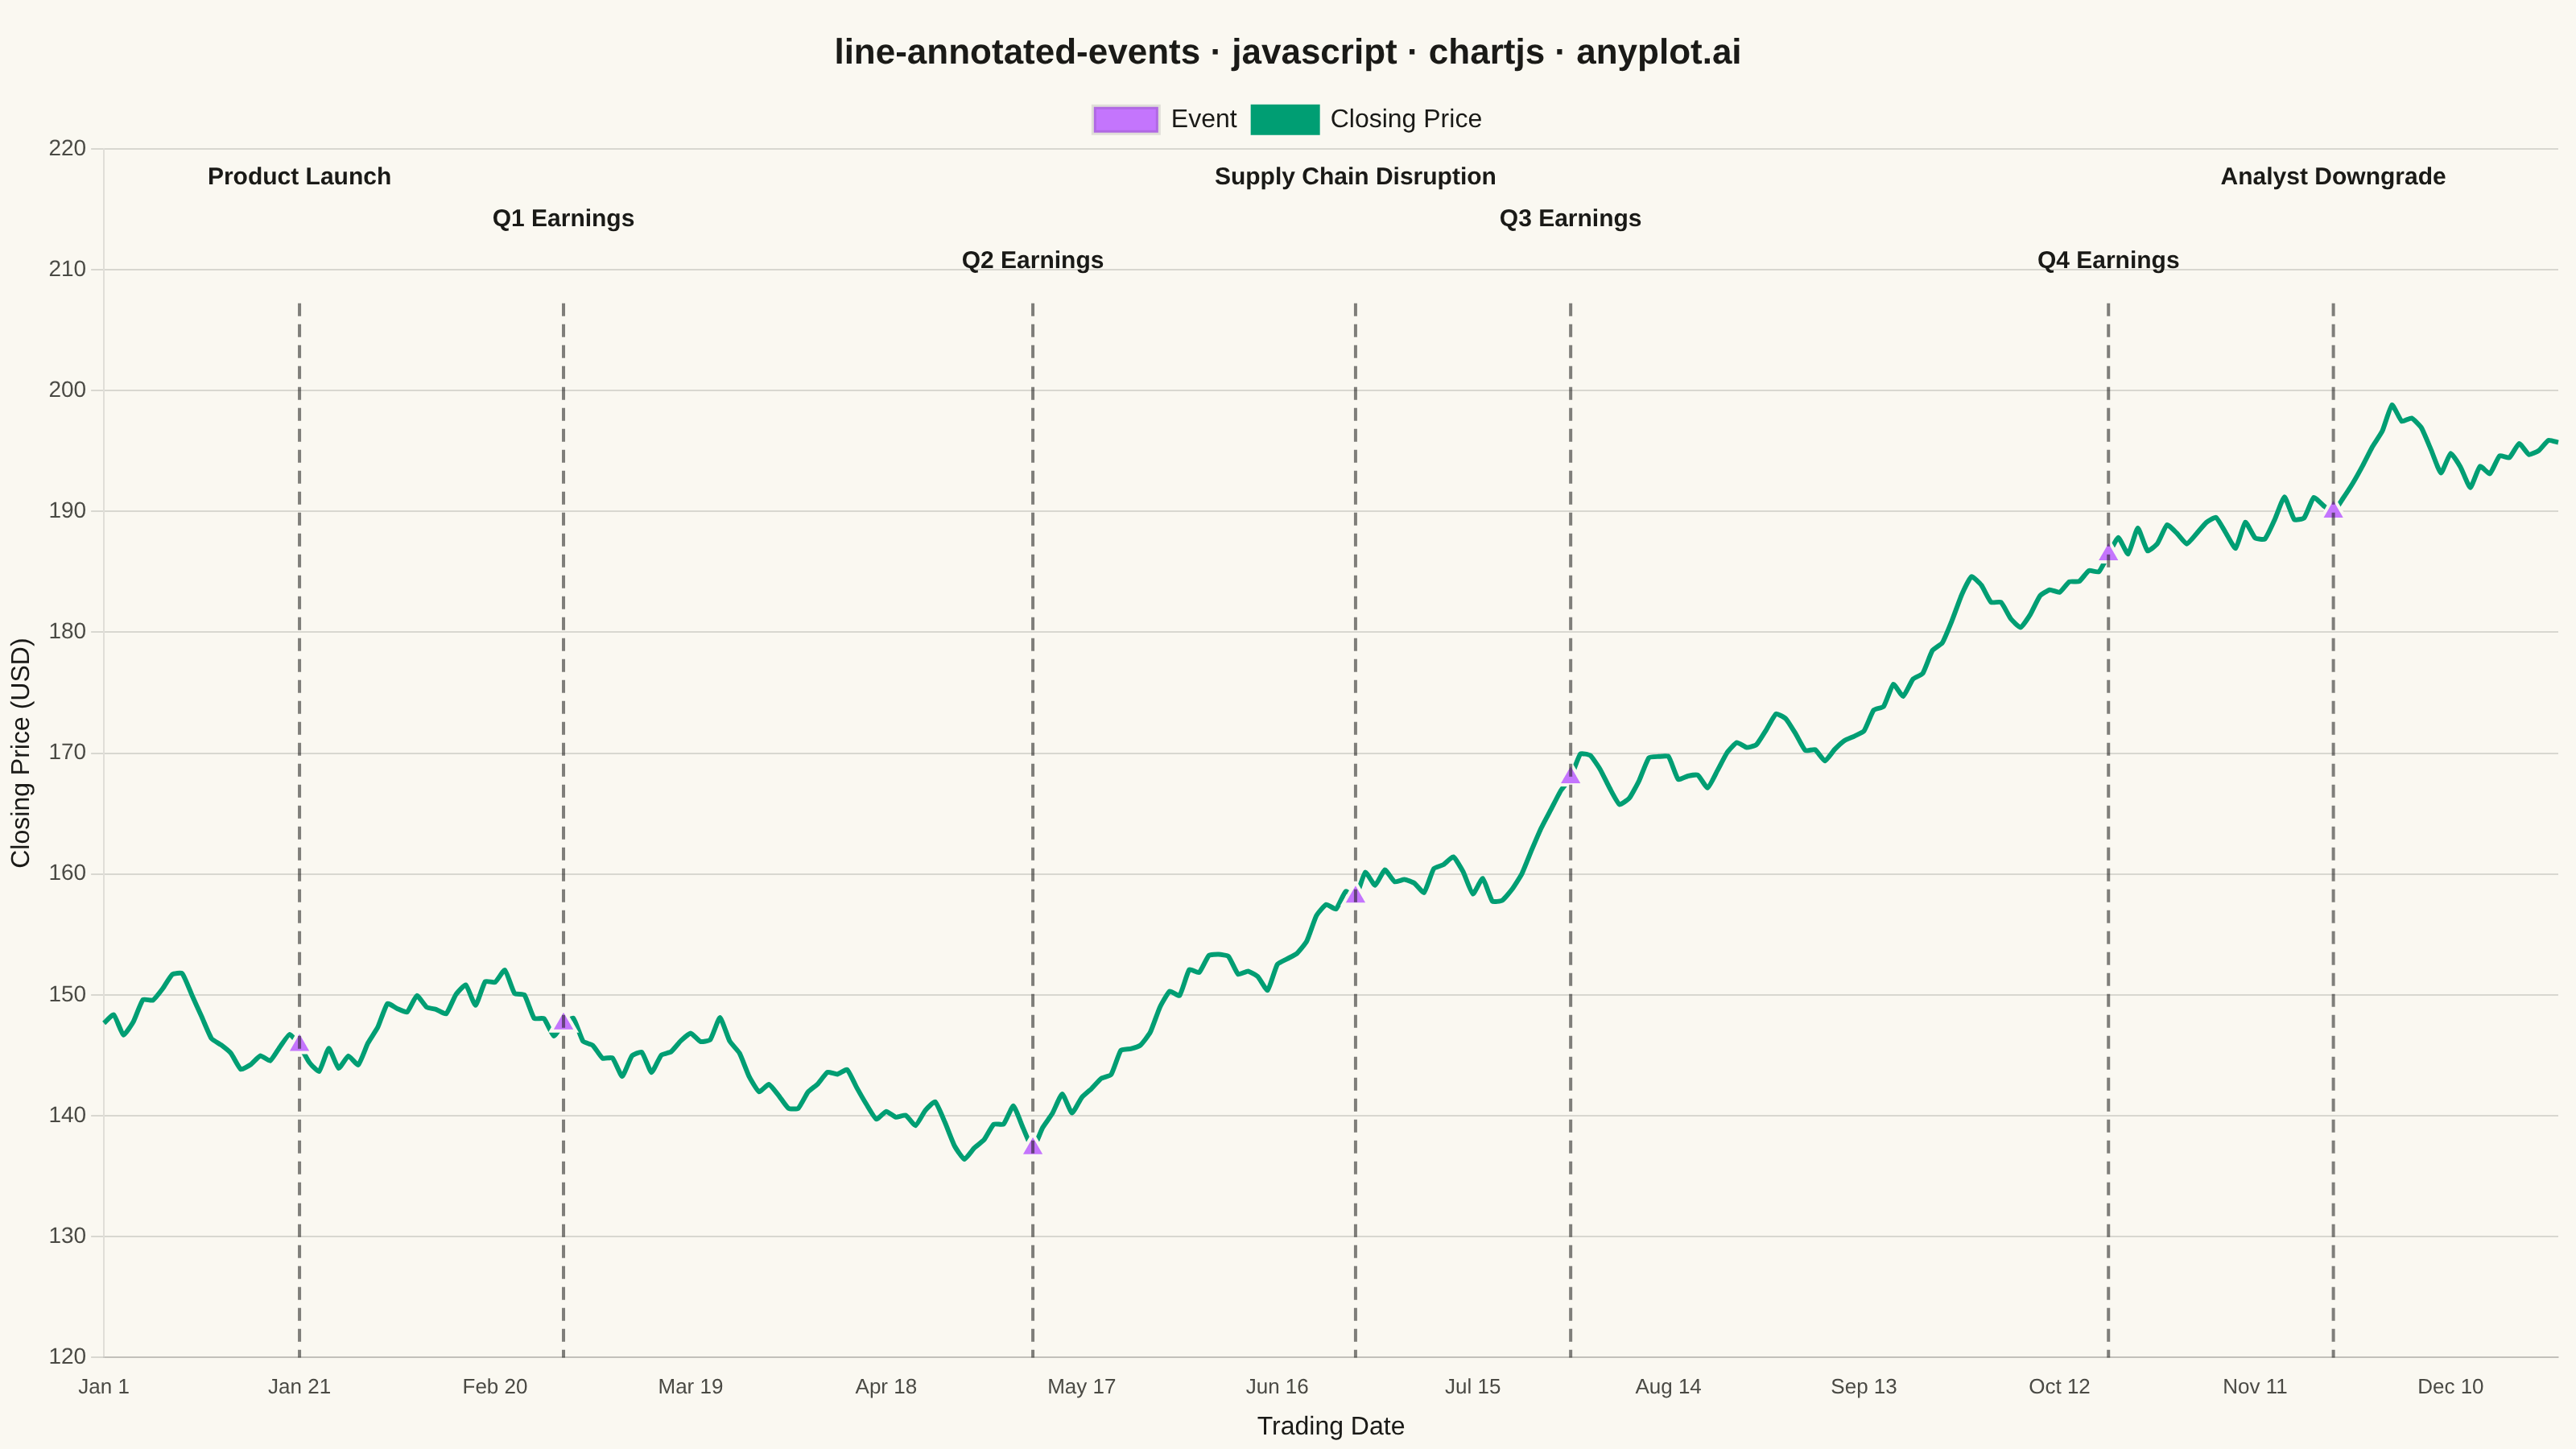
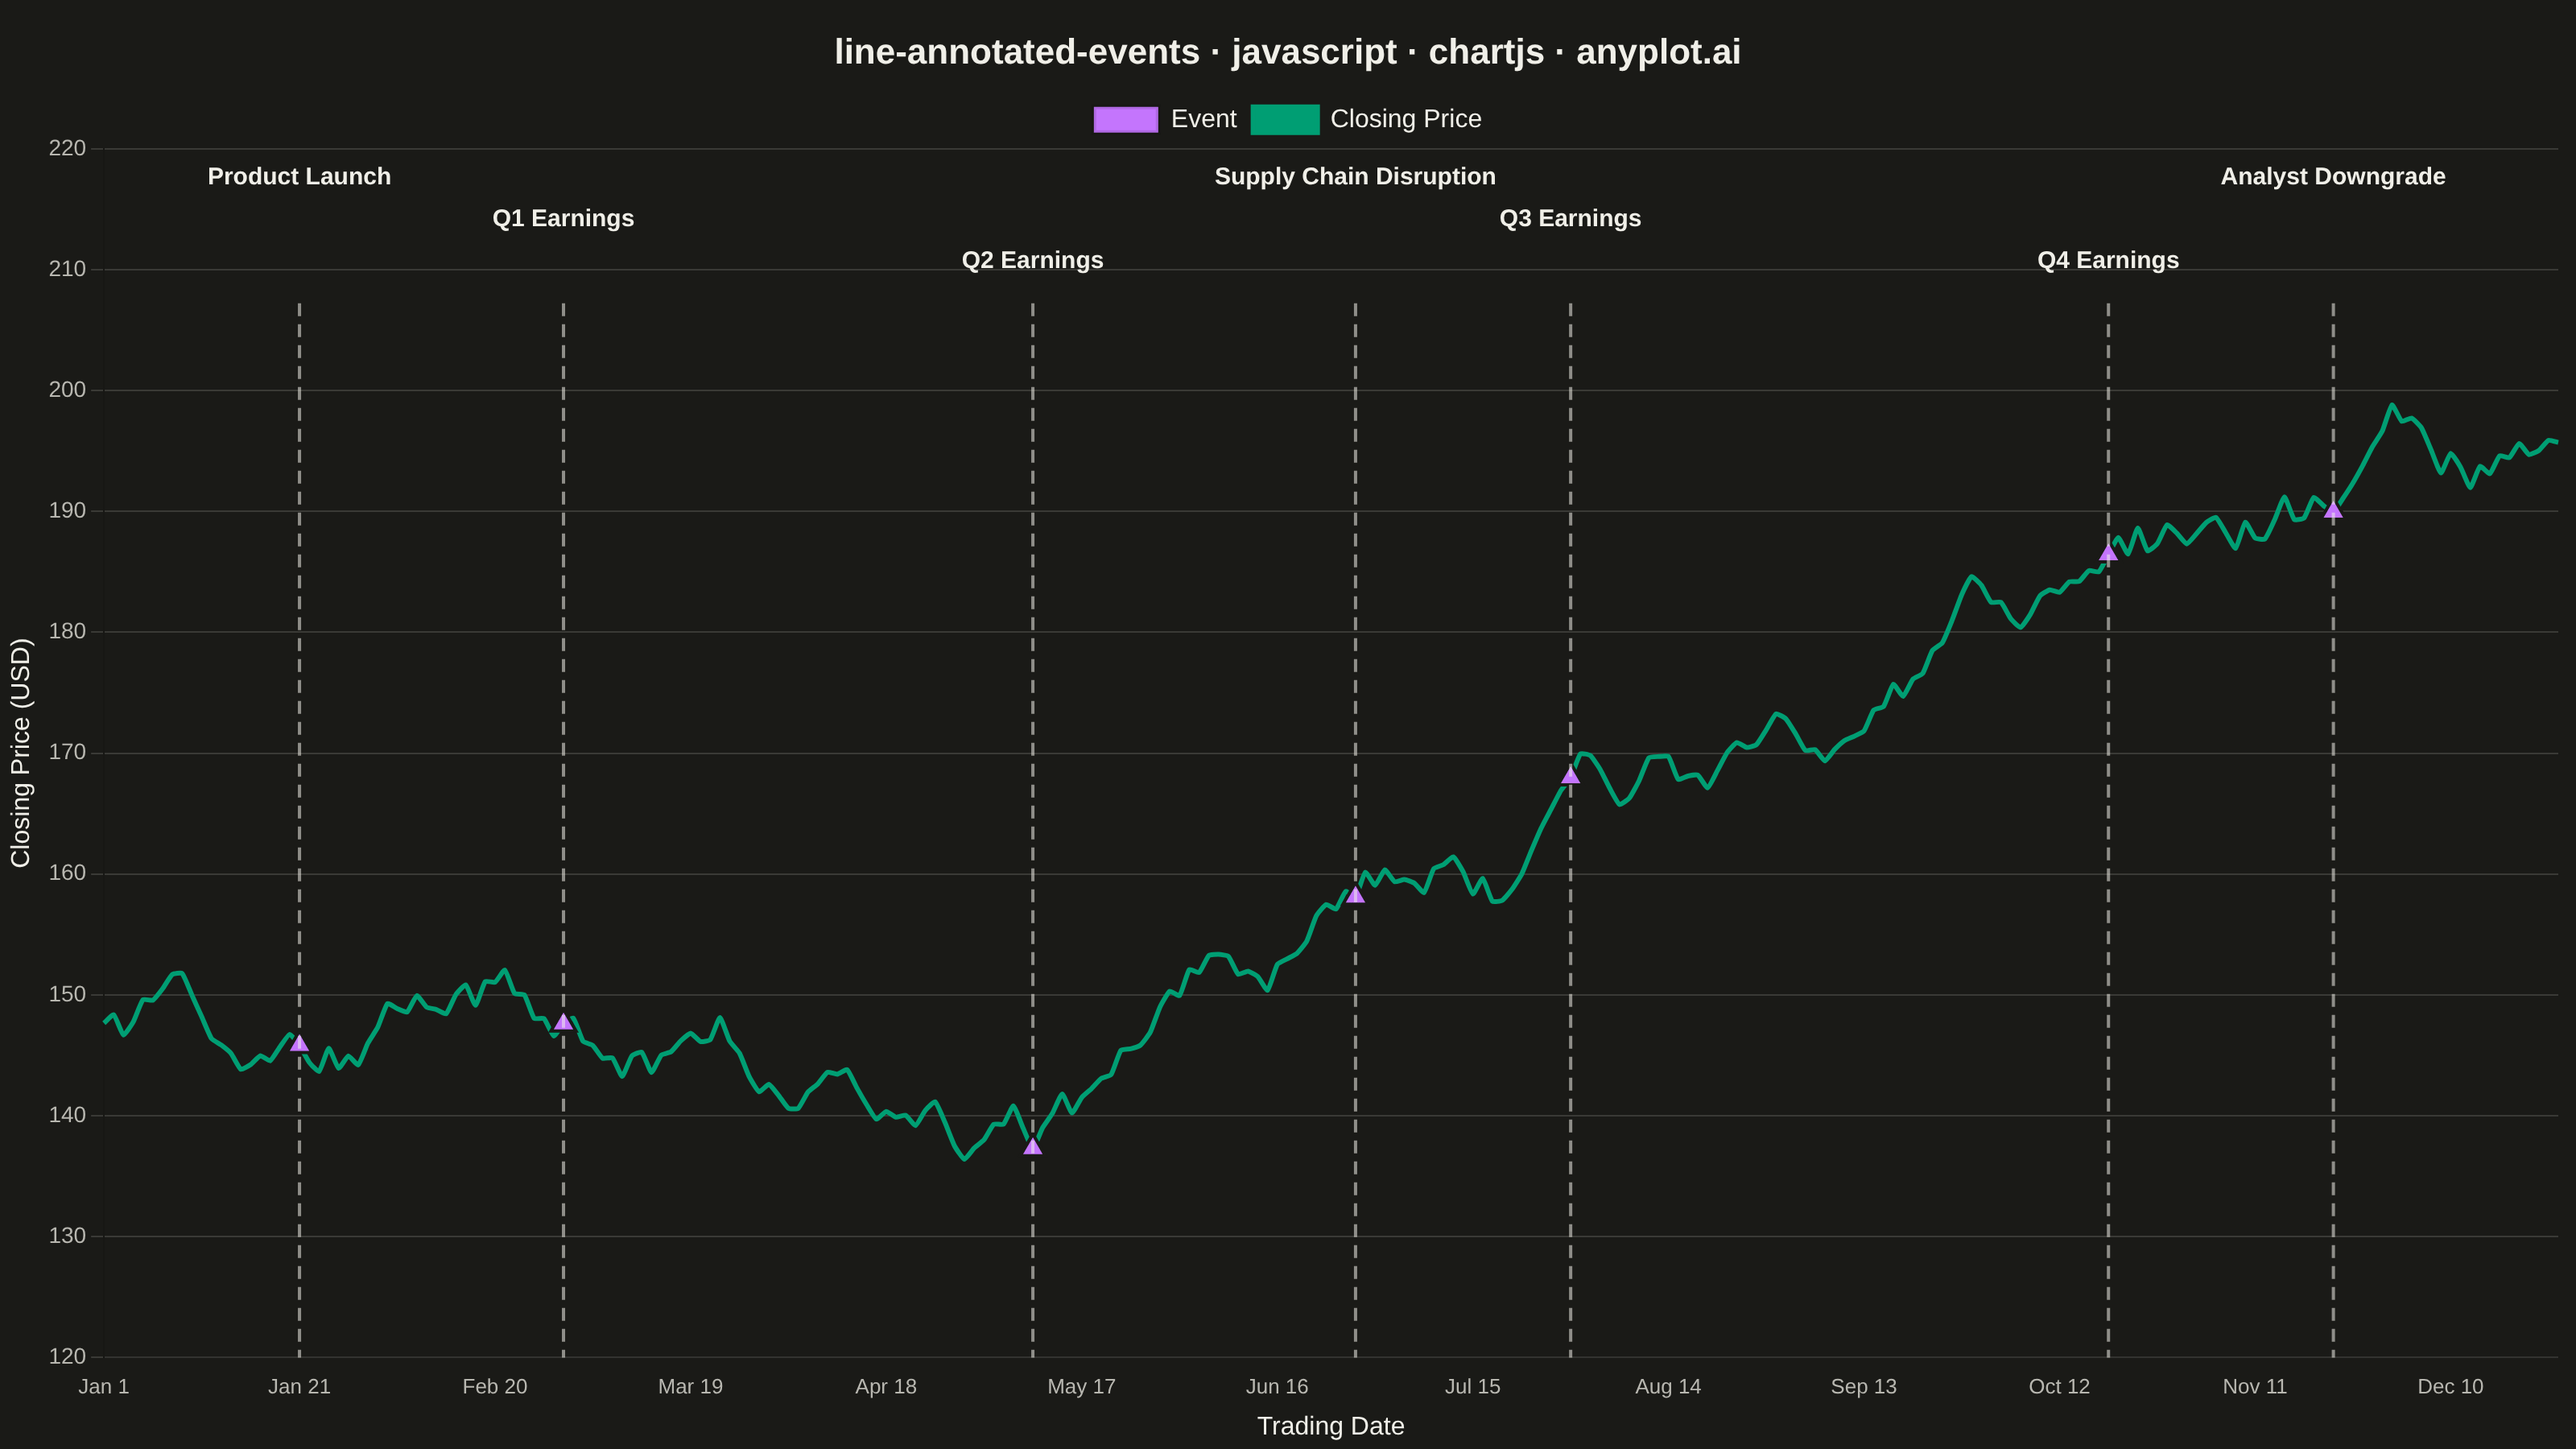
A line plot with annotations at key points marking important events or milestones. This visualization enhances time series data by highlighting significant occurrences such as product launches, policy changes, or market events directly on the chart. Vertical lines, markers, and text labels draw attention to specific moments in time, making it easy to correlate data trends with real-world events.
// anyplot.ai
// line-annotated-events: Annotated Line Plot with Event Markers
// Library: chartjs 4.4.7 | JavaScript 22.23.2
// Quality: 92/100 | Created: 2026-09-05

const t = window.ANYPLOT_TOKENS;

// --- Data (in-memory, deterministic fixed-seed LCG) -------------------------
// Daily closing price of a fictional tech company over one trading year, with
// quarterly earnings and other corporate milestones marked as events.
let seed = 20260905;
function lcg() {
  seed = (seed * 1664525 + 1013904223) % 4294967296;
  return seed / 4294967296;
}

const MONTHS = ["Jan", "Feb", "Mar", "Apr", "May", "Jun", "Jul", "Aug", "Sep", "Oct", "Nov", "Dec"];
const TRADING_DAYS = 252;
const labels = [];
const prices = [];
let price = 148;
for (let i = 0; i < TRADING_DAYS; i += 1) {
  const month = Math.floor(i / 21);
  const day = (i % 21) + 1;
  labels.push(`${MONTHS[Math.min(month, 11)]} ${day}`);
  price += (lcg() - 0.48) * 4.2;
  price = Math.max(price, 60);
  prices.push(Math.round(price * 100) / 100);
}

const events = [
  { index: 20, label: "Product Launch" },
  { index: 47, label: "Q1 Earnings" },
  { index: 95, label: "Q2 Earnings" },
  { index: 128, label: "Supply Chain Disruption" },
  { index: 150, label: "Q3 Earnings" },
  { index: 205, label: "Q4 Earnings" },
  { index: 228, label: "Analyst Downgrade" },
];

const eventMarkers = labels.map(() => null);
events.forEach((event) => {
  eventMarkers[event.index] = prices[event.index];
});

const maxPrice = Math.max(...prices);
const minPrice = Math.min(...prices);

// --- Mount -------------------------------------------------------------------
const canvas = document.createElement("canvas");
document.getElementById("container").appendChild(canvas);

// --- Custom plugin: dashed vertical event lines + alternating labels --------
// Chart.js core has no built-in annotation support; the harness only vendors
// the core UMD bundle (no chartjs-plugin-annotation). Drawing directly on the
// canvas via a plugin's afterDraw hook is a native, fully-supported Chart.js
// extension mechanism, not a workaround.
const eventLinePlugin = {
  id: "eventLines",
  afterDraw(chart) {
    const { ctx, chartArea, scales } = chart;
    const xScale = scales.x;
    const labelRows = 3;
    const labelBandHeight = 18 + labelRows * 26;
    ctx.save();
    events.forEach((event, i) => {
      const xPixel = xScale.getPixelForValue(event.index);
      if (xPixel < chartArea.left || xPixel > chartArea.right) return;

      // Line starts below the label band so dashes never cross the text.
      ctx.beginPath();
      ctx.setLineDash([8, 5]);
      ctx.lineWidth = 2;
      ctx.strokeStyle = t.ink;
      ctx.globalAlpha = 0.55;
      ctx.moveTo(xPixel, chartArea.top + labelBandHeight);
      ctx.lineTo(xPixel, chartArea.bottom);
      ctx.stroke();
      ctx.setLineDash([]);
      ctx.globalAlpha = 1;

      const row = i % labelRows;
      const labelY = chartArea.top + 18 + row * 26;
      ctx.fillStyle = t.ink;
      ctx.font = "600 15px sans-serif";
      ctx.textAlign = "center";
      ctx.fillText(event.label, xPixel, labelY);
    });
    ctx.restore();
  },
};

// --- Chart -------------------------------------------------------------------
new Chart(canvas, {
  type: "line",
  data: {
    labels,
    datasets: [
      {
        label: "Closing Price",
        data: prices,
        borderColor: t.palette[0],
        backgroundColor: t.palette[0],
        borderWidth: 3,
        pointRadius: 0,
        tension: 0.15,
        order: 2,
      },
      {
        label: "Event",
        data: eventMarkers,
        showLine: false,
        pointStyle: "triangle",
        pointRadius: 9,
        backgroundColor: t.palette[1],
        pointBackgroundColor: t.palette[1],
        pointBorderColor: t.pageBg,
        pointBorderWidth: 2,
        order: 1,
      },
    ],
  },
  options: {
    responsive: true,
    maintainAspectRatio: false,
    animation: false,
    layout: {
      padding: { top: 10 },
    },
    plugins: {
      title: {
        display: true,
        text: "line-annotated-events · javascript · chartjs · anyplot.ai",
        color: t.ink,
        font: { size: 22 },
      },
      legend: {
        labels: { color: t.ink, font: { size: 16 } },
      },
    },
    scales: {
      x: {
        ticks: { color: t.inkSoft, font: { size: 13 }, autoSkip: true, maxTicksLimit: 13, maxRotation: 0 },
        grid: { display: false },
        title: { display: true, text: "Trading Date", color: t.ink, font: { size: 16 } },
      },
      y: {
        ticks: { color: t.inkSoft, font: { size: 14 } },
        grid: { color: t.grid },
        title: { display: true, text: "Closing Price (USD)", color: t.ink, font: { size: 16 } },
        min: Math.floor((minPrice - 8) / 10) * 10,
        suggestedMax: Math.ceil((maxPrice + (maxPrice - minPrice) * 0.28) / 10) * 10,
      },
    },
  },
  plugins: [eventLinePlugin],
});
Runnable source as JSON, for any HTTP client: https://api.anyplot.ai/specs/line-annotated-events/chartjs/code. Any spec id and library id listed in llms-full.txt fit the same URL shape; every URL below is complete and callable.
{
  "spec_id": "line-annotated-events",
  "language": "javascript",
  "library": "chartjs",
  "page": "https://anyplot.ai/line-annotated-events/javascript/chartjs",
  "hub": "https://anyplot.ai/line-annotated-events",
  "code_json": "https://api.anyplot.ai/specs/line-annotated-events/chartjs/code",
  "spec_json": "https://api.anyplot.ai/specs/line-annotated-events",
  "render_light_png": "https://storage.googleapis.com/anyplot-images/plots/line-annotated-events/javascript/chartjs/plot-light.png",
  "render_dark_png": "https://storage.googleapis.com/anyplot-images/plots/line-annotated-events/javascript/chartjs/plot-dark.png",
  "interactive_light_html": "https://storage.googleapis.com/anyplot-images/plots/line-annotated-events/javascript/chartjs/plot-light.html",
  "interactive_dark_html": "https://storage.googleapis.com/anyplot-images/plots/line-annotated-events/javascript/chartjs/plot-dark.html",
  "quality_score": 92.0,
  "license": "MIT",
  "guide": "https://anyplot.ai/llms.txt"
}
Part of Annotated Line Plot with Event Markers on anyplot.ai.