The same plot in 14 other libraries — JavaScript: Chart.js, D3.js, Apache ECharts, MUI X Charts; Python: Altair, Bokeh, lets-plot, Matplotlib, Plotly, plotnine, Pygal, Seaborn; R: ggplot2; Julia: Makie.jl. Compare all 15 side by side: Annotated Line Plot with Event Markers in Python, R, Julia and JavaScript.
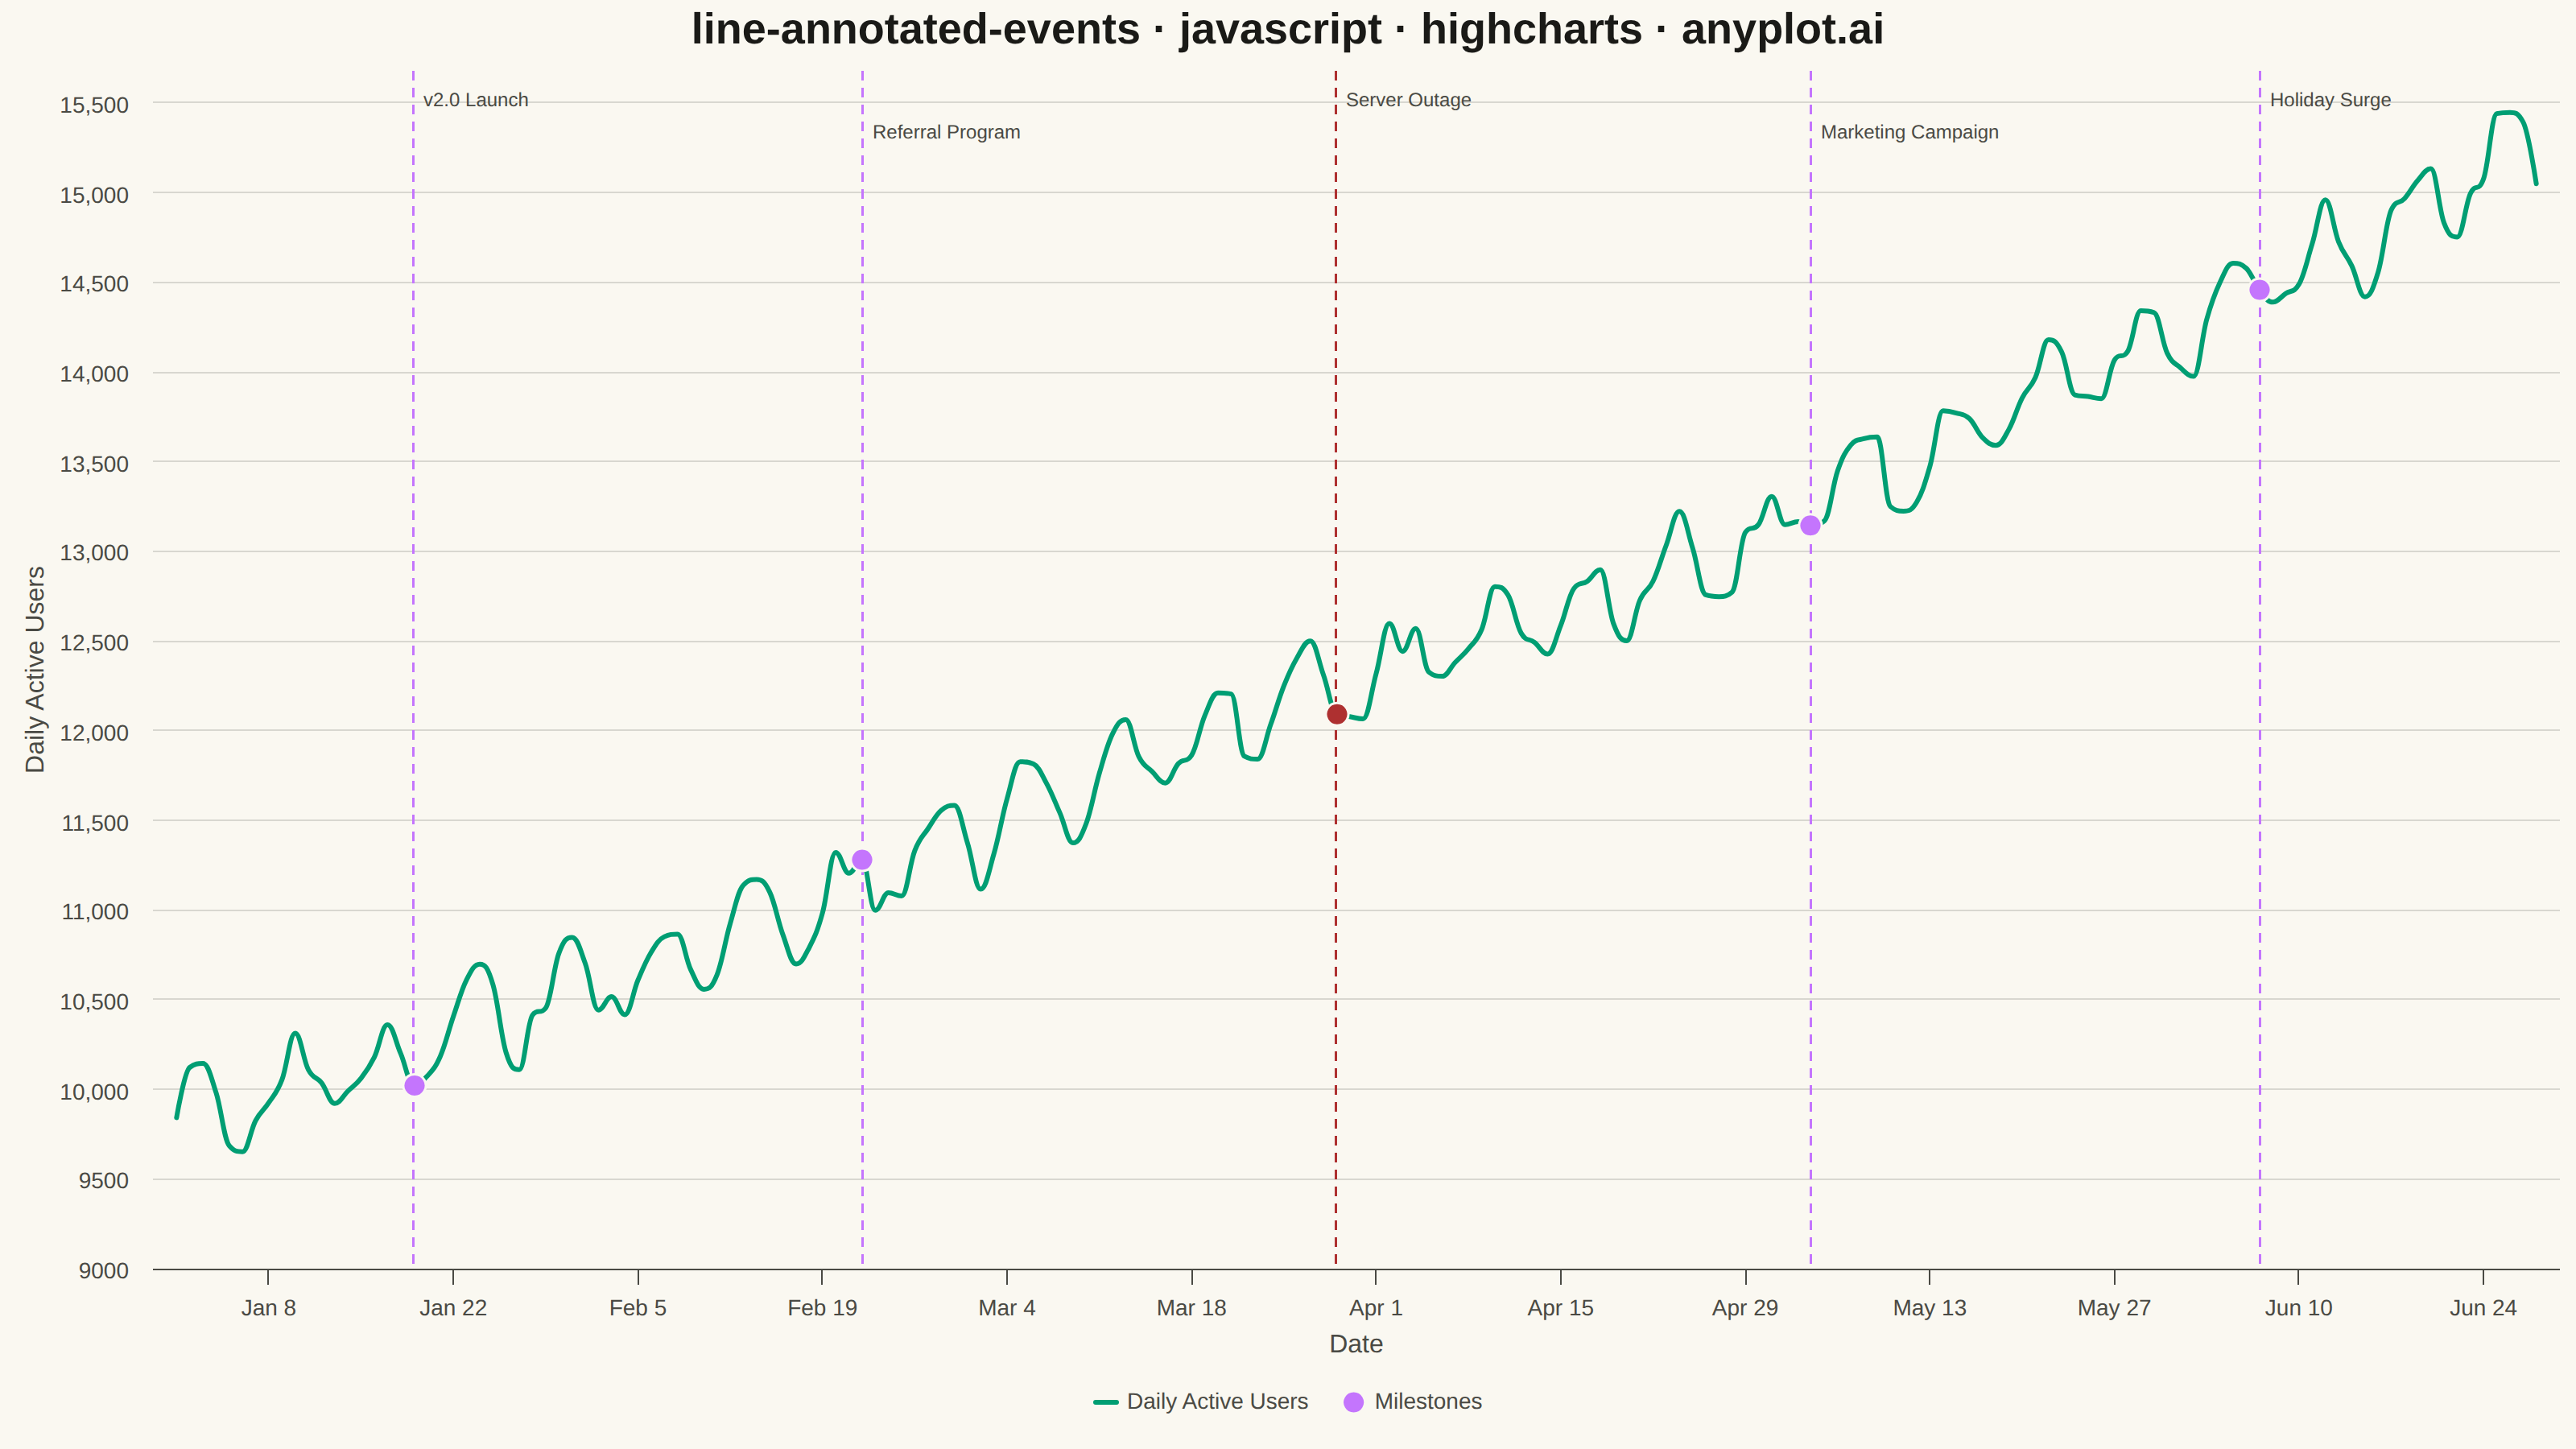
A line plot with annotations at key points marking important events or milestones. This visualization enhances time series data by highlighting significant occurrences such as product launches, policy changes, or market events directly on the chart. Vertical lines, markers, and text labels draw attention to specific moments in time, making it easy to correlate data trends with real-world events.
// anyplot.ai
// line-annotated-events: Annotated Line Plot with Event Markers
// Library: highcharts 12.6.0 | JavaScript 22.23.2
// Quality: 88/100 | Created: 2026-09-05

const t = window.ANYPLOT_TOKENS;

// --- Data (in-memory, deterministic) ----------------------------------------
// Tiny fixed-seed LCG — the browser has no seeded RNG.
let lcgState = 42;
function lcgRandom() {
  lcgState = (lcgState * 1103515245 + 12345) & 0x7fffffff;
  return lcgState / 0x7fffffff;
}

const dayMs = 24 * 60 * 60 * 1000;
const startDate = Date.UTC(2024, 0, 1);
const numDays = 180;

// Milestones that shift the daily-active-users trajectory.
const events = [
  { day: 18, label: "v2.0 Launch", stepGain: 55 },
  { day: 52, label: "Referral Program", stepGain: 35 },
  { day: 88, label: "Server Outage", stepGain: -70 },
  { day: 124, label: "Marketing Campaign", stepGain: 60 },
  { day: 158, label: "Holiday Surge", stepGain: 40 },
];

const dailyActiveUsers = [];
let growthRate = 20;
let level = 9800;
for (let day = 0; day < numDays; day++) {
  const milestone = events.find((e) => e.day === day);
  if (milestone) growthRate += milestone.stepGain > 0 ? 6 : -4;

  const weeklySeasonality = Math.sin((day / 7) * 2 * Math.PI) * 220;
  const noise = (lcgRandom() - 0.5) * 260;
  level += growthRate + (lcgRandom() - 0.5) * 8;
  if (milestone) level += milestone.stepGain;

  const value = Math.round(level + weeklySeasonality + noise);
  dailyActiveUsers.push([startDate + day * dayMs, value]);
}

// Positive milestones stay brand-lavender; the one negative event (the outage)
// gets the Imprint semantic-red anchor so color reinforces the up/down story.
const eventColor = (e) => (e.stepGain < 0 ? t.palette[4] : t.palette[1]);

const eventPoints = events.map((e) => ({
  x: startDate + e.day * dayMs,
  y: dailyActiveUsers[e.day][1],
  color: eventColor(e),
}));

// --- Chart -------------------------------------------------------------------
Highcharts.chart("container", {
  chart: {
    type: "spline",
    backgroundColor: "transparent",
    animation: false,
    spacingTop: 4,
    style: { fontFamily: "inherit" },
  },
  credits: { enabled: false },
  colors: t.palette,
  title: {
    text: "line-annotated-events · javascript · highcharts · anyplot.ai",
    margin: 10,
    style: { color: t.ink, fontSize: "27px", fontWeight: "600" },
  },
  xAxis: {
    type: "datetime",
    lineColor: t.inkSoft,
    tickColor: t.inkSoft,
    gridLineColor: t.grid,
    labels: { style: { color: t.inkSoft, fontSize: "14px" } },
    title: { text: "Date", style: { color: t.inkSoft, fontSize: "16px" } },
    plotLines: events.map((e, i) => ({
      value: startDate + e.day * dayMs,
      color: eventColor(e),
      dashStyle: "Dash",
      width: 1.5,
      zIndex: 1,
      label: {
        text: e.label,
        rotation: 0,
        align: "left",
        x: 6,
        y: i % 2 === 0 ? 22 : 42,
        style: { color: t.inkSoft, fontSize: "12px" },
      },
    })),
  },
  yAxis: {
    title: {
      text: "Daily Active Users",
      style: { color: t.inkSoft, fontSize: "16px" },
    },
    gridLineColor: t.grid,
    labels: { style: { color: t.inkSoft, fontSize: "14px" } },
    maxPadding: 0.04,
    endOnTick: false,
  },
  legend: {
    enabled: true,
    itemStyle: { color: t.inkSoft, fontSize: "14px" },
    itemHoverStyle: { color: t.ink },
  },
  plotOptions: {
    series: { animation: false },
    spline: { lineWidth: 3, marker: { enabled: false } },
  },
  series: [
    {
      name: "Daily Active Users",
      data: dailyActiveUsers,
      color: t.palette[0],
      zIndex: 1,
    },
    {
      type: "scatter",
      name: "Milestones",
      data: eventPoints,
      color: t.palette[1],
      marker: { radius: 7, symbol: "circle", lineWidth: 1.5, lineColor: t.pageBg },
      zIndex: 10,
      // legend swatch stays lavender for the series as a whole; the one
      // negative event (Server Outage) overrides its own marker color above.
    },
  ],
});
Runnable source as JSON, for any HTTP client: https://api.anyplot.ai/specs/line-annotated-events/highcharts/code. Any spec id and library id listed in llms-full.txt fit the same URL shape; every URL below is complete and callable.
{
  "spec_id": "line-annotated-events",
  "language": "javascript",
  "library": "highcharts",
  "page": "https://anyplot.ai/line-annotated-events/javascript/highcharts",
  "hub": "https://anyplot.ai/line-annotated-events",
  "code_json": "https://api.anyplot.ai/specs/line-annotated-events/highcharts/code",
  "spec_json": "https://api.anyplot.ai/specs/line-annotated-events",
  "render_light_png": "https://storage.googleapis.com/anyplot-images/plots/line-annotated-events/javascript/highcharts/plot-light.png",
  "render_dark_png": "https://storage.googleapis.com/anyplot-images/plots/line-annotated-events/javascript/highcharts/plot-dark.png",
  "interactive_light_html": "https://storage.googleapis.com/anyplot-images/plots/line-annotated-events/javascript/highcharts/plot-light.html",
  "interactive_dark_html": "https://storage.googleapis.com/anyplot-images/plots/line-annotated-events/javascript/highcharts/plot-dark.html",
  "quality_score": 88.0,
  "license": "MIT",
  "guide": "https://anyplot.ai/llms.txt"
}
Part of Annotated Line Plot with Event Markers on anyplot.ai.