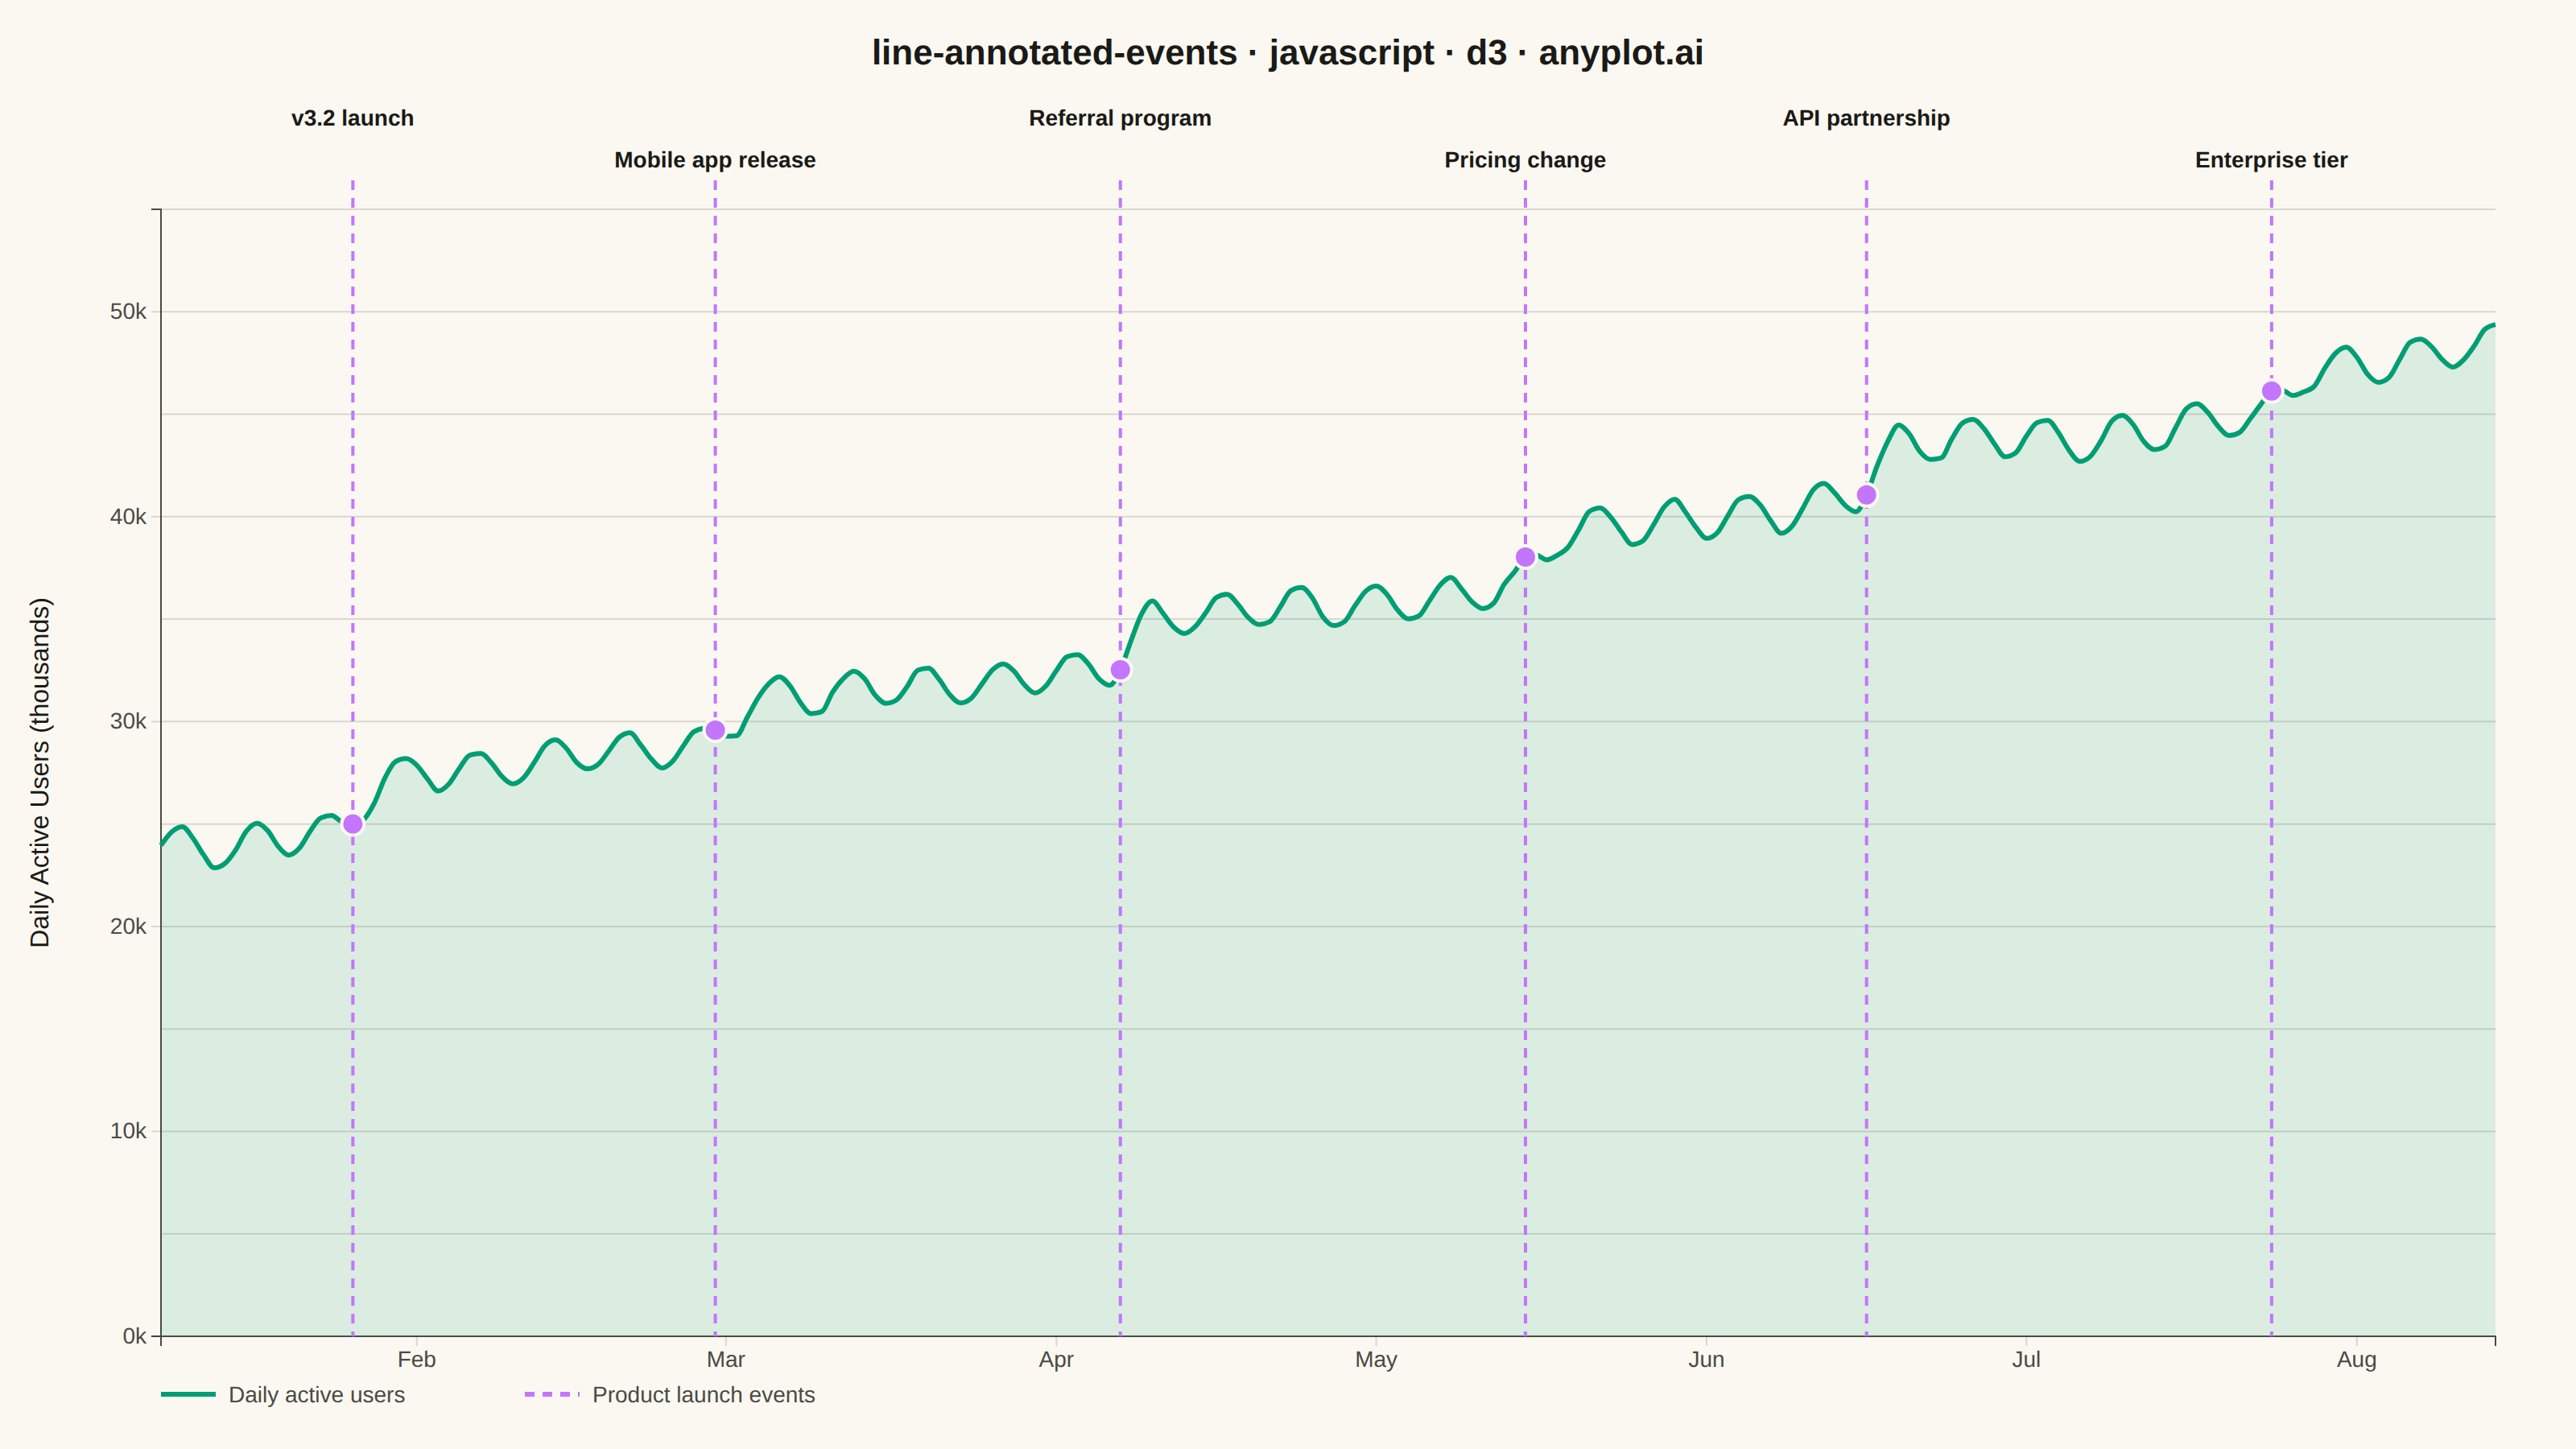
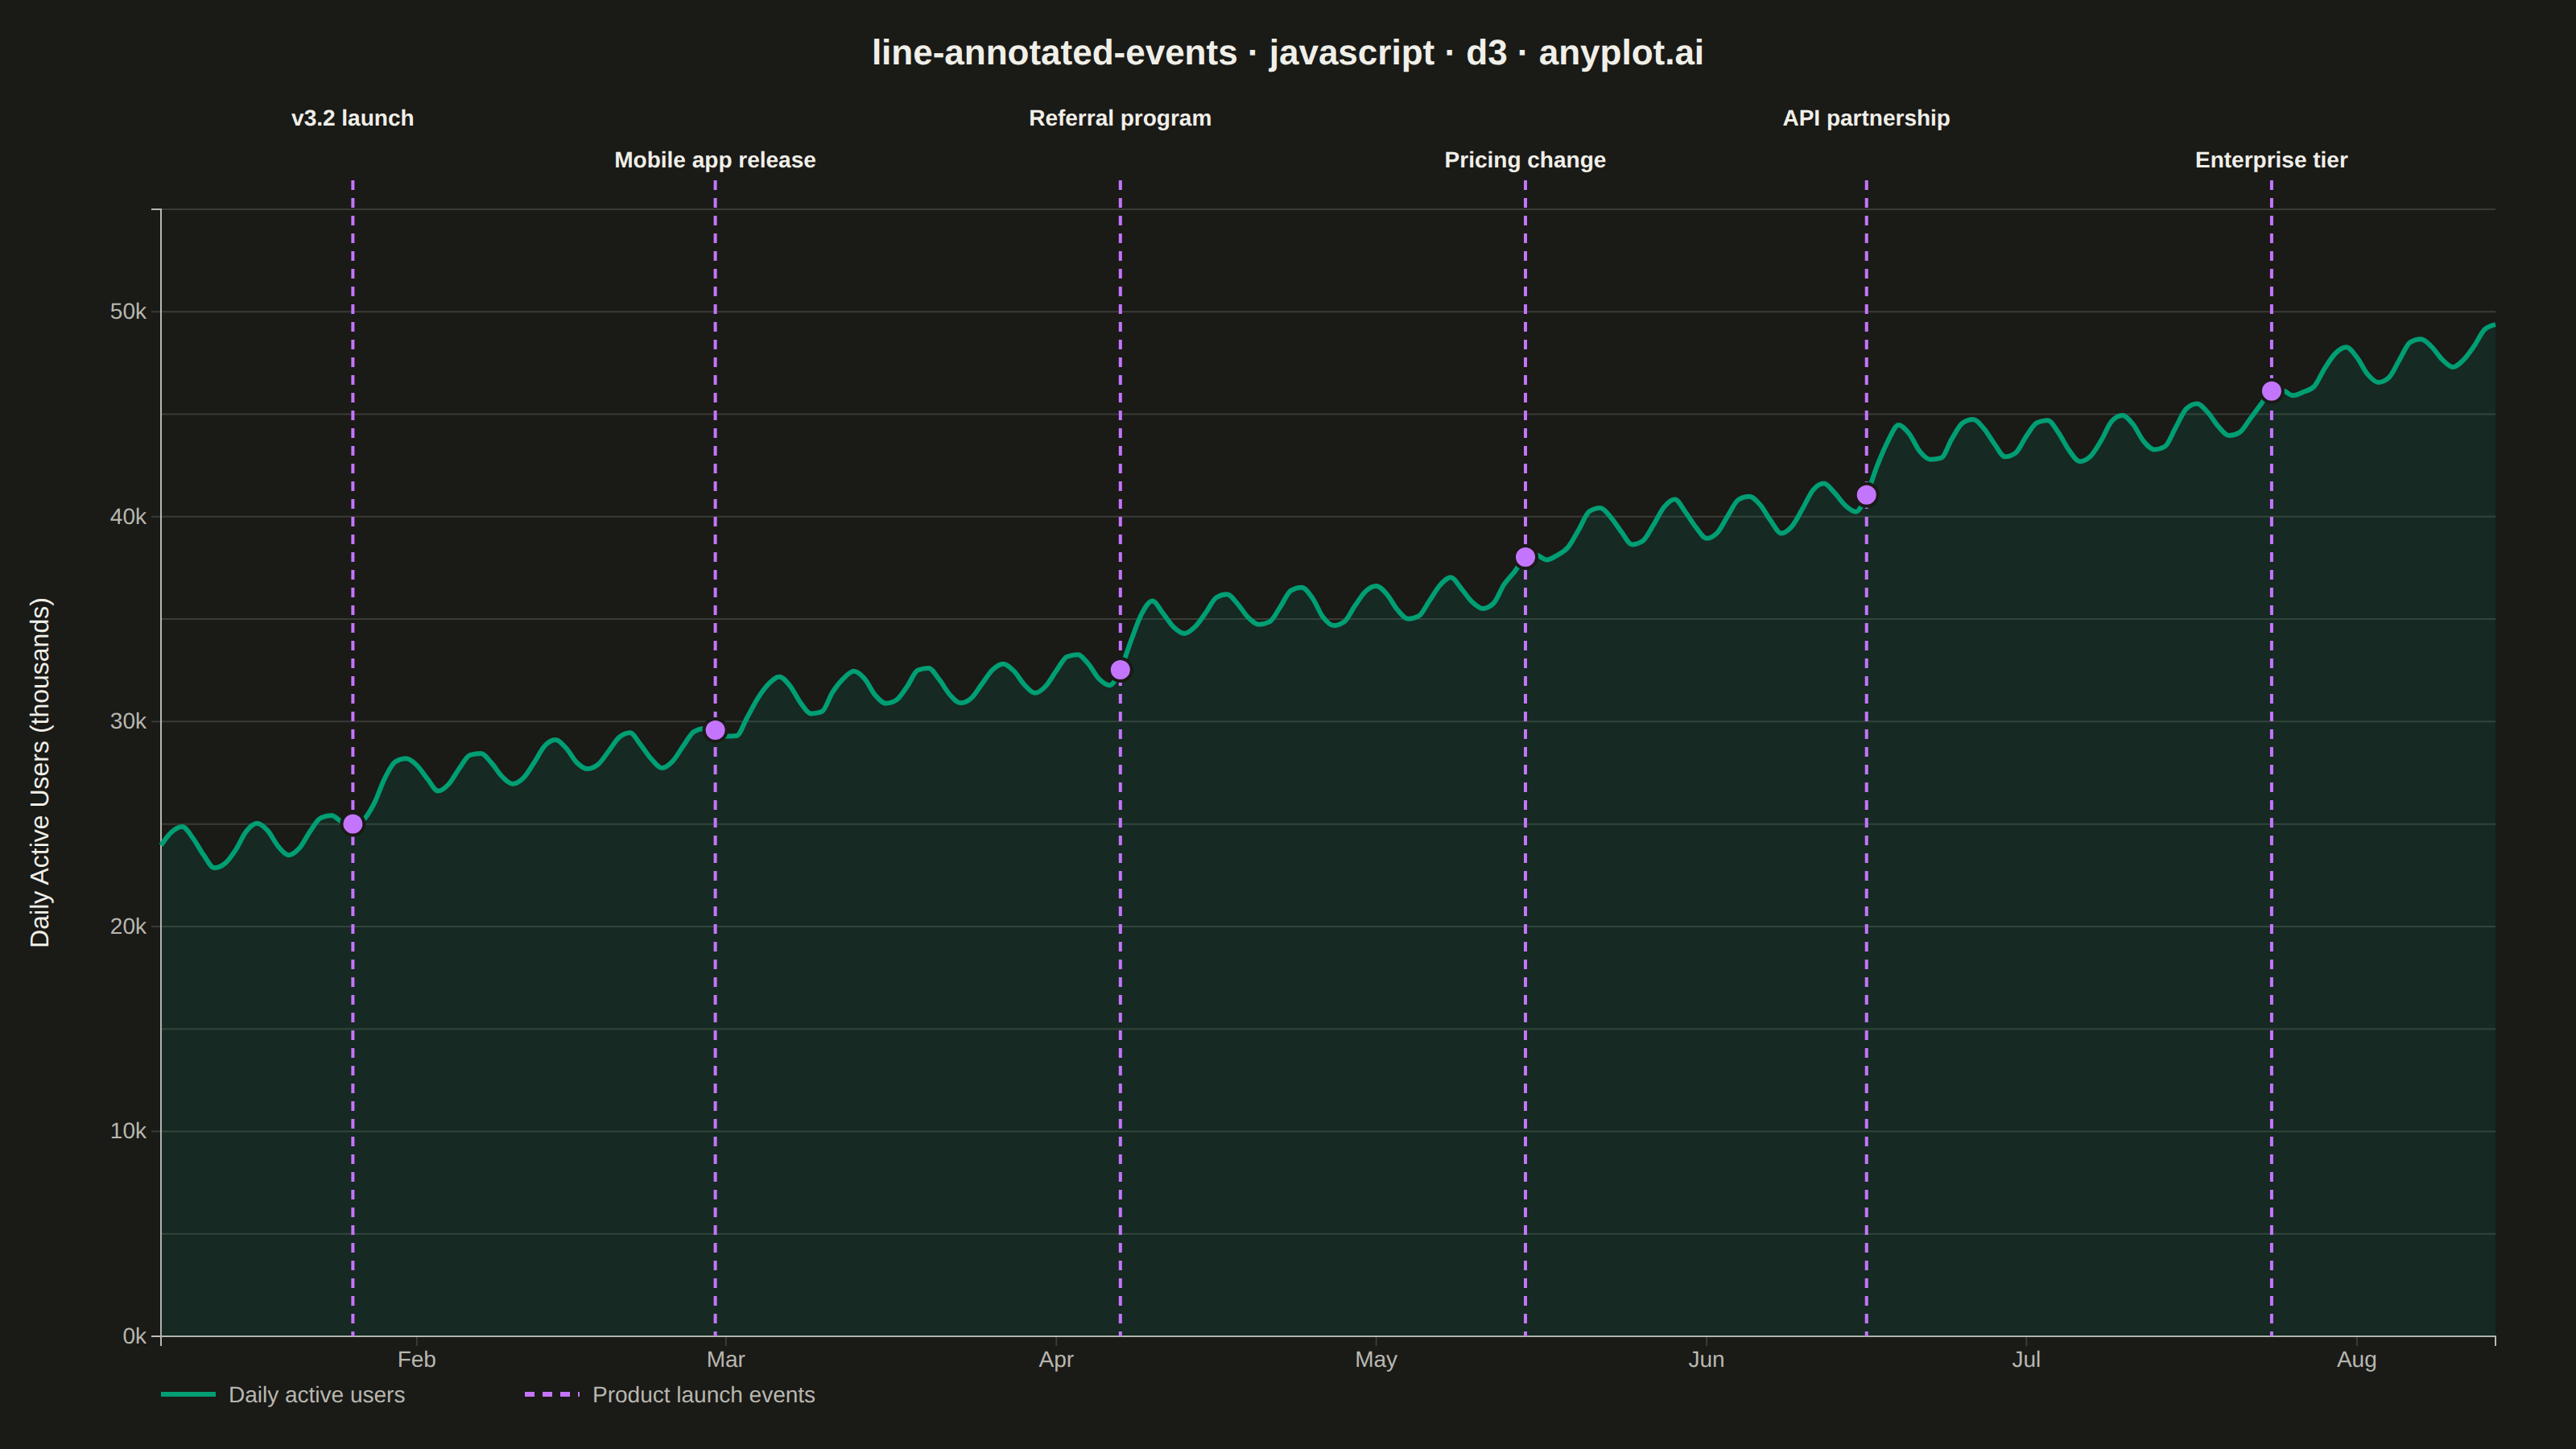
The same plot in 14 other libraries — JavaScript: Chart.js, Apache ECharts, Highcharts, MUI X Charts; Python: Altair, Bokeh, lets-plot, Matplotlib, Plotly, plotnine, Pygal, Seaborn; R: ggplot2; Julia: Makie.jl. Compare all 15 side by side: Annotated Line Plot with Event Markers in Python, R, Julia and JavaScript.
A line plot with annotations at key points marking important events or milestones. This visualization enhances time series data by highlighting significant occurrences such as product launches, policy changes, or market events directly on the chart. Vertical lines, markers, and text labels draw attention to specific moments in time, making it easy to correlate data trends with real-world events.
// anyplot.ai
// line-annotated-events: Annotated Line Plot with Event Markers
// Library: d3 7.9.0 | JavaScript 22.23.2
// Quality: 94/100 | Created: 2026-09-05

const t = window.ANYPLOT_TOKENS;
const { width, height } = window.ANYPLOT_SIZE;
const margin = { top: 130, right: 50, bottom: 70, left: 100 };
const iw = width - margin.left - margin.right;
const ih = height - margin.top - margin.bottom;

// --- Data (in-memory, deterministic) ----------------------------------------
// Fixed-seed LCG — the browser has no seeded Math.random().
let seed = 42;
function rand() {
  seed = (seed * 1664525 + 1013904223) % 4294967296;
  return seed / 4294967296;
}

const NUM_DAYS = 220;
const START_DATE = new Date(2024, 0, 8);
const EVENTS = [
  { day: 18, label: "v3.2 launch" },
  { day: 52, label: "Mobile app release" },
  { day: 90, label: "Referral program" },
  { day: 128, label: "Pricing change" },
  { day: 160, label: "API partnership" },
  { day: 198, label: "Enterprise tier" },
];

let dailyActiveUsers = 24; // thousands
const series = [];
for (let day = 0; day < NUM_DAYS; day++) {
  const date = new Date(START_DATE);
  date.setDate(date.getDate() + day);
  const seasonal = 0.95 * Math.sin((day / 7) * Math.PI * 2);
  const noise = (rand() - 0.5) * 1.1;
  const launchBoost = EVENTS.some((e) => day >= e.day && day < e.day + 4) ? 0.55 : 0;
  dailyActiveUsers += 0.045 + launchBoost + noise * 0.3;
  series.push({ date, value: Math.max(dailyActiveUsers + seasonal, 1) });
}

const eventPoints = EVENTS.map((e) => {
  const date = new Date(START_DATE);
  date.setDate(date.getDate() + e.day);
  return { date, label: e.label, value: series[e.day].value };
});

// --- SVG mount ---------------------------------------------------------------
const svg = d3.select("#container").append("svg").attr("width", width).attr("height", height);
const g = svg.append("g").attr("transform", `translate(${margin.left},${margin.top})`);

// --- Scales ------------------------------------------------------------------
const x = d3
  .scaleTime()
  .domain(d3.extent(series, (d) => d.date))
  .range([0, iw]);
const y = d3
  .scaleLinear()
  .domain([0, d3.max(series, (d) => d.value) * 1.08])
  .nice()
  .range([ih, 0]);

// --- Gridlines (y-axis only, per style guide) --------------------------------
g.append("g")
  .call(d3.axisLeft(y).tickSize(-iw).tickFormat(""))
  .call((sel) => sel.select(".domain").remove())
  .selectAll("line")
  .attr("stroke", t.grid);

// --- Axes ----------------------------------------------------------------------
// Multi-scale date format: spell out the year only when a tick crosses into a
// new year, otherwise show the month abbreviation.
const formatMonth = d3.timeFormat("%b");
const formatMonthYear = d3.timeFormat("%b %Y");
const monthTickFormat = (date) => (d3.timeYear(date) < date ? formatMonth(date) : formatMonthYear(date));

const xAxis = g
  .append("g")
  .attr("transform", `translate(0,${ih})`)
  .call(d3.axisBottom(x).ticks(d3.timeMonth.every(1)).tickFormat(monthTickFormat));
const yAxis = g.append("g").call(d3.axisLeft(y).ticks(6).tickFormat((d) => `${d}k`));
for (const ax of [xAxis, yAxis]) {
  ax.selectAll("text").attr("fill", t.inkSoft).style("font-size", "14px");
  ax.selectAll("line").attr("stroke", t.grid);
  ax.select(".domain").attr("stroke", t.inkSoft);
}

// --- Y-axis label --------------------------------------------------------------
g.append("text")
  .attr("transform", "rotate(-90)")
  .attr("x", -ih / 2)
  .attr("y", -70)
  .attr("text-anchor", "middle")
  .attr("fill", t.ink)
  .style("font-size", "16px")
  .text("Daily Active Users (thousands)");

// --- Area fill: subtle wash under the trend line for extra polish -----------
const area = d3
  .area()
  .x((d) => x(d.date))
  .y0(ih)
  .y1((d) => y(d.value))
  .curve(d3.curveMonotoneX);
g.append("path").datum(series).attr("fill", t.palette[0]).attr("fill-opacity", 0.12).attr("d", area);

// --- Event markers: dashed reference lines + alternating labels -------------
// Built via D3's idiomatic selection.data(...).join(...) pattern rather than
// a manual forEach + append loop.
const eventColor = t.palette[1];
const labelRowY = [78, 104];
const eventGroup = svg.append("g");

eventGroup
  .selectAll("line.event-line")
  .data(eventPoints)
  .join("line")
  .attr("class", "event-line")
  .attr("x1", (d) => margin.left + x(d.date))
  .attr("x2", (d) => margin.left + x(d.date))
  .attr("y1", margin.top - 18)
  .attr("y2", margin.top + ih)
  .attr("stroke", eventColor)
  .attr("stroke-width", 2)
  .attr("stroke-dasharray", "6,5");

eventGroup
  .selectAll("circle.event-marker")
  .data(eventPoints)
  .join("circle")
  .attr("class", "event-marker")
  .attr("cx", (d) => margin.left + x(d.date))
  .attr("cy", (d) => margin.top + y(d.value))
  .attr("r", 7)
  .attr("fill", eventColor)
  .attr("stroke", t.pageBg)
  .attr("stroke-width", 2);

eventGroup
  .selectAll("text.event-label")
  .data(eventPoints)
  .join("text")
  .attr("class", "event-label")
  .attr("x", (d) => margin.left + x(d.date))
  .attr("y", (d, i) => labelRowY[i % 2])
  .attr("text-anchor", "middle")
  .attr("fill", t.ink)
  .style("font-size", "14px")
  .style("font-weight", "600")
  .text((d) => d.label);

// --- Line ------------------------------------------------------------------------
const line = d3
  .line()
  .x((d) => x(d.date))
  .y((d) => y(d.value))
  .curve(d3.curveMonotoneX);
g.append("path")
  .datum(series)
  .attr("fill", "none")
  .attr("stroke", t.palette[0])
  .attr("stroke-width", 3)
  .attr("d", line);

// --- Legend ------------------------------------------------------------------------
const legend = svg.append("g").attr("transform", `translate(${margin.left},${height - 34})`);
const legendItems = [
  { label: "Daily active users", color: t.palette[0], dashed: false },
  { label: "Product launch events", color: eventColor, dashed: true },
];
let lx = 0;
legendItems.forEach((item) => {
  legend
    .append("line")
    .attr("x1", lx)
    .attr("x2", lx + 34)
    .attr("y1", 0)
    .attr("y2", 0)
    .attr("stroke", item.color)
    .attr("stroke-width", 3)
    .attr("stroke-dasharray", item.dashed ? "6,5" : null);
  legend
    .append("text")
    .attr("x", lx + 42)
    .attr("y", 5)
    .attr("fill", t.inkSoft)
    .style("font-size", "14px")
    .text(item.label);
  lx += 42 + item.label.length * 8 + 40;
});

// --- Title ---------------------------------------------------------------------------
svg
  .append("text")
  .attr("x", width / 2)
  .attr("y", 40)
  .attr("text-anchor", "middle")
  .attr("fill", t.ink)
  .style("font-size", "22px")
  .style("font-weight", "600")
  .text("line-annotated-events · javascript · d3 · anyplot.ai");
Runnable source as JSON, for any HTTP client: https://api.anyplot.ai/specs/line-annotated-events/d3/code. Any spec id and library id listed in llms-full.txt fit the same URL shape; every URL below is complete and callable.
{
  "spec_id": "line-annotated-events",
  "language": "javascript",
  "library": "d3",
  "page": "https://anyplot.ai/line-annotated-events/javascript/d3",
  "hub": "https://anyplot.ai/line-annotated-events",
  "code_json": "https://api.anyplot.ai/specs/line-annotated-events/d3/code",
  "spec_json": "https://api.anyplot.ai/specs/line-annotated-events",
  "render_light_png": "https://storage.googleapis.com/anyplot-images/plots/line-annotated-events/javascript/d3/plot-light.png",
  "render_dark_png": "https://storage.googleapis.com/anyplot-images/plots/line-annotated-events/javascript/d3/plot-dark.png",
  "interactive_light_html": "https://storage.googleapis.com/anyplot-images/plots/line-annotated-events/javascript/d3/plot-light.html",
  "interactive_dark_html": "https://storage.googleapis.com/anyplot-images/plots/line-annotated-events/javascript/d3/plot-dark.html",
  "quality_score": 94.0,
  "license": "MIT",
  "guide": "https://anyplot.ai/llms.txt"
}
Part of Annotated Line Plot with Event Markers on anyplot.ai.