The same plot in 14 other libraries — Python: Altair, Bokeh, lets-plot, Matplotlib, Plotly, plotnine, Pygal, Seaborn; R: ggplot2; JavaScript: Chart.js, D3.js, Apache ECharts, Highcharts, MUI X Charts. Compare all 15 side by side: Annotated Line Plot with Event Markers in Python, R, Julia and JavaScript.
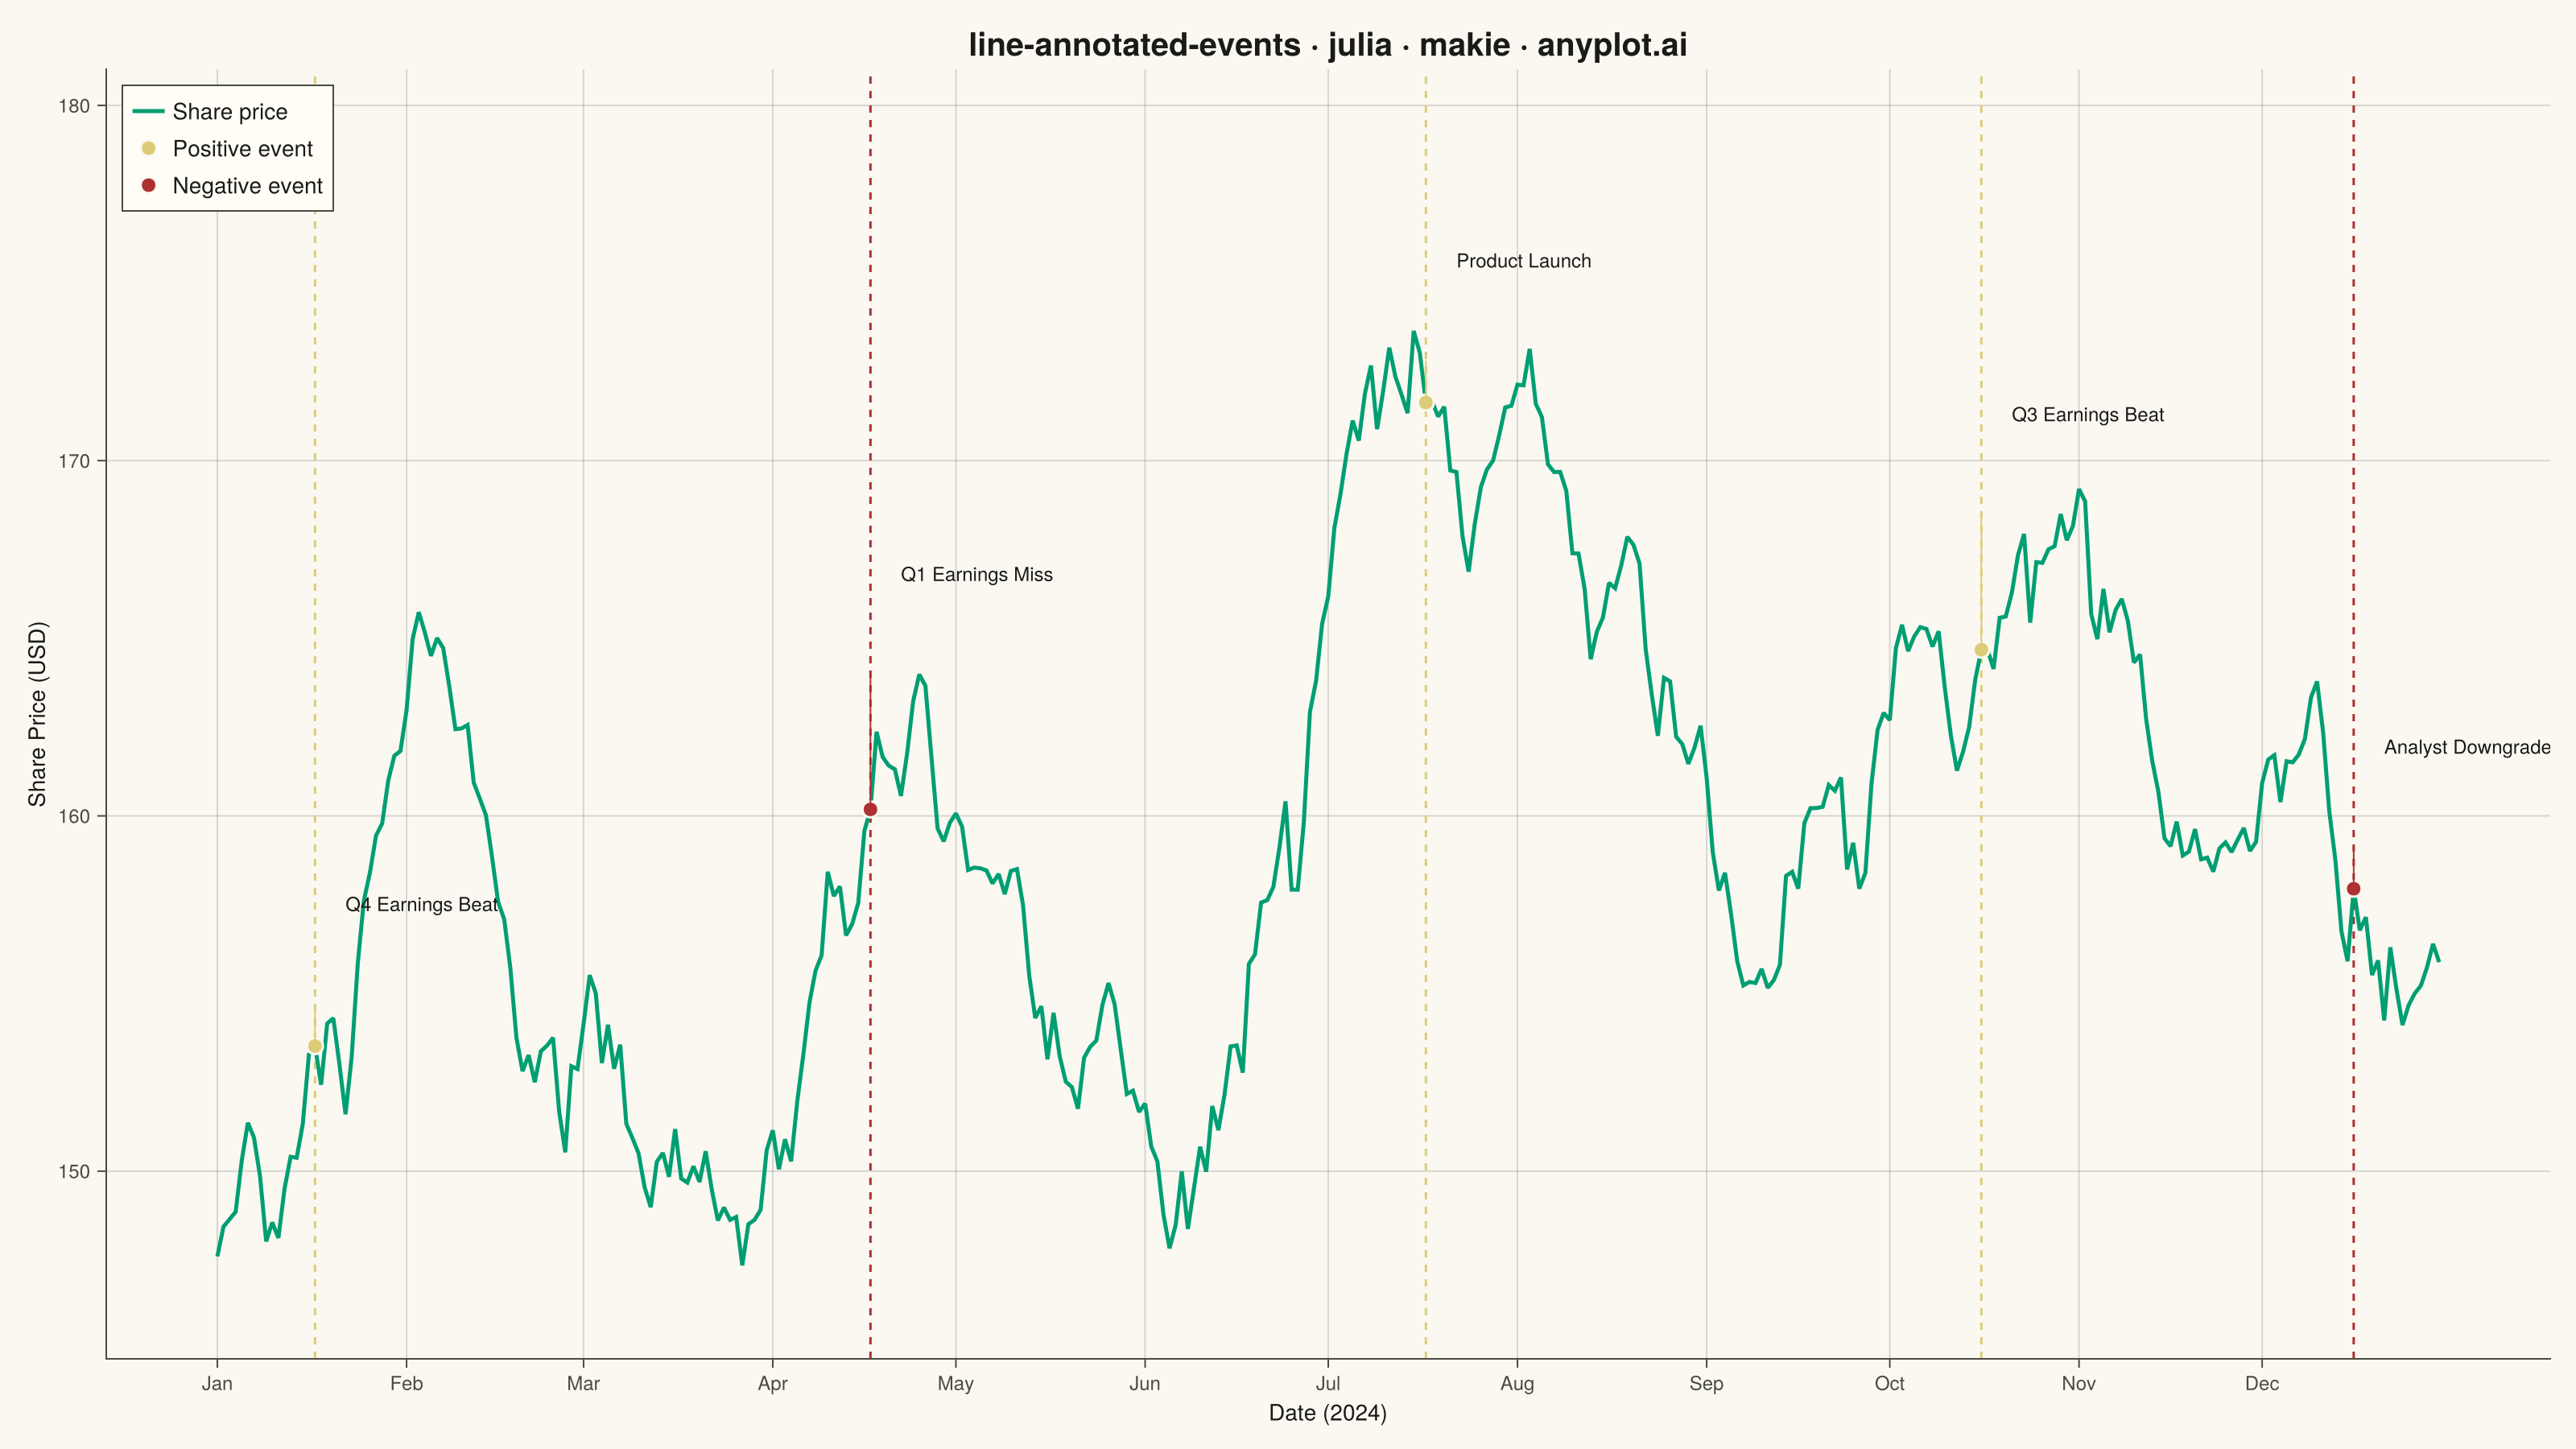
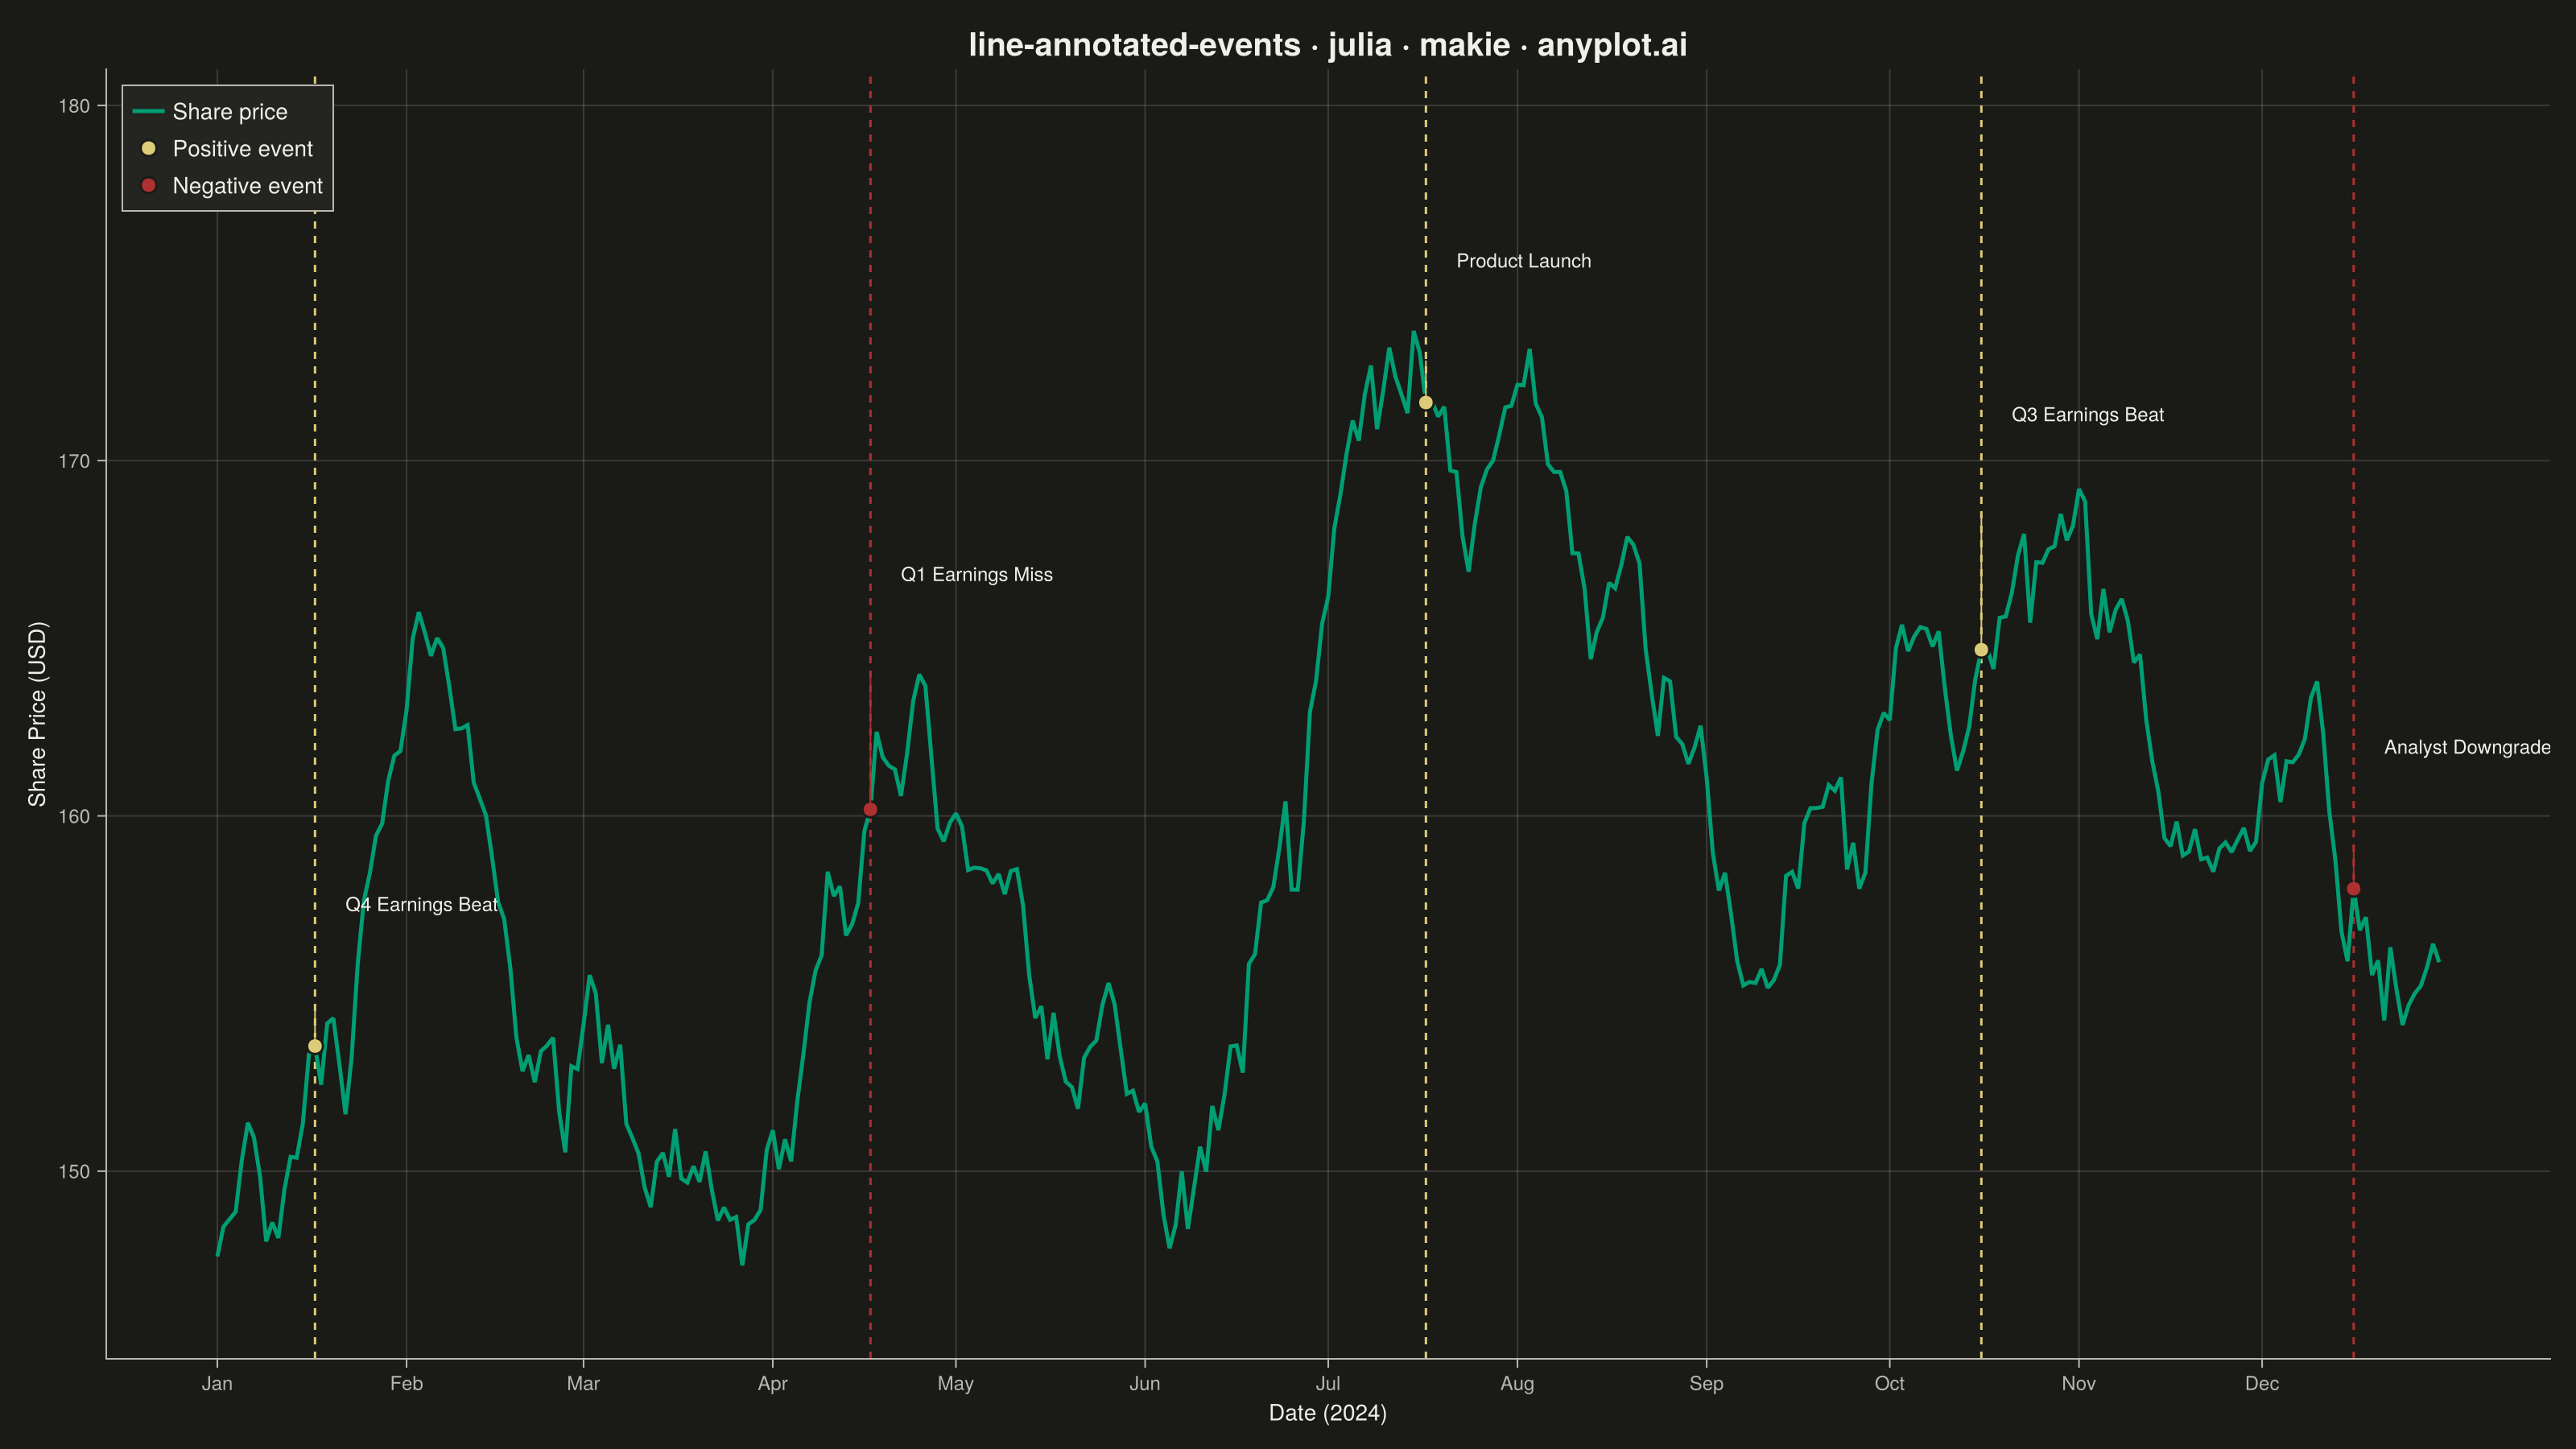
A line plot with annotations at key points marking important events or milestones. This visualization enhances time series data by highlighting significant occurrences such as product launches, policy changes, or market events directly on the chart. Vertical lines, markers, and text labels draw attention to specific moments in time, making it easy to correlate data trends with real-world events.
# anyplot.ai
# line-annotated-events: Annotated Line Plot with Event Markers
# Library: makie 0.21.9 | Julia 1.11.9
# Quality: 88/100 | Created: 2026-09-05

using CairoMakie
using Colors
using Dates
using Random

Random.seed!(42)

# --- Theme tokens -----------------------------------------------------------
const THEME       = get(ENV, "ANYPLOT_THEME", "light")
const PAGE_BG     = THEME == "light" ? colorant"#FAF8F1" : colorant"#1A1A17"
const ELEVATED_BG = THEME == "light" ? colorant"#FFFDF6" : colorant"#242420"
const INK         = THEME == "light" ? colorant"#1A1A17" : colorant"#F0EFE8"
const INK_SOFT    = THEME == "light" ? colorant"#4A4A44" : colorant"#B8B7B0"
const IMPRINT_PALETTE = [
    colorant"#009E73", colorant"#C475FD", colorant"#4467A3", colorant"#BD8233",
    colorant"#AE3030", colorant"#2ABCCD", colorant"#954477", colorant"#99B314",
]
const ANYPLOT_AMBER = colorant"#DDCC77"

# --- Data --------------------------------------------------------------------
n_days = 365
start_date = Date(2024, 1, 1)
trading_days = start_date .+ Day.(0:(n_days - 1))
day_index = 0:(n_days - 1)

drift = 0.00035 .* day_index
seasonal = 6.0 .* sin.(2π .* day_index ./ 90)
noise = cumsum(randn(n_days) .* 1.1)
stock_price = 148.0 .+ drift .* 400 .+ seasonal .+ noise

earnings_indices = [17, 108, 199, 290, 351]
earnings_labels = [
    "Q4 Earnings Beat",
    "Q1 Earnings Miss",
    "Product Launch",
    "Q3 Earnings Beat",
    "Analyst Downgrade",
]
event_dates = trading_days[earnings_indices]
event_values = stock_price[earnings_indices]
event_is_negative = [occursin("Miss", lbl) || occursin("Downgrade", lbl) for lbl in earnings_labels]
event_colors = [neg ? IMPRINT_PALETTE[5] : ANYPLOT_AMBER for neg in event_is_negative]

date_to_x(d) = Float64(Dates.value(d - start_date))
x_days = date_to_x.(trading_days)
event_x = date_to_x.(event_dates)

month_starts = [Date(2024, m, 1) for m in 1:12]
month_ticks = date_to_x.(month_starts)
month_labels = ["Jan", "Feb", "Mar", "Apr", "May", "Jun",
                 "Jul", "Aug", "Sep", "Oct", "Nov", "Dec"]

# --- Plot ----------------------------------------------------------------
title_text = "line-annotated-events · julia · makie · anyplot.ai"

fig = Figure(
    resolution      = (1600, 900),
    fontsize        = 14,
    backgroundcolor = PAGE_BG,
)

ax = Axis(
    fig[1, 1];
    title             = title_text,
    titlesize         = 20,
    titlecolor        = INK,
    xlabel            = "Date (2024)",
    ylabel            = "Share Price (USD)",
    xlabelsize        = 14,
    ylabelsize        = 14,
    xlabelcolor       = INK,
    ylabelcolor       = INK,
    xticklabelsize    = 12,
    yticklabelsize    = 12,
    xticklabelcolor   = INK_SOFT,
    yticklabelcolor   = INK_SOFT,
    xtickcolor        = INK_SOFT,
    ytickcolor        = INK_SOFT,
    backgroundcolor   = PAGE_BG,
    topspinevisible   = false,
    rightspinevisible = false,
    leftspinecolor    = INK_SOFT,
    bottomspinecolor  = INK_SOFT,
    xgridcolor        = RGBAf(INK.r, INK.g, INK.b, 0.15),
    ygridcolor        = RGBAf(INK.r, INK.g, INK.b, 0.15),
    xminorgridvisible = false,
    yminorgridvisible = false,
    xticks            = (month_ticks, month_labels),
)

price_range = maximum(stock_price) - minimum(stock_price)
ylims!(ax, minimum(stock_price) - 0.1 * price_range, maximum(stock_price) + 0.28 * price_range)

# Event markers: dashed vertical rules behind the data line, colored by sentiment
# (matte red = negative surprise, amber = positive/neutral) so the narrative reads
# without relying on the text labels alone.
for (ex, col) in zip(event_x, event_colors)
    vlines!(ax, [ex]; color = col, linestyle = :dash, linewidth = 1.5)
end

# Main price series drawn on top of the event rules
lines!(ax, x_days, stock_price; color = IMPRINT_PALETTE[1], linewidth = 2.5)

# Event point markers and alternating, close-in label offsets so each label stays
# visually tethered to its marker via the short run of dashed rule beneath it.
label_offsets = [0.14, 0.24, 0.14, 0.24, 0.14] .* price_range
for (ex, ey, lbl, off, col) in zip(event_x, event_values, earnings_labels, label_offsets, event_colors)
    scatter!(ax, [ex], [ey]; color = col, markersize = 14,
             strokewidth = 1.5, strokecolor = PAGE_BG)
    # short leader tick linking the marker to its label
    lines!(ax, [ex, ex], [ey, ey + off - 2.5]; color = col, linewidth = 1.0)
    text!(ax, ex + 5.0, ey + off; text = lbl, color = INK, fontsize = 12,
          align = (:left, :bottom), rotation = 0.0)
end

# Composite inset legend (Makie GridLayout co-location, not axislegend) that
# explains both the price line and the two event-marker sentiments at once.
legend_elements = [
    LineElement(color = IMPRINT_PALETTE[1], linewidth = 2.5),
    MarkerElement(color = ANYPLOT_AMBER, marker = :circle, markersize = 14,
                  strokecolor = PAGE_BG, strokewidth = 1.5),
    MarkerElement(color = IMPRINT_PALETTE[5], marker = :circle, markersize = 14,
                  strokecolor = PAGE_BG, strokewidth = 1.5),
]
legend_labels = ["Share price", "Positive event", "Negative event"]
Legend(fig[1, 1], legend_elements, legend_labels;
       tellwidth = false, tellheight = false, halign = :left, valign = :top,
       margin = (10, 10, 10, 10), framevisible = true,
       backgroundcolor = ELEVATED_BG, labelcolor = INK, framecolor = INK_SOFT)

# --- Save ----------------------------------------------------------------
save("plot-$(THEME).png", fig; px_per_unit = 2)
Runnable source as JSON, for any HTTP client: https://api.anyplot.ai/specs/line-annotated-events/makie/code. Any spec id and library id listed in llms-full.txt fit the same URL shape; every URL below is complete and callable.
{
  "spec_id": "line-annotated-events",
  "language": "julia",
  "library": "makie",
  "page": "https://anyplot.ai/line-annotated-events/julia/makie",
  "hub": "https://anyplot.ai/line-annotated-events",
  "code_json": "https://api.anyplot.ai/specs/line-annotated-events/makie/code",
  "spec_json": "https://api.anyplot.ai/specs/line-annotated-events",
  "render_light_png": "https://storage.googleapis.com/anyplot-images/plots/line-annotated-events/julia/makie/plot-light.png",
  "render_dark_png": "https://storage.googleapis.com/anyplot-images/plots/line-annotated-events/julia/makie/plot-dark.png",
  "quality_score": 88.0,
  "license": "MIT",
  "guide": "https://anyplot.ai/llms.txt"
}
Part of Annotated Line Plot with Event Markers on anyplot.ai.