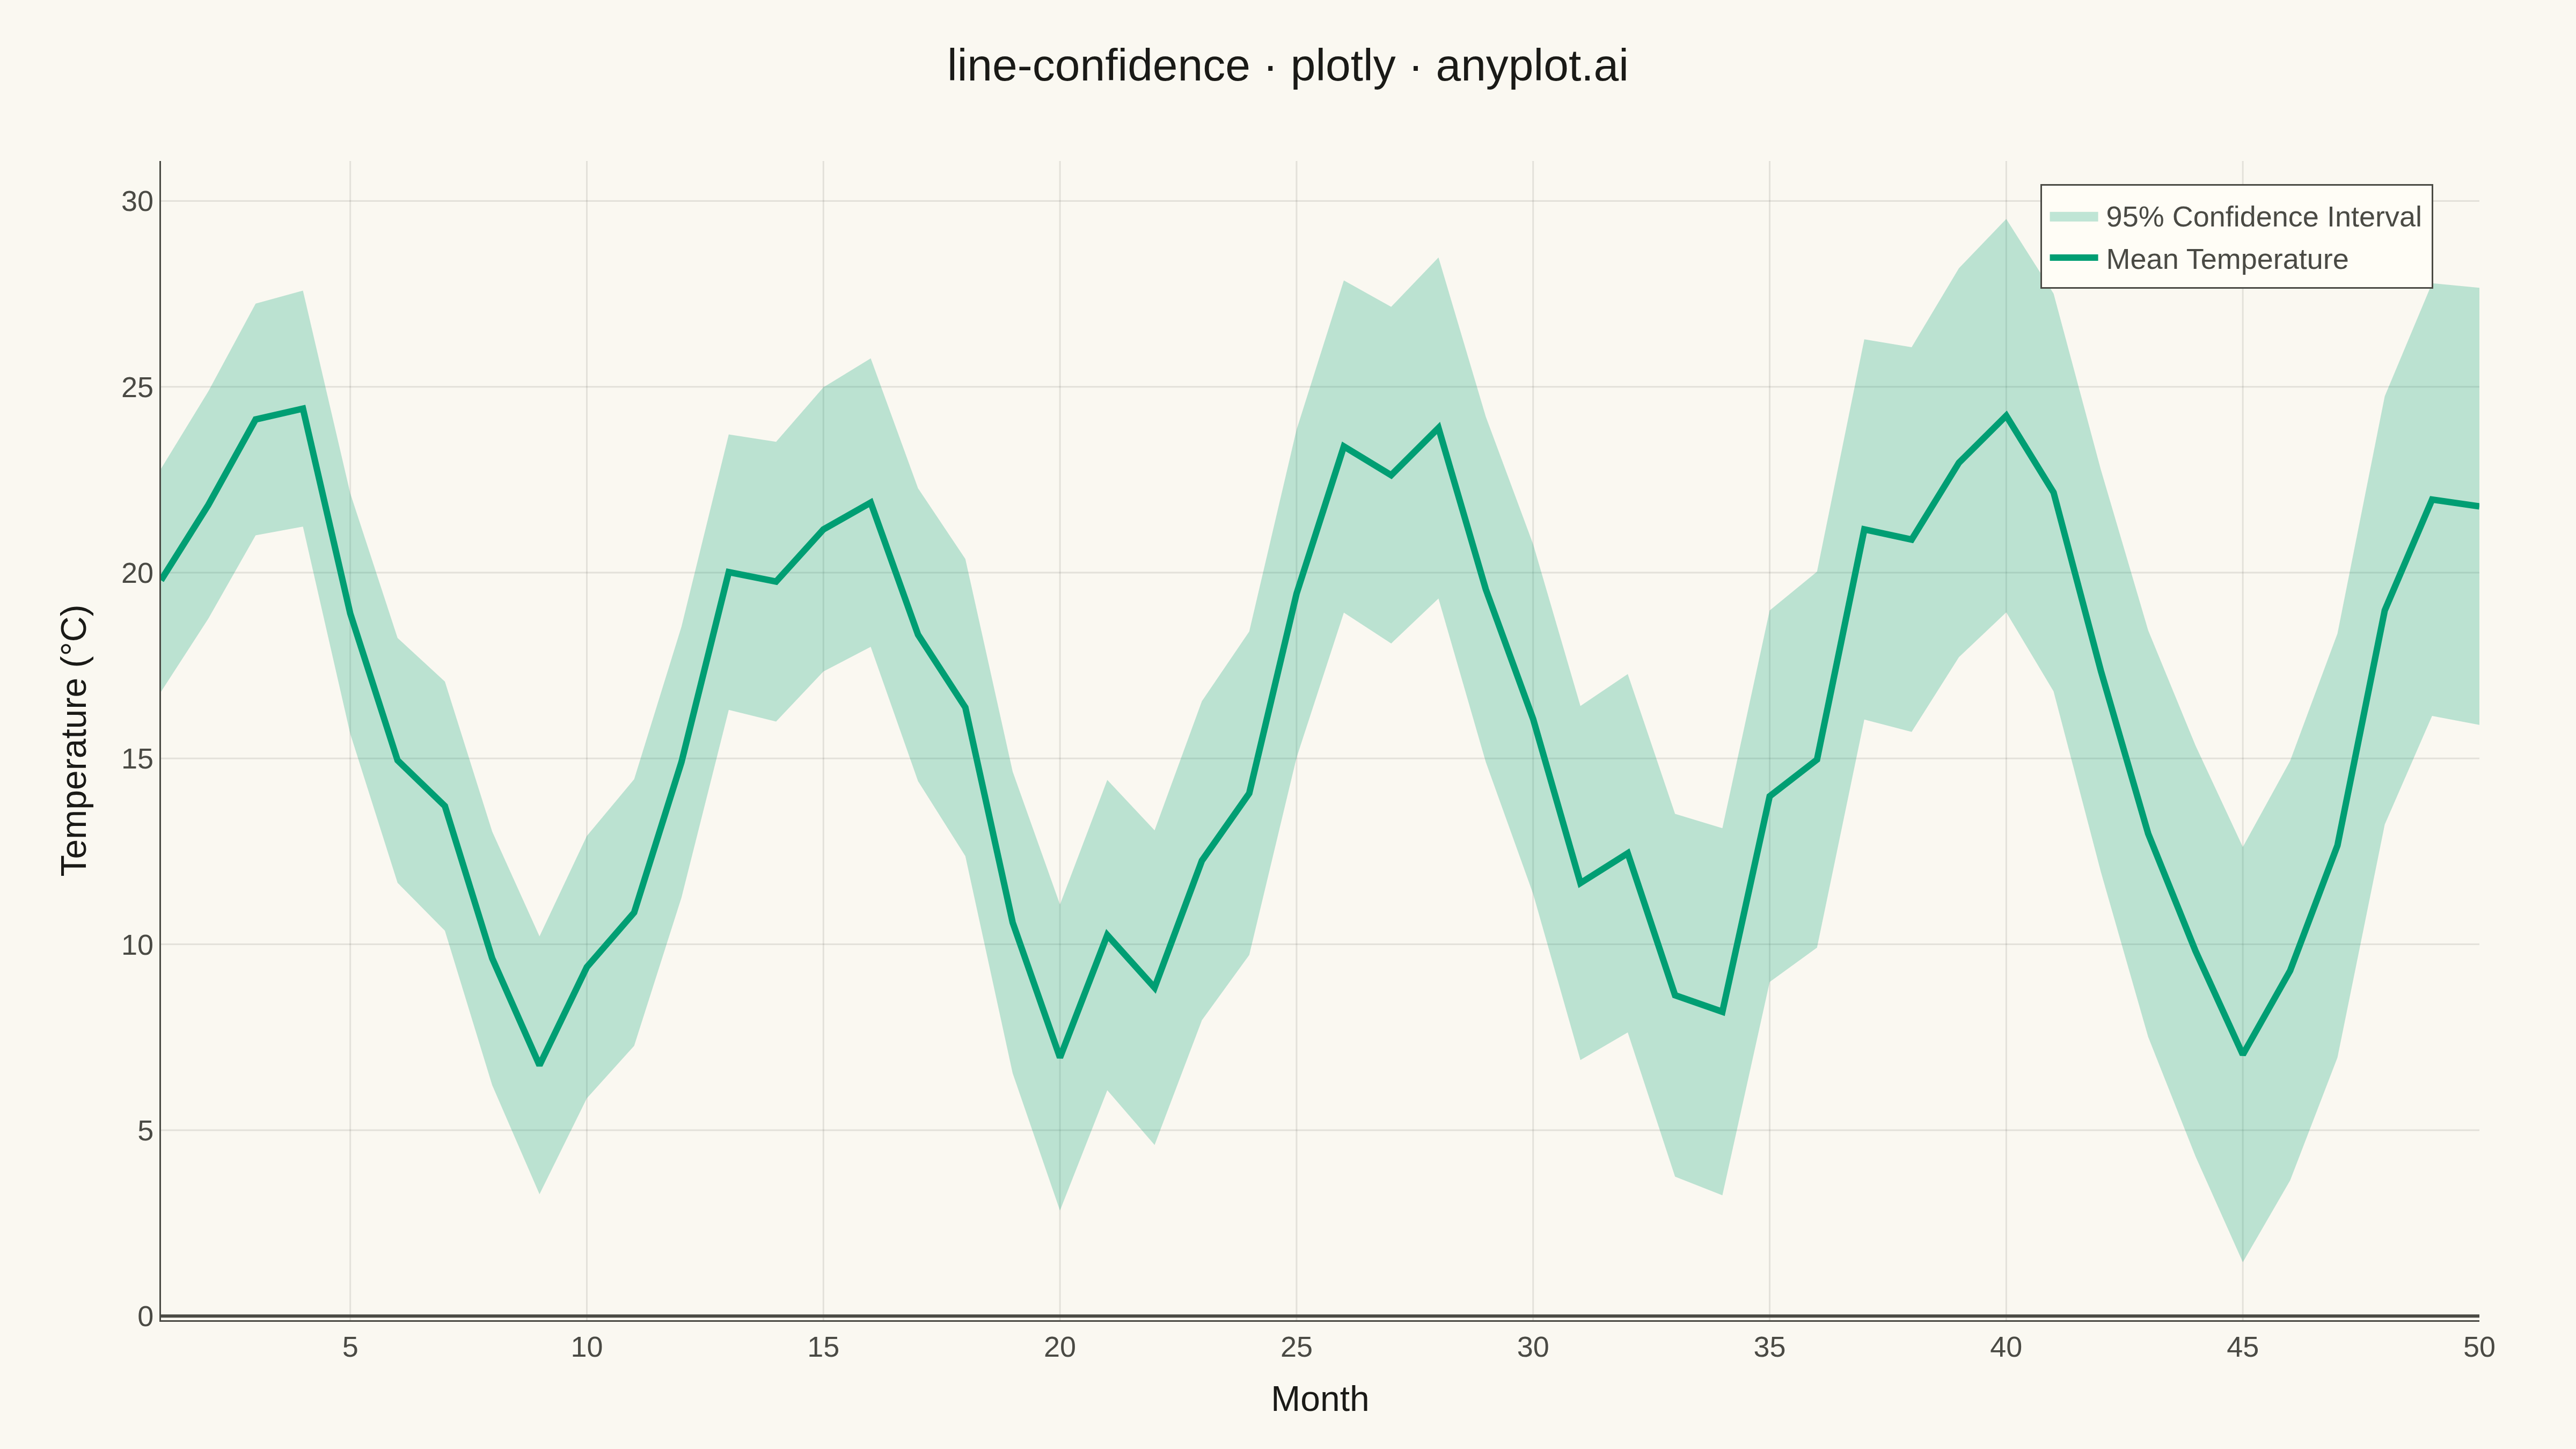
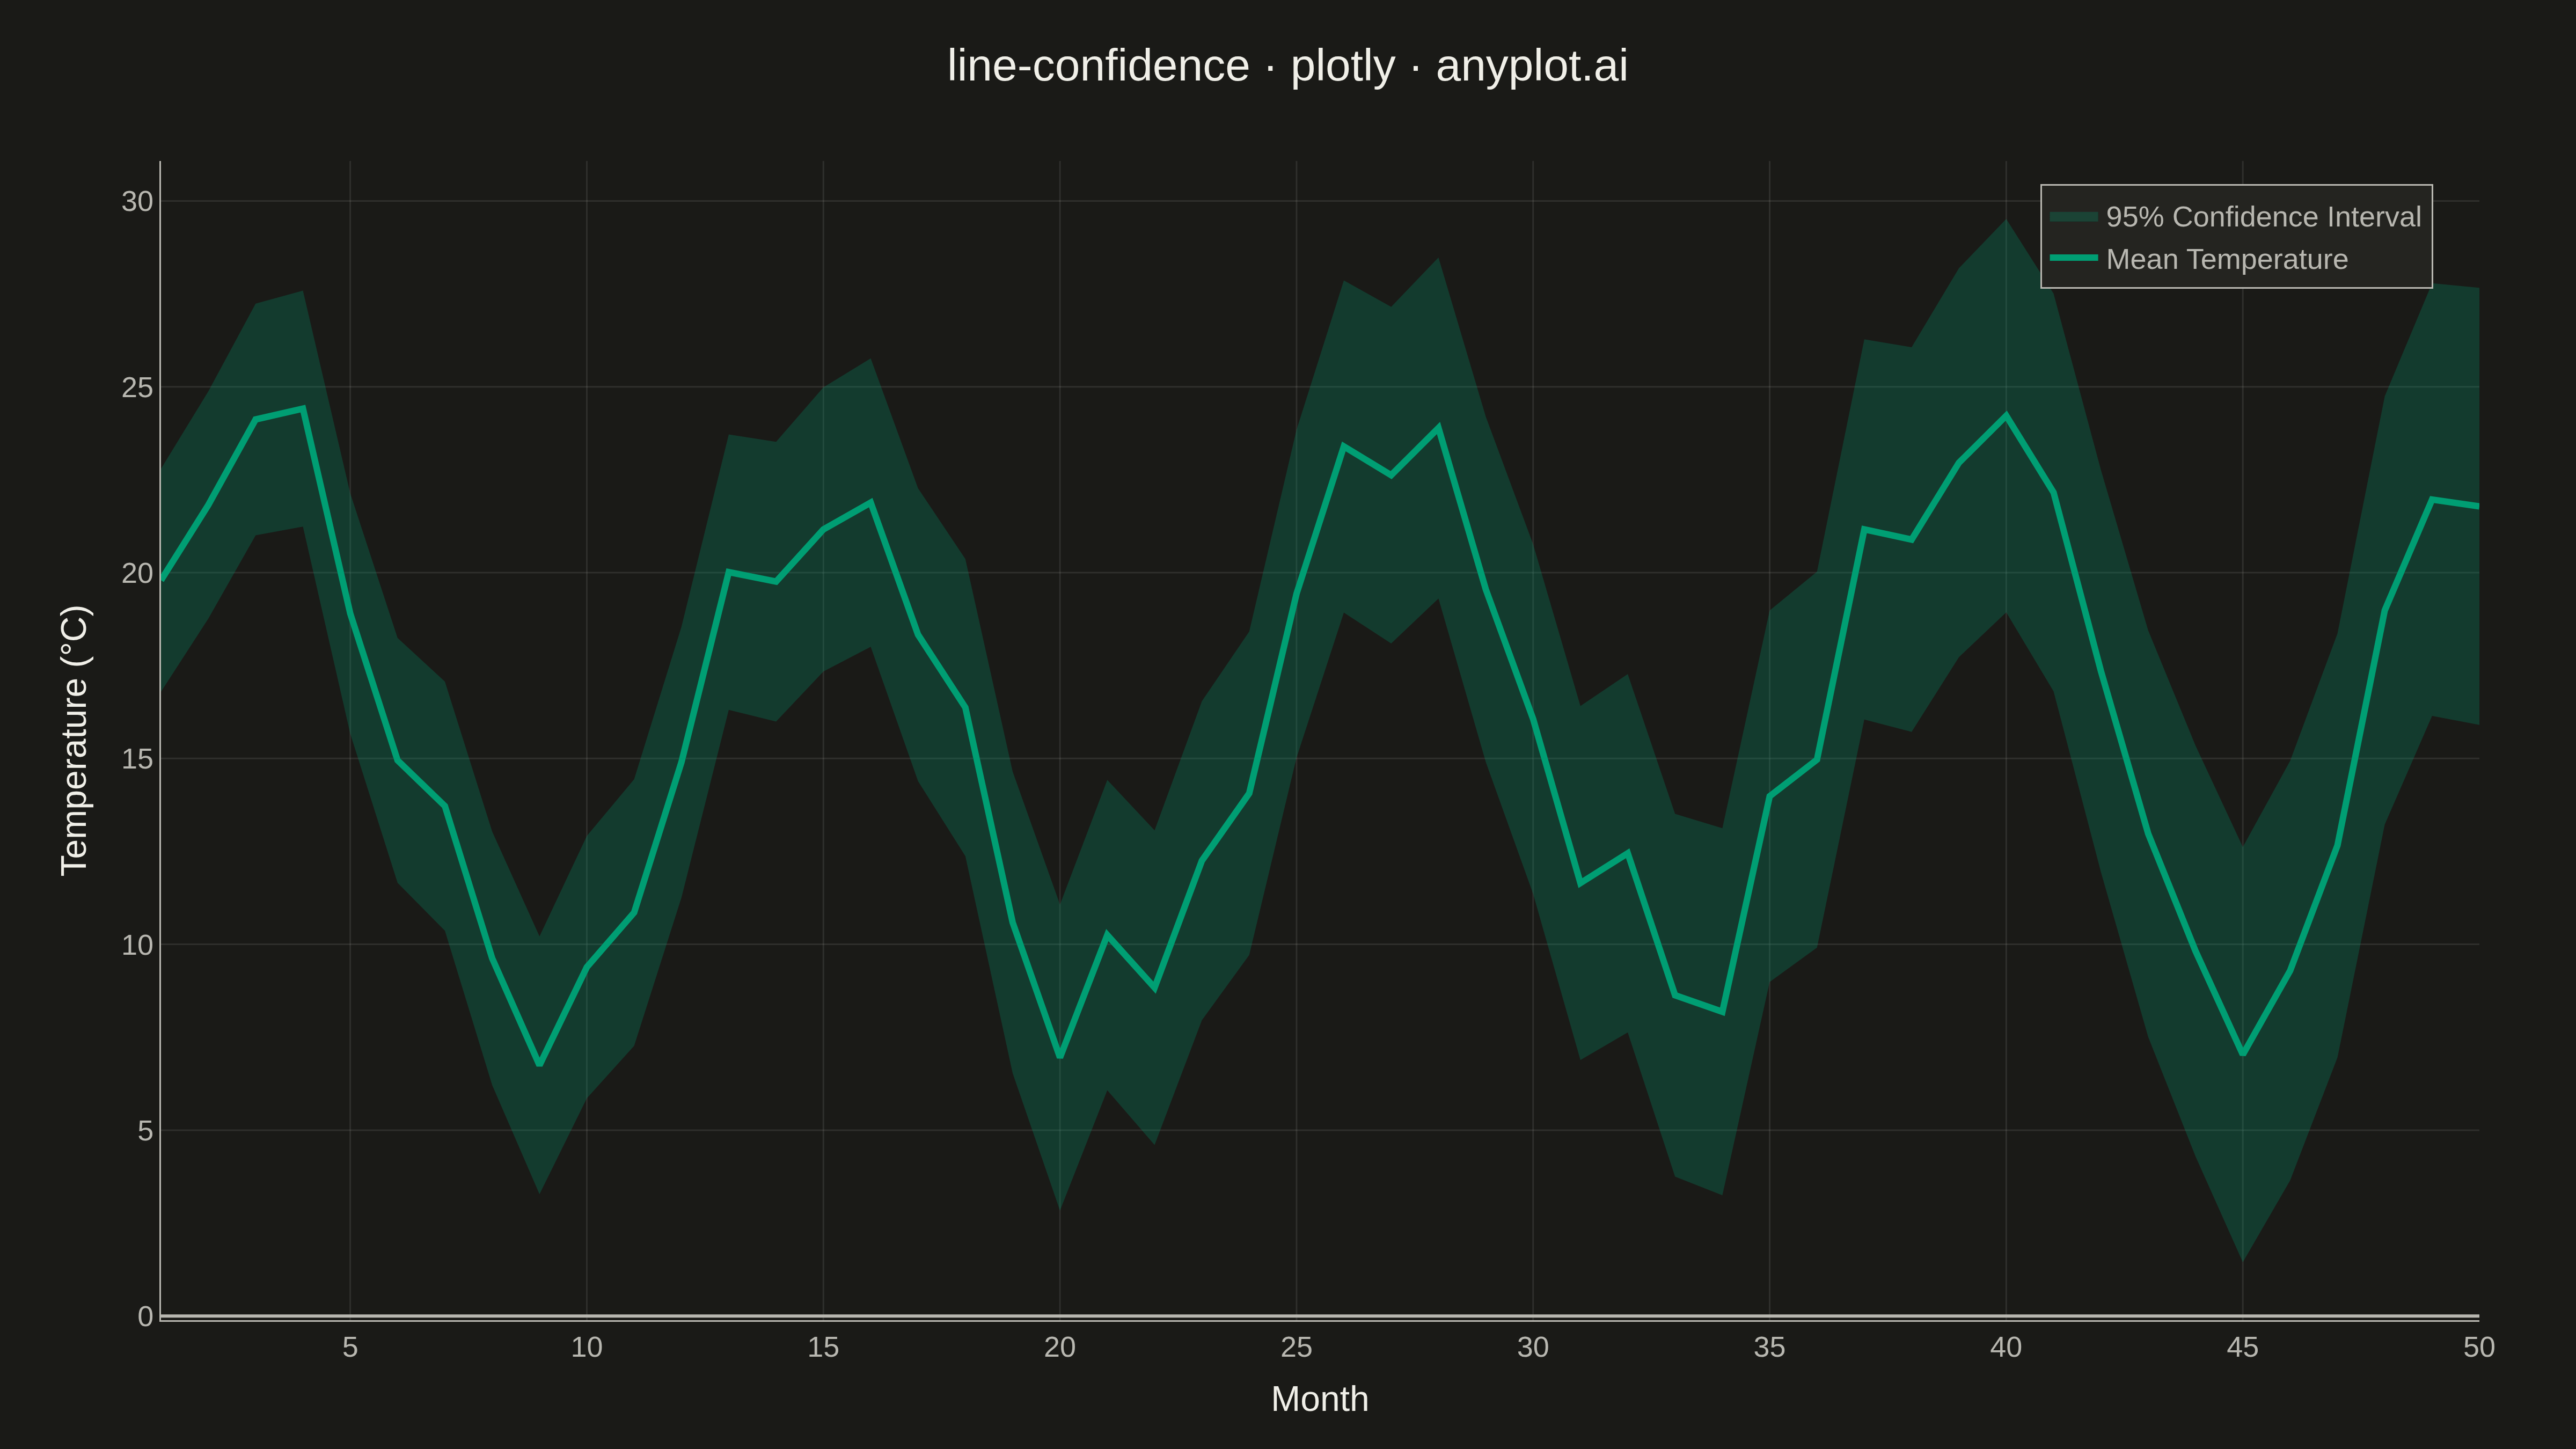
A line plot with a confidence interval displays a central trend line (typically mean or median) surrounded by a shaded band representing uncertainty or variability. The combination of a clear central line and semi-transparent confidence region effectively communicates both the estimated value and its associated uncertainty, making it essential for visualizing statistical estimates, model predictions, and forecast ranges.
Preview render from the Plotly implementation.