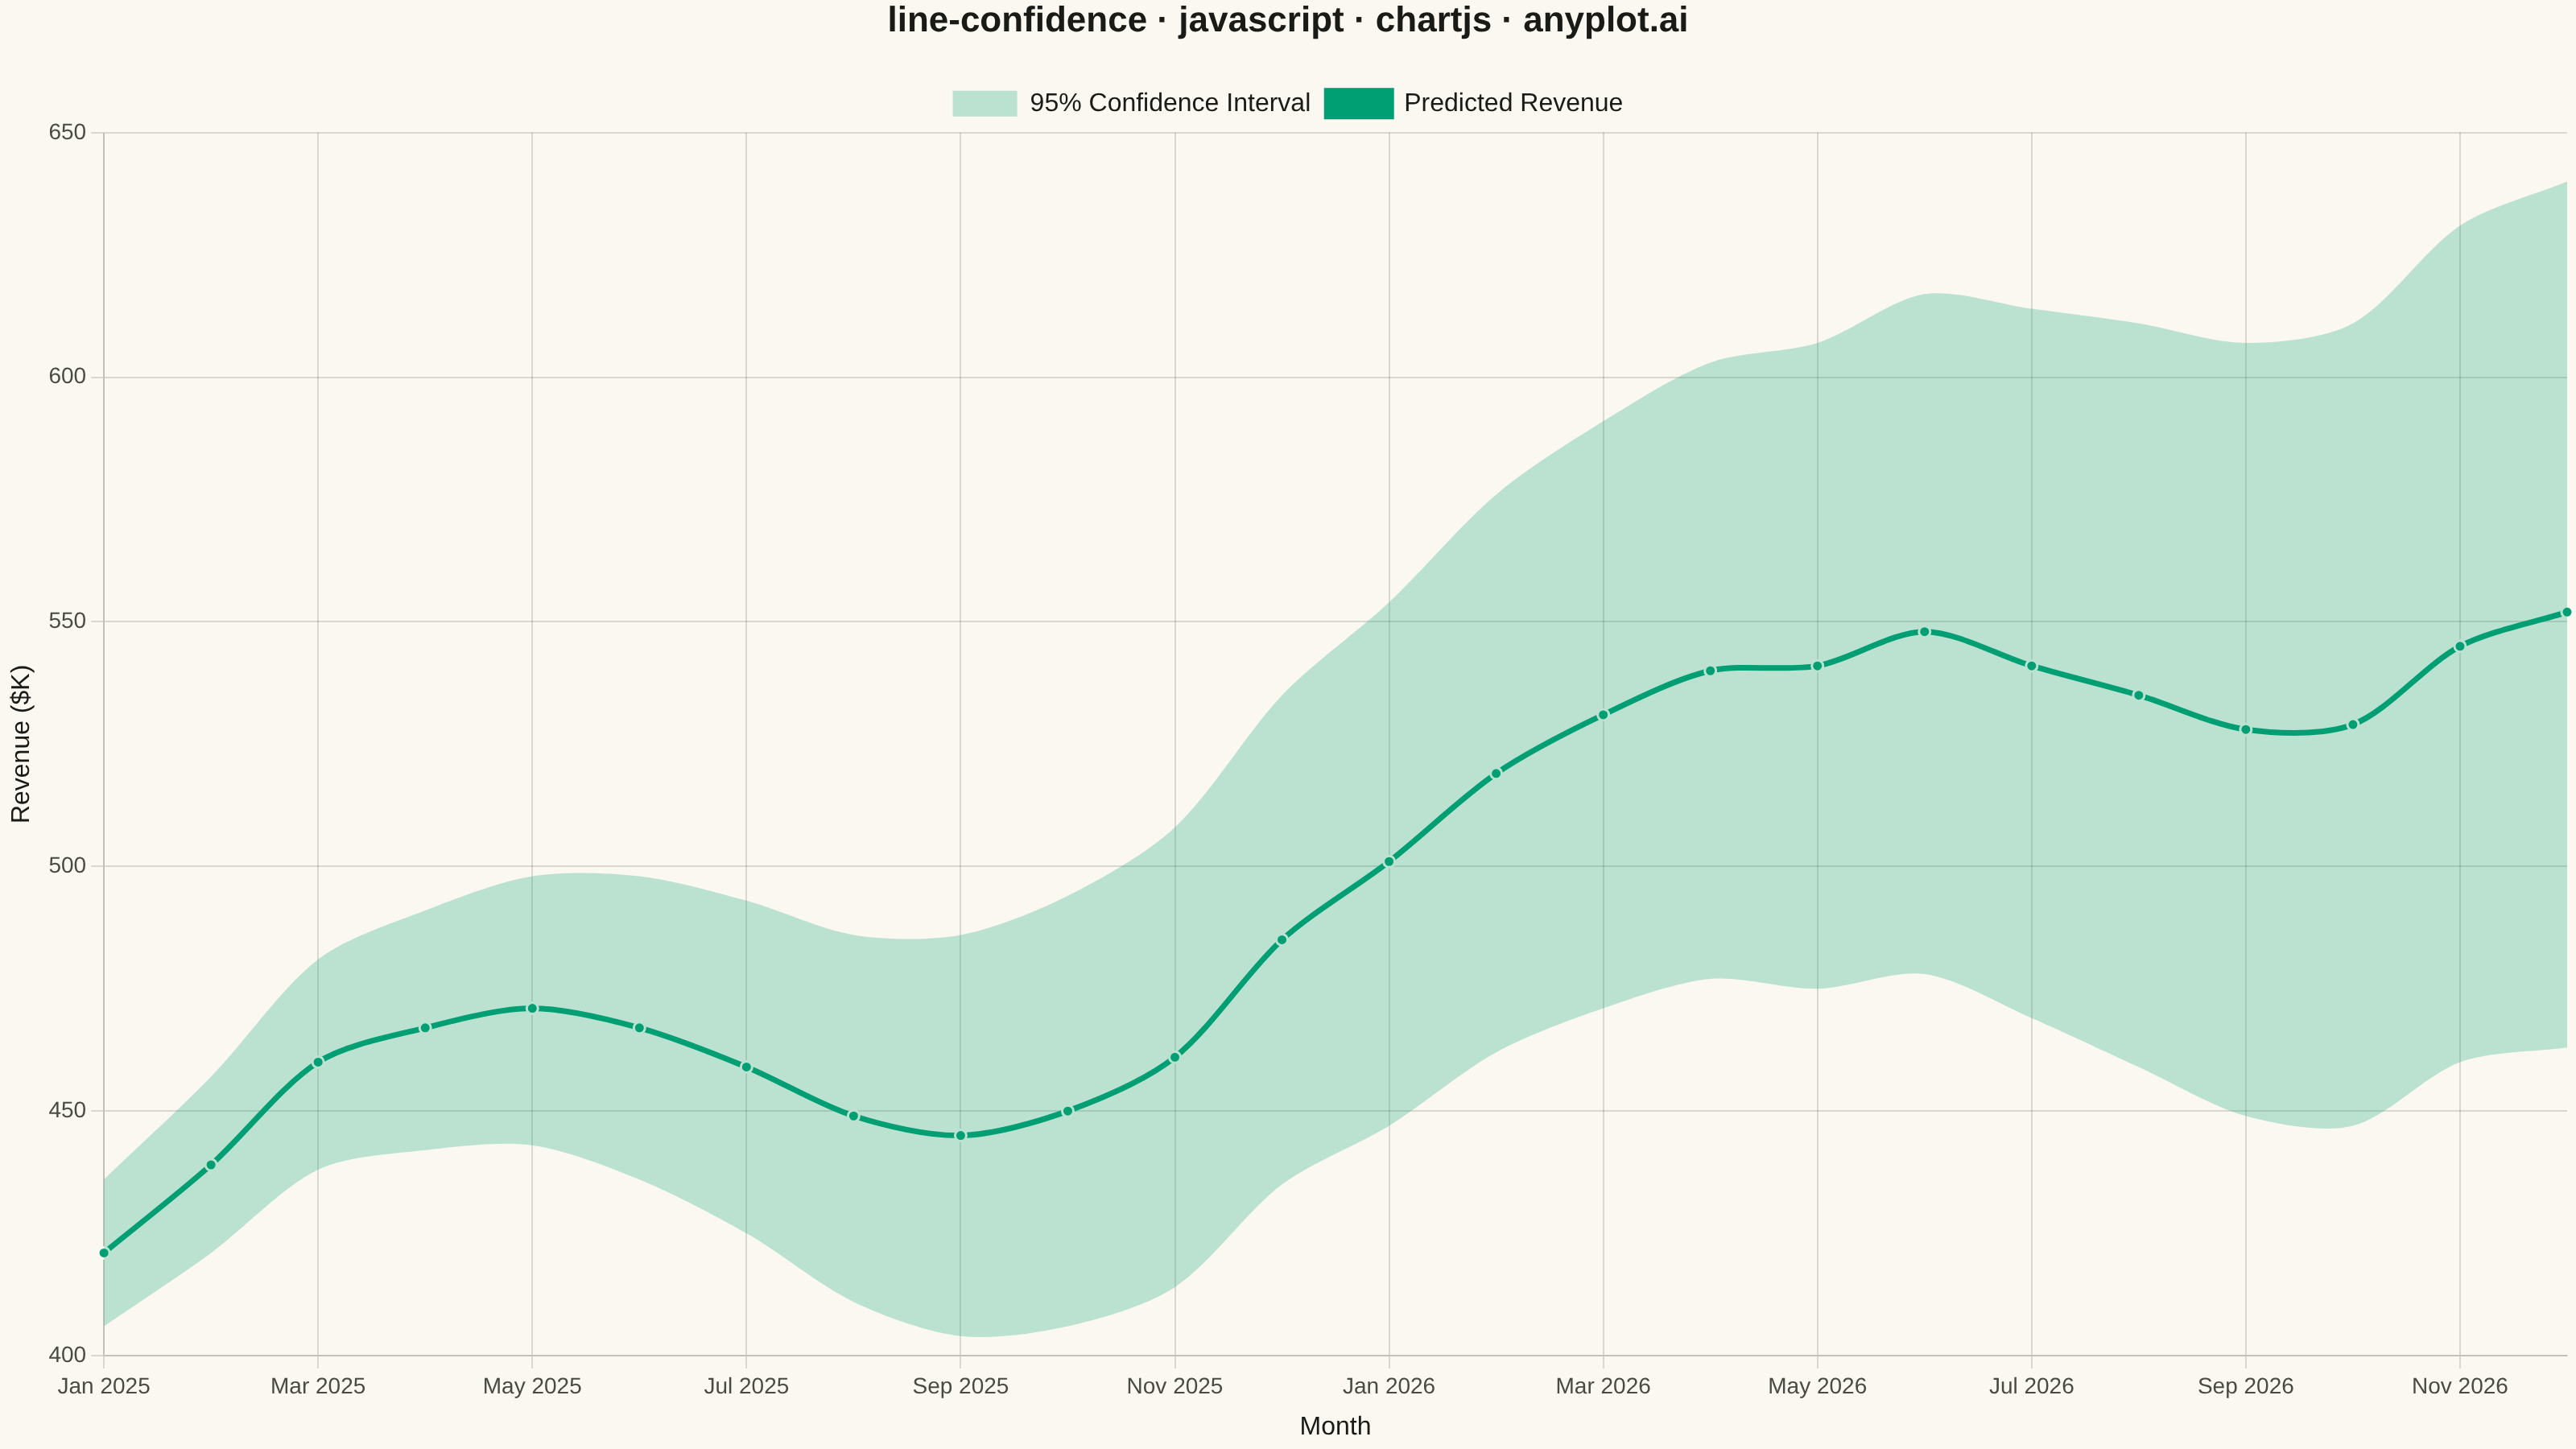
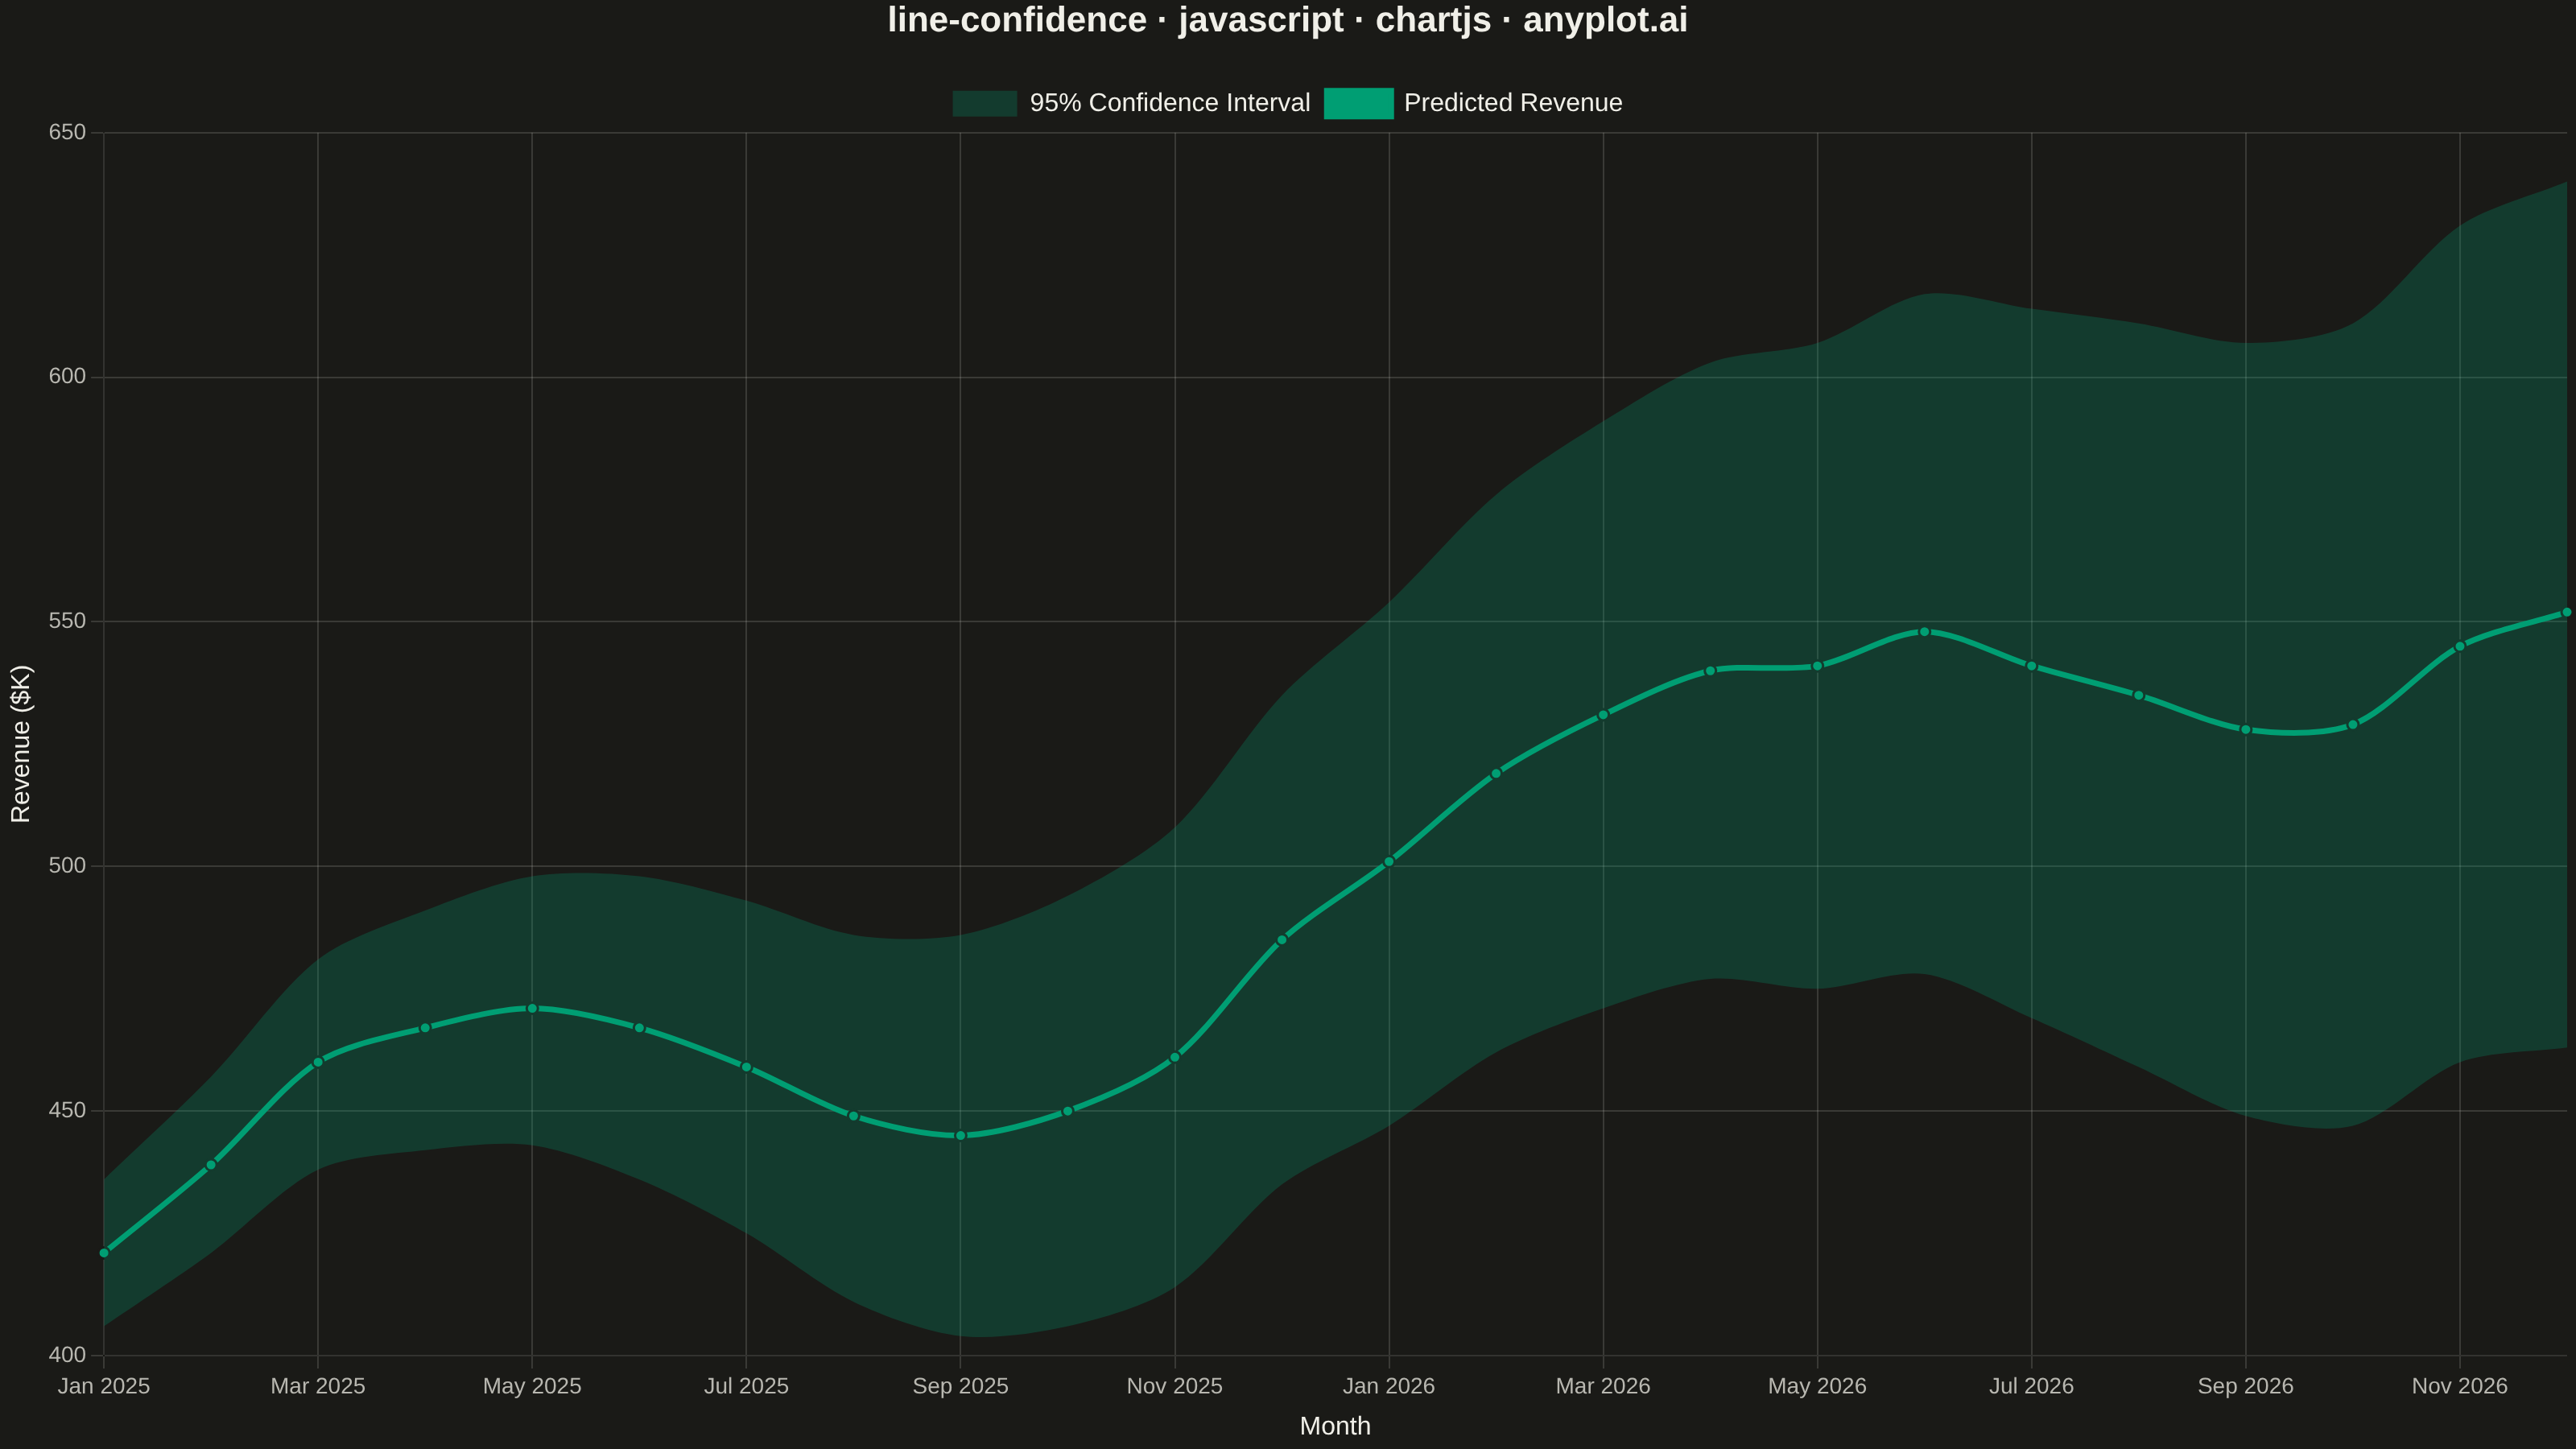
The same plot in 14 other libraries — JavaScript: D3.js, Apache ECharts, Highcharts, MUI X Charts; Python: Altair, Bokeh, lets-plot, Matplotlib, Plotly, plotnine, Pygal, Seaborn; R: ggplot2; Julia: Makie.jl. Compare all 15 side by side: Line Plot with Confidence Interval in Python, R, Julia and JavaScript.
A line plot with a confidence interval displays a central trend line (typically mean or median) surrounded by a shaded band representing uncertainty or variability. The combination of a clear central line and semi-transparent confidence region effectively communicates both the estimated value and its associated uncertainty, making it essential for visualizing statistical estimates, model predictions, and forecast ranges.
// anyplot.ai
// line-confidence: Line Plot with Confidence Interval
// Library: chartjs 4.4.7 | JavaScript 22.23.2
// Quality: 86/100 | Created: 2026-09-05

//# anyplot-orientation: landscape
const t = window.ANYPLOT_TOKENS;

// --- Data (in-memory, deterministic) ---------------------------------------
// Small fixed-seed LCG — the browser has no seeded Math.random.
let seed = 42;
function nextRandom() {
  seed = (seed * 1103515245 + 12345) % 2147483648;
  return seed / 2147483648;
}

function hexToRgba(hex, alpha) {
  const r = parseInt(hex.slice(1, 3), 16);
  const g = parseInt(hex.slice(3, 5), 16);
  const b = parseInt(hex.slice(5, 7), 16);
  return `rgba(${r}, ${g}, ${b}, ${alpha})`;
}

const monthNames = ["Jan", "Feb", "Mar", "Apr", "May", "Jun", "Jul", "Aug", "Sep", "Oct", "Nov", "Dec"];
const horizon = 24;
const labels = Array.from({ length: horizon }, (_, i) => `${monthNames[i % 12]} ${i < 12 ? "2025" : "2026"}`);

const predicted = [];
const lowerBound = [];
const upperBound = [];
for (let i = 0; i < horizon; i++) {
  const trend = 420 + i * 6.5;
  const seasonal = 25 * Math.sin((i / 12) * 2 * Math.PI);
  const noise = (nextRandom() - 0.5) * 12;
  const value = trend + seasonal + noise;
  // Forecast uncertainty widens further into the horizon.
  const margin = 15 + i * 3.2;
  predicted.push(Math.round(value));
  lowerBound.push(Math.round(value - margin));
  upperBound.push(Math.round(value + margin));
}

// --- Mount -------------------------------------------------------------
const canvas = document.createElement("canvas");
document.getElementById("container").appendChild(canvas);

// --- Chart ---------------------------------------------------------------
new Chart(canvas, {
  type: "line",
  data: {
    labels,
    datasets: [
      {
        label: "Lower Bound",
        data: lowerBound,
        borderColor: "transparent",
        backgroundColor: "transparent",
        pointRadius: 0,
        fill: false,
        tension: 0.3,
      },
      {
        label: "95% Confidence Interval",
        data: upperBound,
        borderColor: "transparent",
        backgroundColor: hexToRgba(t.palette[0], 0.25),
        pointRadius: 0,
        fill: "-1",
        tension: 0.3,
      },
      {
        label: "Predicted Revenue",
        data: predicted,
        borderColor: t.palette[0],
        backgroundColor: t.palette[0],
        borderWidth: 3.5,
        pointRadius: 3.5,
        pointBackgroundColor: t.palette[0],
        pointBorderColor: t.pageBg,
        pointBorderWidth: 1.5,
        fill: false,
        tension: 0.3,
      },
    ],
  },
  options: {
    responsive: true,
    maintainAspectRatio: false,
    animation: false,
    plugins: {
      title: {
        display: true,
        text: "line-confidence · javascript · chartjs · anyplot.ai",
        color: t.ink,
        font: { size: 22 },
        padding: { bottom: 20 },
      },
      legend: {
        labels: {
          color: t.ink,
          font: { size: 16 },
          filter: (item) => item.datasetIndex !== 0,
        },
      },
    },
    scales: {
      x: {
        ticks: { color: t.inkSoft, font: { size: 14 }, maxRotation: 0, autoSkip: true, maxTicksLimit: 12 },
        grid: { color: t.grid },
        title: { display: true, text: "Month", color: t.ink, font: { size: 16 } },
      },
      y: {
        ticks: { color: t.inkSoft, font: { size: 14 } },
        grid: { color: t.grid },
        title: { display: true, text: "Revenue ($K)", color: t.ink, font: { size: 16 } },
      },
    },
  },
});
Runnable source as JSON, for any HTTP client: https://api.anyplot.ai/specs/line-confidence/chartjs/code. Any spec id and library id listed in llms-full.txt fit the same URL shape; every URL below is complete and callable.
{
  "spec_id": "line-confidence",
  "language": "javascript",
  "library": "chartjs",
  "page": "https://anyplot.ai/line-confidence/javascript/chartjs",
  "hub": "https://anyplot.ai/line-confidence",
  "code_json": "https://api.anyplot.ai/specs/line-confidence/chartjs/code",
  "spec_json": "https://api.anyplot.ai/specs/line-confidence",
  "render_light_png": "https://storage.googleapis.com/anyplot-images/plots/line-confidence/javascript/chartjs/plot-light.png",
  "render_dark_png": "https://storage.googleapis.com/anyplot-images/plots/line-confidence/javascript/chartjs/plot-dark.png",
  "interactive_light_html": "https://storage.googleapis.com/anyplot-images/plots/line-confidence/javascript/chartjs/plot-light.html",
  "interactive_dark_html": "https://storage.googleapis.com/anyplot-images/plots/line-confidence/javascript/chartjs/plot-dark.html",
  "quality_score": 86.0,
  "license": "MIT",
  "guide": "https://anyplot.ai/llms.txt"
}
Part of Line Plot with Confidence Interval on anyplot.ai.