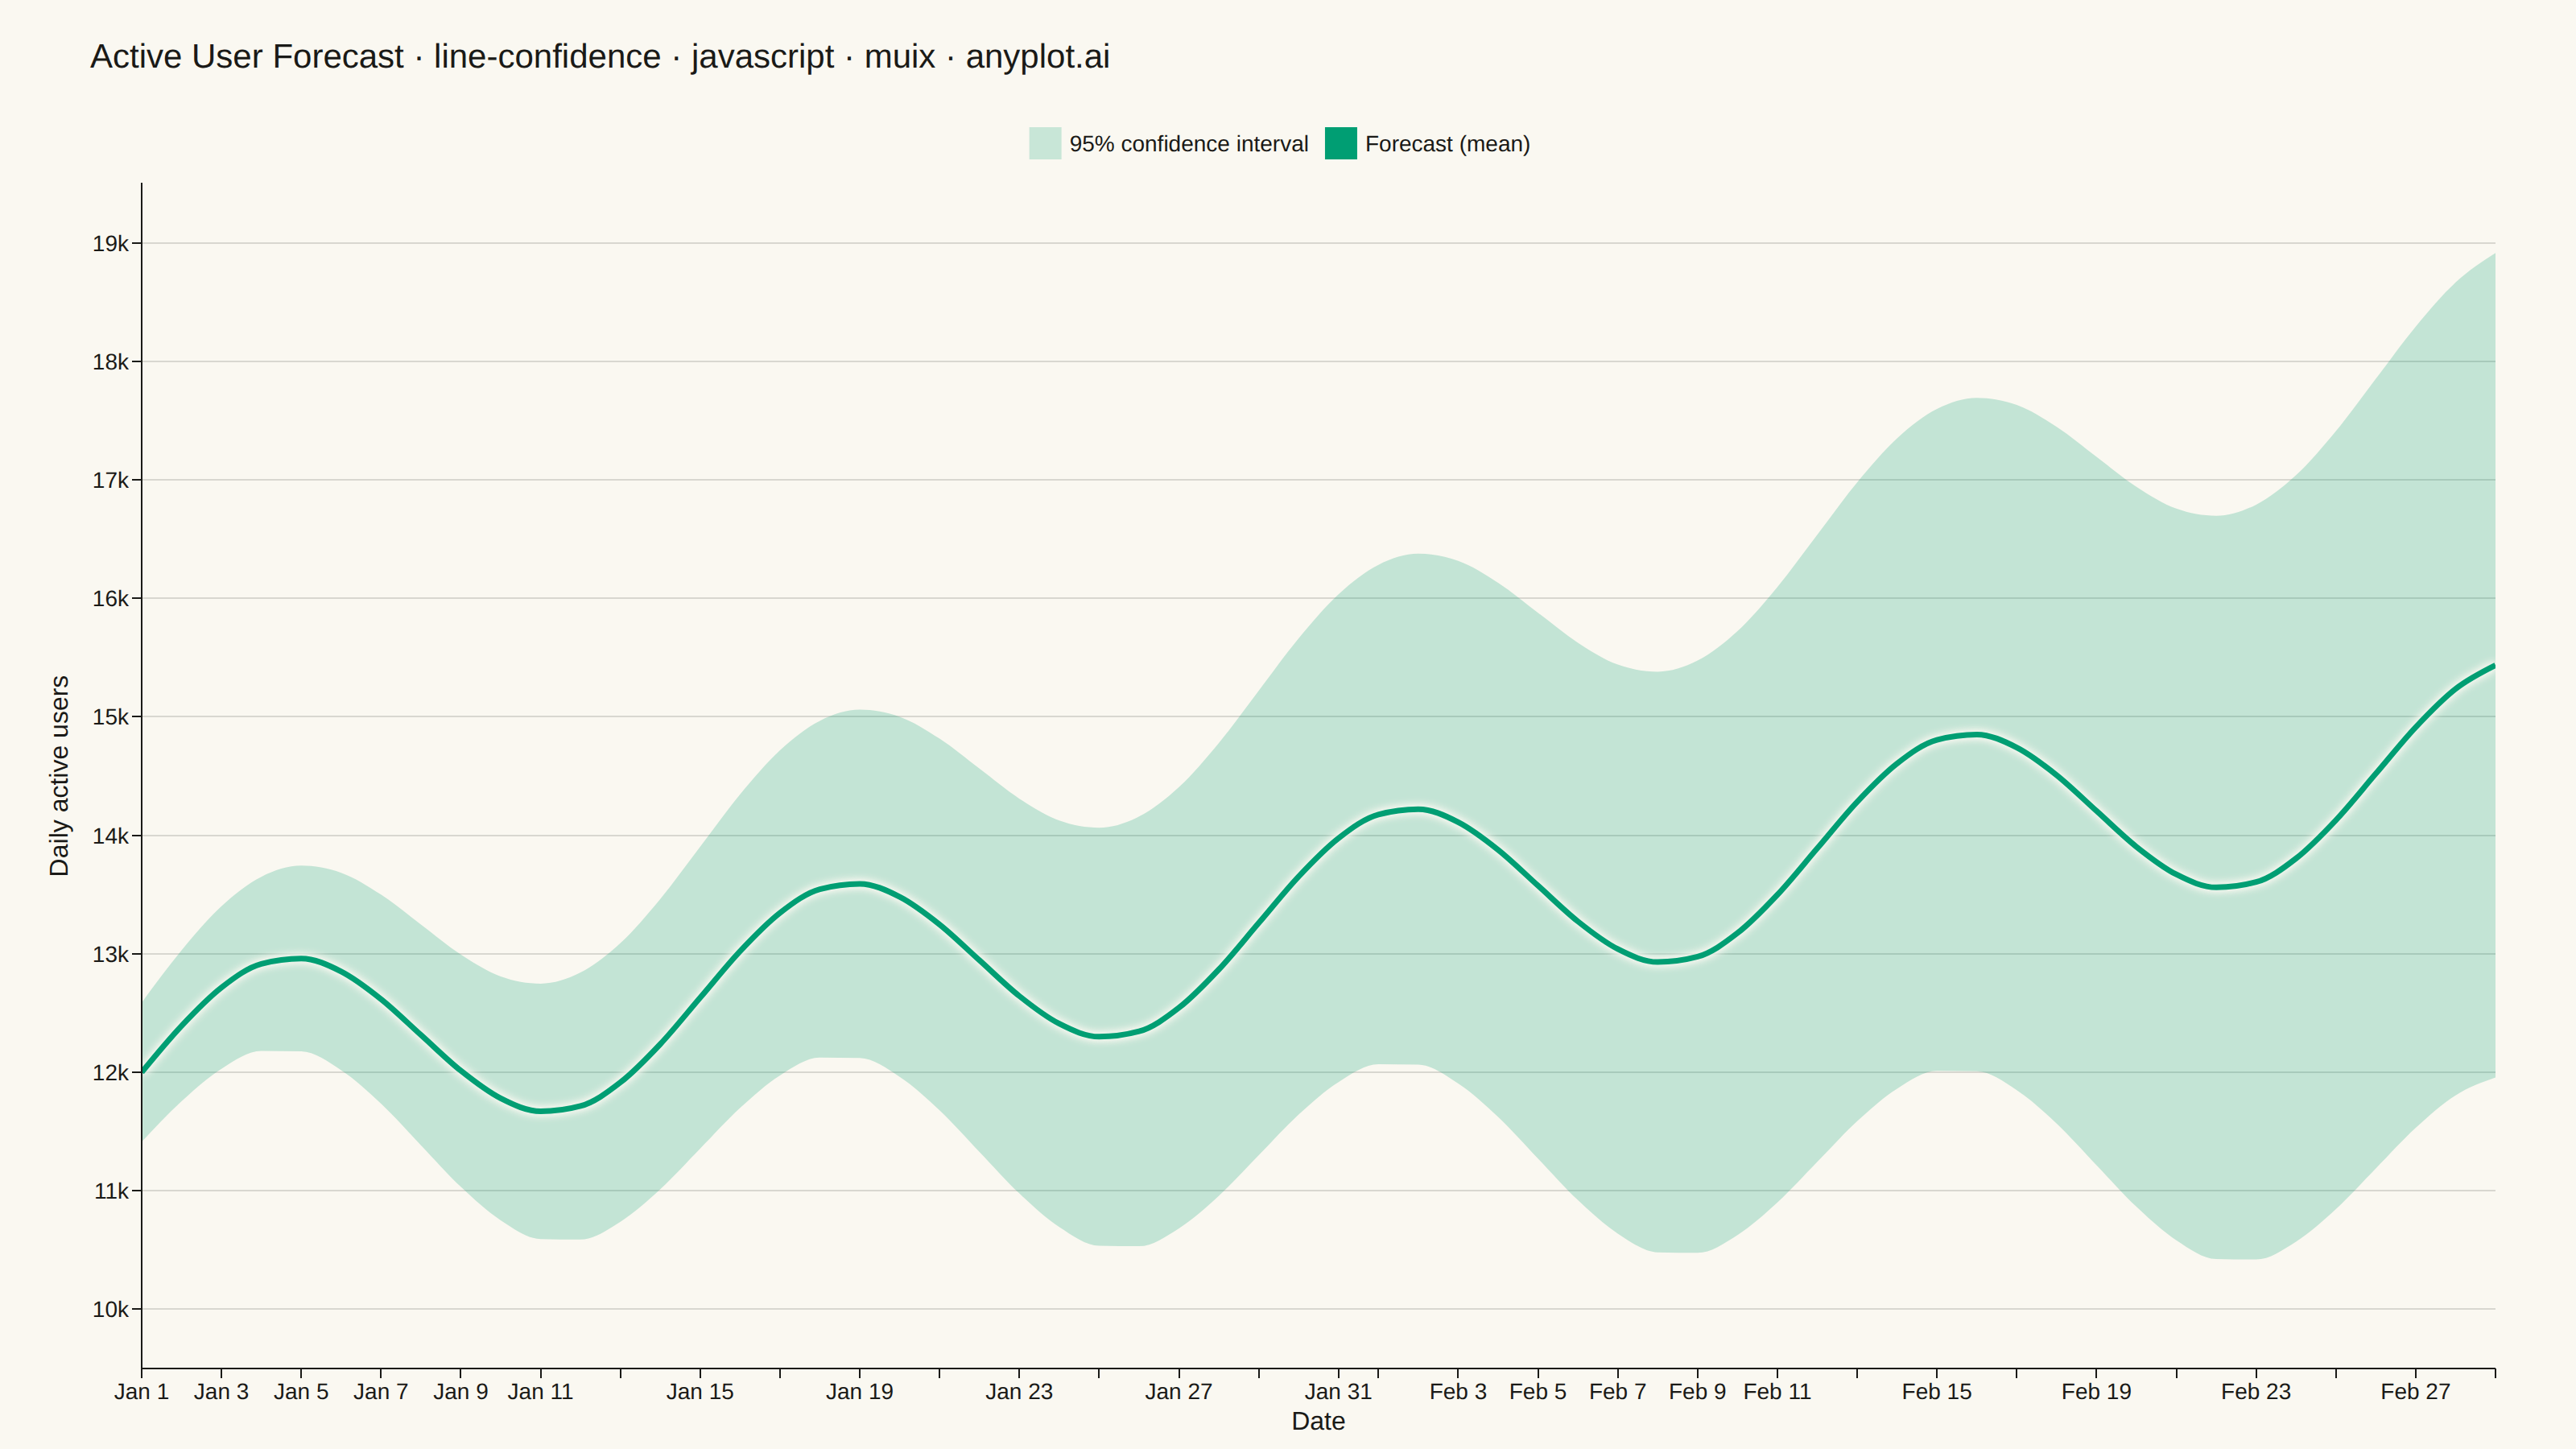
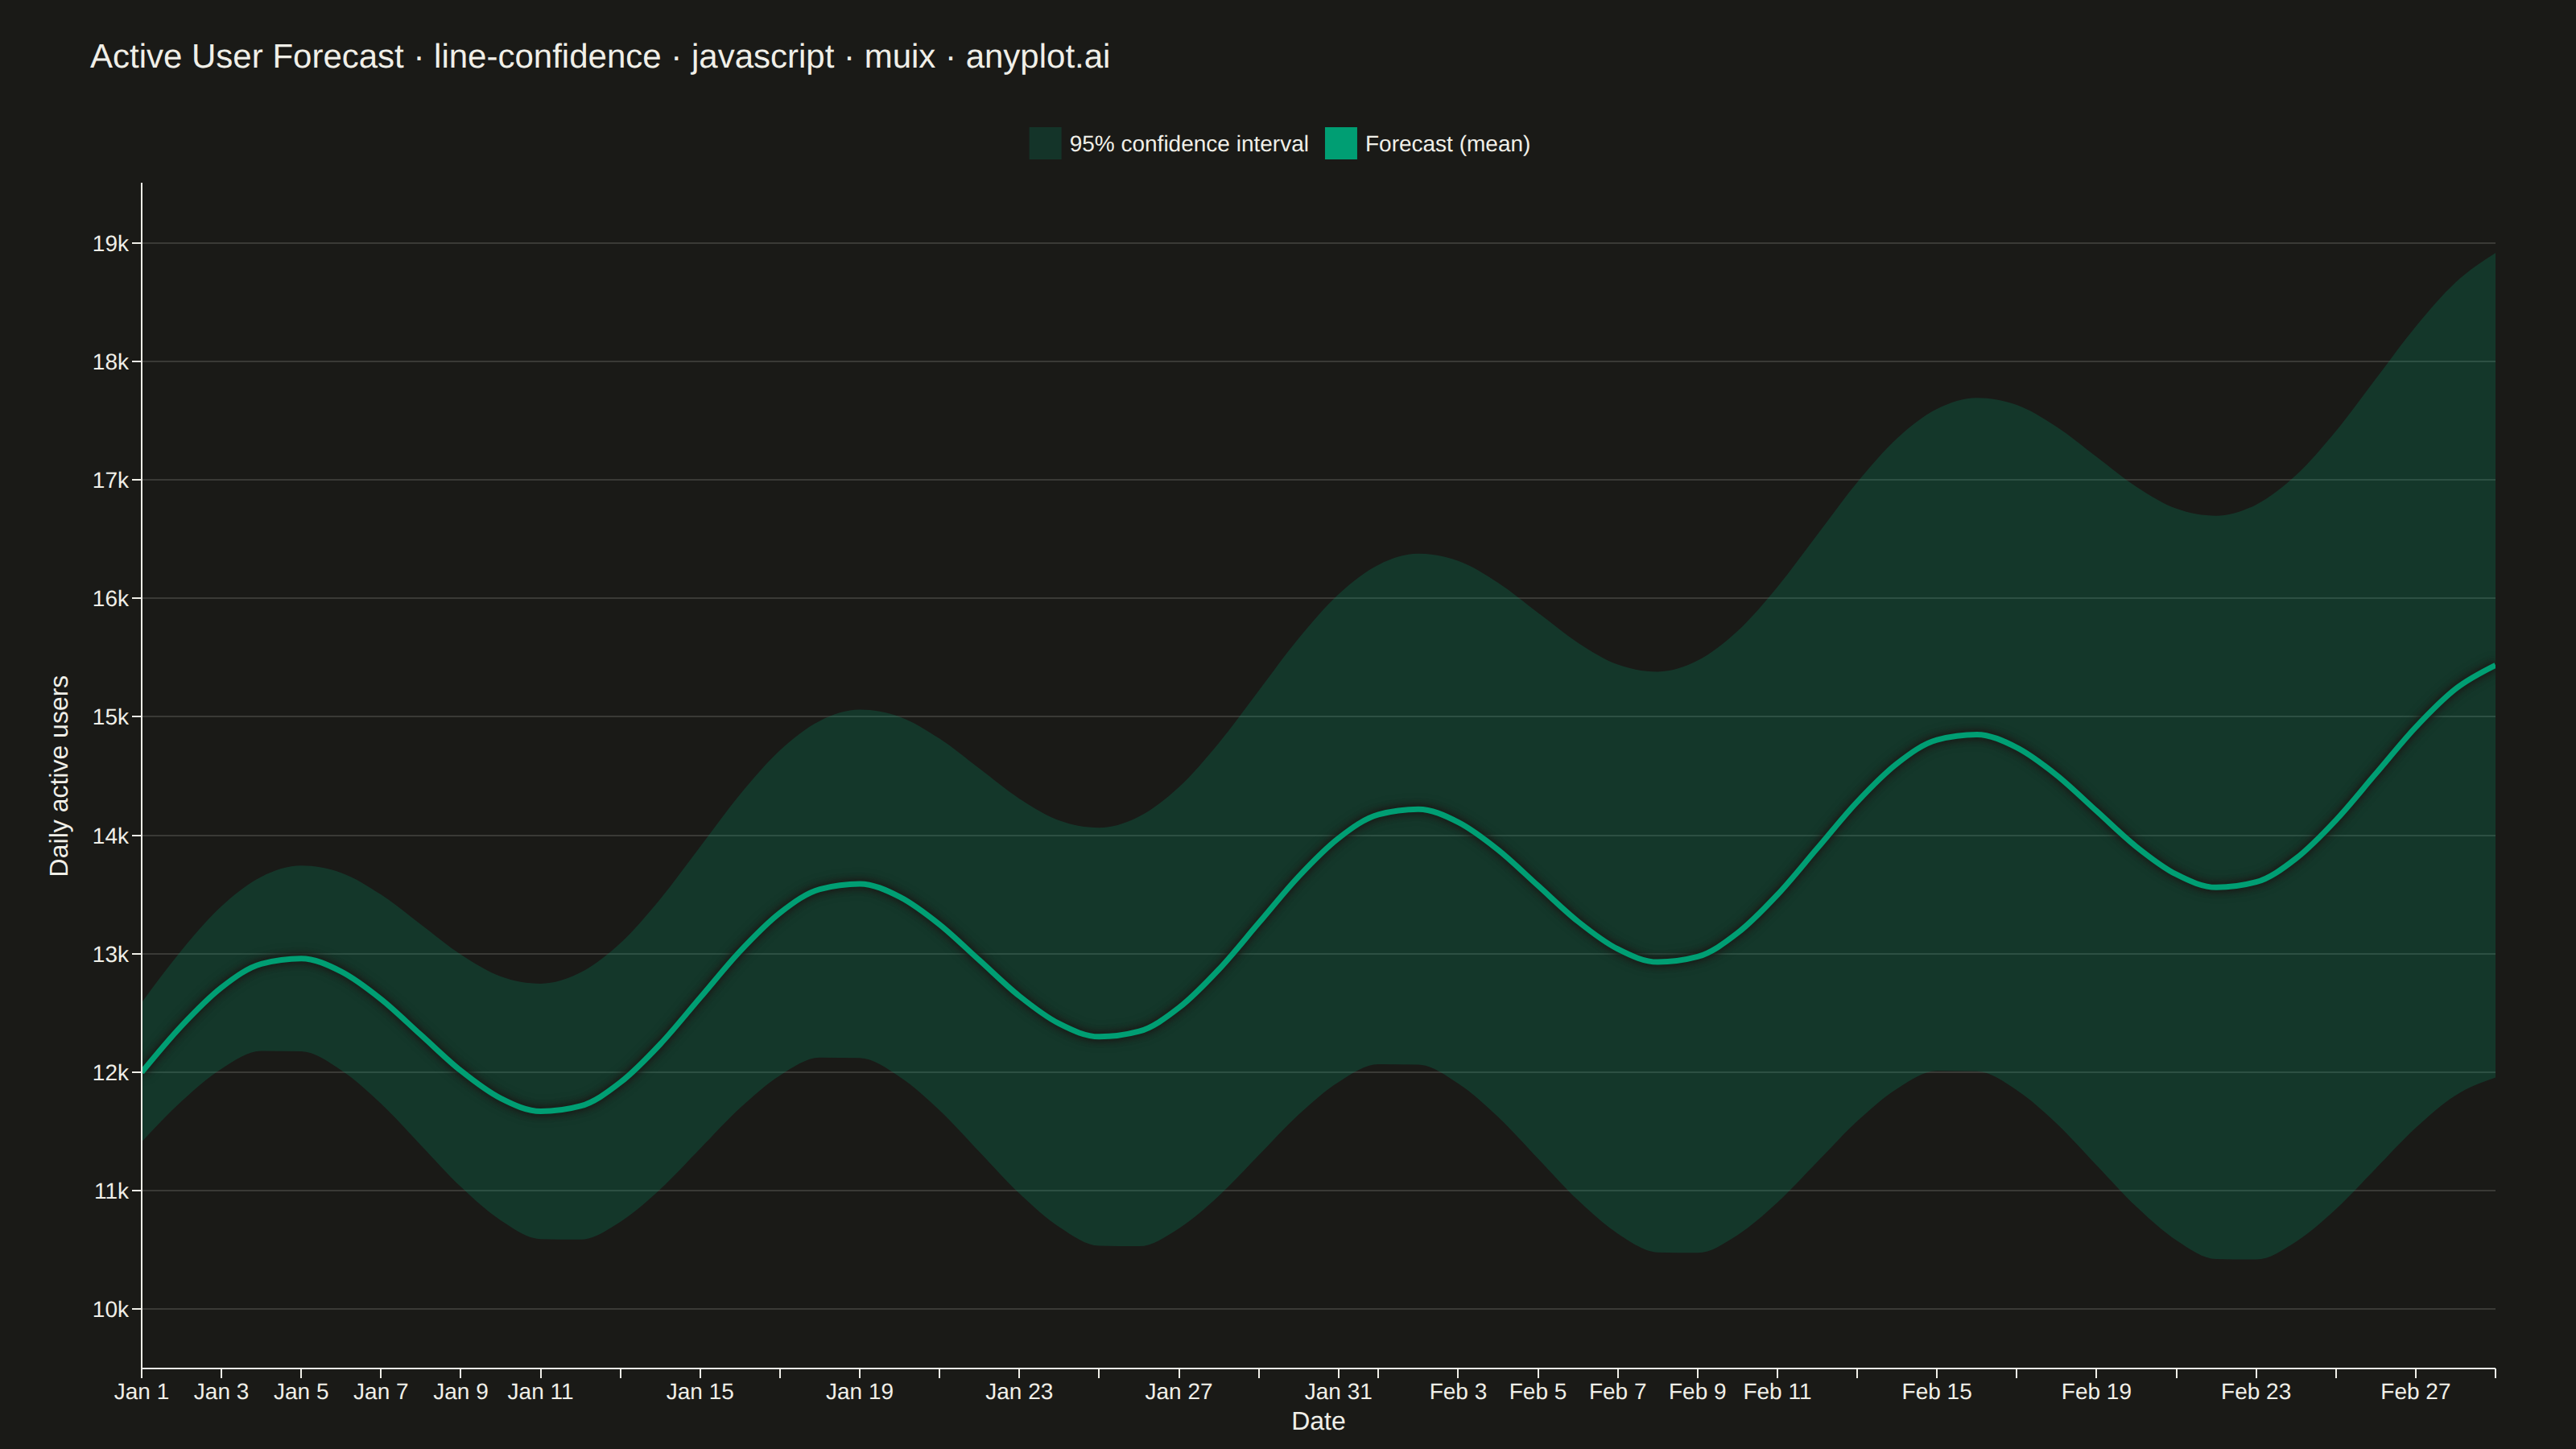
The same plot in 14 other libraries — JavaScript: Chart.js, D3.js, Apache ECharts, Highcharts; Python: Altair, Bokeh, lets-plot, Matplotlib, Plotly, plotnine, Pygal, Seaborn; R: ggplot2; Julia: Makie.jl. Compare all 15 side by side: Line Plot with Confidence Interval in Python, R, Julia and JavaScript.
A line plot with a confidence interval displays a central trend line (typically mean or median) surrounded by a shaded band representing uncertainty or variability. The combination of a clear central line and semi-transparent confidence region effectively communicates both the estimated value and its associated uncertainty, making it essential for visualizing statistical estimates, model predictions, and forecast ranges.
// anyplot.ai
// line-confidence: Line Plot with Confidence Interval
// Library: muix 7.29.1 | JavaScript 22.23.2
// Quality: 88/100 | Created: 2026-09-05
import { LineChart } from "@mui/x-charts/LineChart";
import Box from "@mui/material/Box";
import Typography from "@mui/material/Typography";

const t = window.ANYPLOT_TOKENS;

// --- Data (in-memory, deterministic) ---------------------------------------
// A 60-day daily-active-user forecast: a rising trend with weekly seasonality,
// paired with a 95% prediction interval that widens the further out the model
// looks — the classic shape of a forecast confidence band.
const DAY_COUNT = 60;
const START_DATE = new Date(2024, 0, 1);

const dates = Array.from(
  { length: DAY_COUNT },
  (_, i) => new Date(START_DATE.getTime() + i * 86_400_000),
);

const centralUsers = Array.from(
  { length: DAY_COUNT },
  (_, i) => 12_000 + 45 * i + 800 * Math.sin((2 * Math.PI * i) / 14),
);

// Forecast standard error grows linearly with horizon; 1.96*sigma -> 95% CI.
const halfWidths = Array.from({ length: DAY_COUNT }, (_, i) => 1.96 * (300 + 25 * i));
const lowerUsers = centralUsers.map((y, i) => y - halfWidths[i]);
const bandWidths = halfWidths.map((h) => 2 * h);

// --- Chart (default-exported component — the harness mounts it) -------------
export default function Chart() {
  const W = window.ANYPLOT_SIZE.width;
  const H = window.ANYPLOT_SIZE.height;
  const CHART_TOP = 64;

  const title = "Active User Forecast · line-confidence · javascript · muix · anyplot.ai";
  const titleSize = title.length > 67 ? Math.round((22 * 67) / title.length) : 22;

  return (
    <Box sx={{ position: "relative", width: W, height: H, bgcolor: t.pageBg }}>
      <Box sx={{ position: "absolute", top: 20, left: 56, right: 56 }}>
        <Typography sx={{ color: t.ink, fontSize: titleSize, fontWeight: 500 }}>{title}</Typography>
      </Box>
      <Box sx={{ position: "absolute", top: CHART_TOP, left: 0, right: 0, bottom: 0 }}>
        <LineChart
          width={W}
          height={H - CHART_TOP}
          skipAnimation
          series={[
            {
              id: "lower",
              data: lowerUsers,
              stack: "confidence",
              area: true,
              color: t.palette[0],
              showMark: false,
            },
            {
              id: "band",
              data: bandWidths,
              label: "95% confidence interval",
              stack: "confidence",
              area: true,
              color: "rgba(0, 158, 115, 0.2)",
              showMark: false,
            },
            {
              id: "central",
              data: centralUsers,
              label: "Forecast (mean)",
              color: t.palette[0],
              showMark: false,
            },
          ]}
          xAxis={[
            {
              data: dates,
              scaleType: "time",
              label: "Date",
              labelStyle: { fontSize: 16 },
              tickLabelStyle: { fontSize: 14 },
              valueFormatter: (value: Date) =>
                value.toLocaleDateString("en-US", { month: "short", day: "numeric" }),
            },
          ]}
          yAxis={[
            {
              label: "Daily active users",
              labelStyle: { fontSize: 16 },
              tickFontSize: 30,
              tickLabelStyle: { fontSize: 14 },
              min: 9500,
              max: 19500,
              valueFormatter: (value: number) => `${Math.round(value / 1000)}k`,
            },
          ]}
          margin={{ left: 88 }}
          grid={{ horizontal: true }}
          slotProps={{ legend: { labelStyle: { fontSize: 14 } } }}
          sx={{
            "& .MuiLineElement-series-central": {
              strokeWidth: 3.5,
              filter: `drop-shadow(0 0 2.5px ${t.pageBg}) drop-shadow(0 0 2.5px ${t.pageBg})`,
            },
            "& .MuiAreaElement-series-lower": { display: "none" },
            "& .MuiLineElement-series-lower": { display: "none" },
            "& .MuiLineElement-series-band": { display: "none" },
            // MUI X derives the area's *fill* from `d3Color(color).brighter(0.5).formatHex()`,
            // which drops any alpha channel in the series `color` — override fill/fillOpacity
            // directly so the band is genuinely semi-transparent (spec: alpha 0.2-0.4).
            "& .MuiAreaElement-series-band": { fill: t.palette[0], fillOpacity: 0.22 },
          }}
        />
      </Box>
    </Box>
  );
}
Runnable source as JSON, for any HTTP client: https://api.anyplot.ai/specs/line-confidence/muix/code. Any spec id and library id listed in llms-full.txt fit the same URL shape; every URL below is complete and callable.
{
  "spec_id": "line-confidence",
  "language": "javascript",
  "library": "muix",
  "page": "https://anyplot.ai/line-confidence/javascript/muix",
  "hub": "https://anyplot.ai/line-confidence",
  "code_json": "https://api.anyplot.ai/specs/line-confidence/muix/code",
  "spec_json": "https://api.anyplot.ai/specs/line-confidence",
  "render_light_png": "https://storage.googleapis.com/anyplot-images/plots/line-confidence/javascript/muix/plot-light.png",
  "render_dark_png": "https://storage.googleapis.com/anyplot-images/plots/line-confidence/javascript/muix/plot-dark.png",
  "interactive_light_html": "https://storage.googleapis.com/anyplot-images/plots/line-confidence/javascript/muix/plot-light.html",
  "interactive_dark_html": "https://storage.googleapis.com/anyplot-images/plots/line-confidence/javascript/muix/plot-dark.html",
  "quality_score": 88.0,
  "license": "MIT",
  "guide": "https://anyplot.ai/llms.txt"
}
Part of Line Plot with Confidence Interval on anyplot.ai.