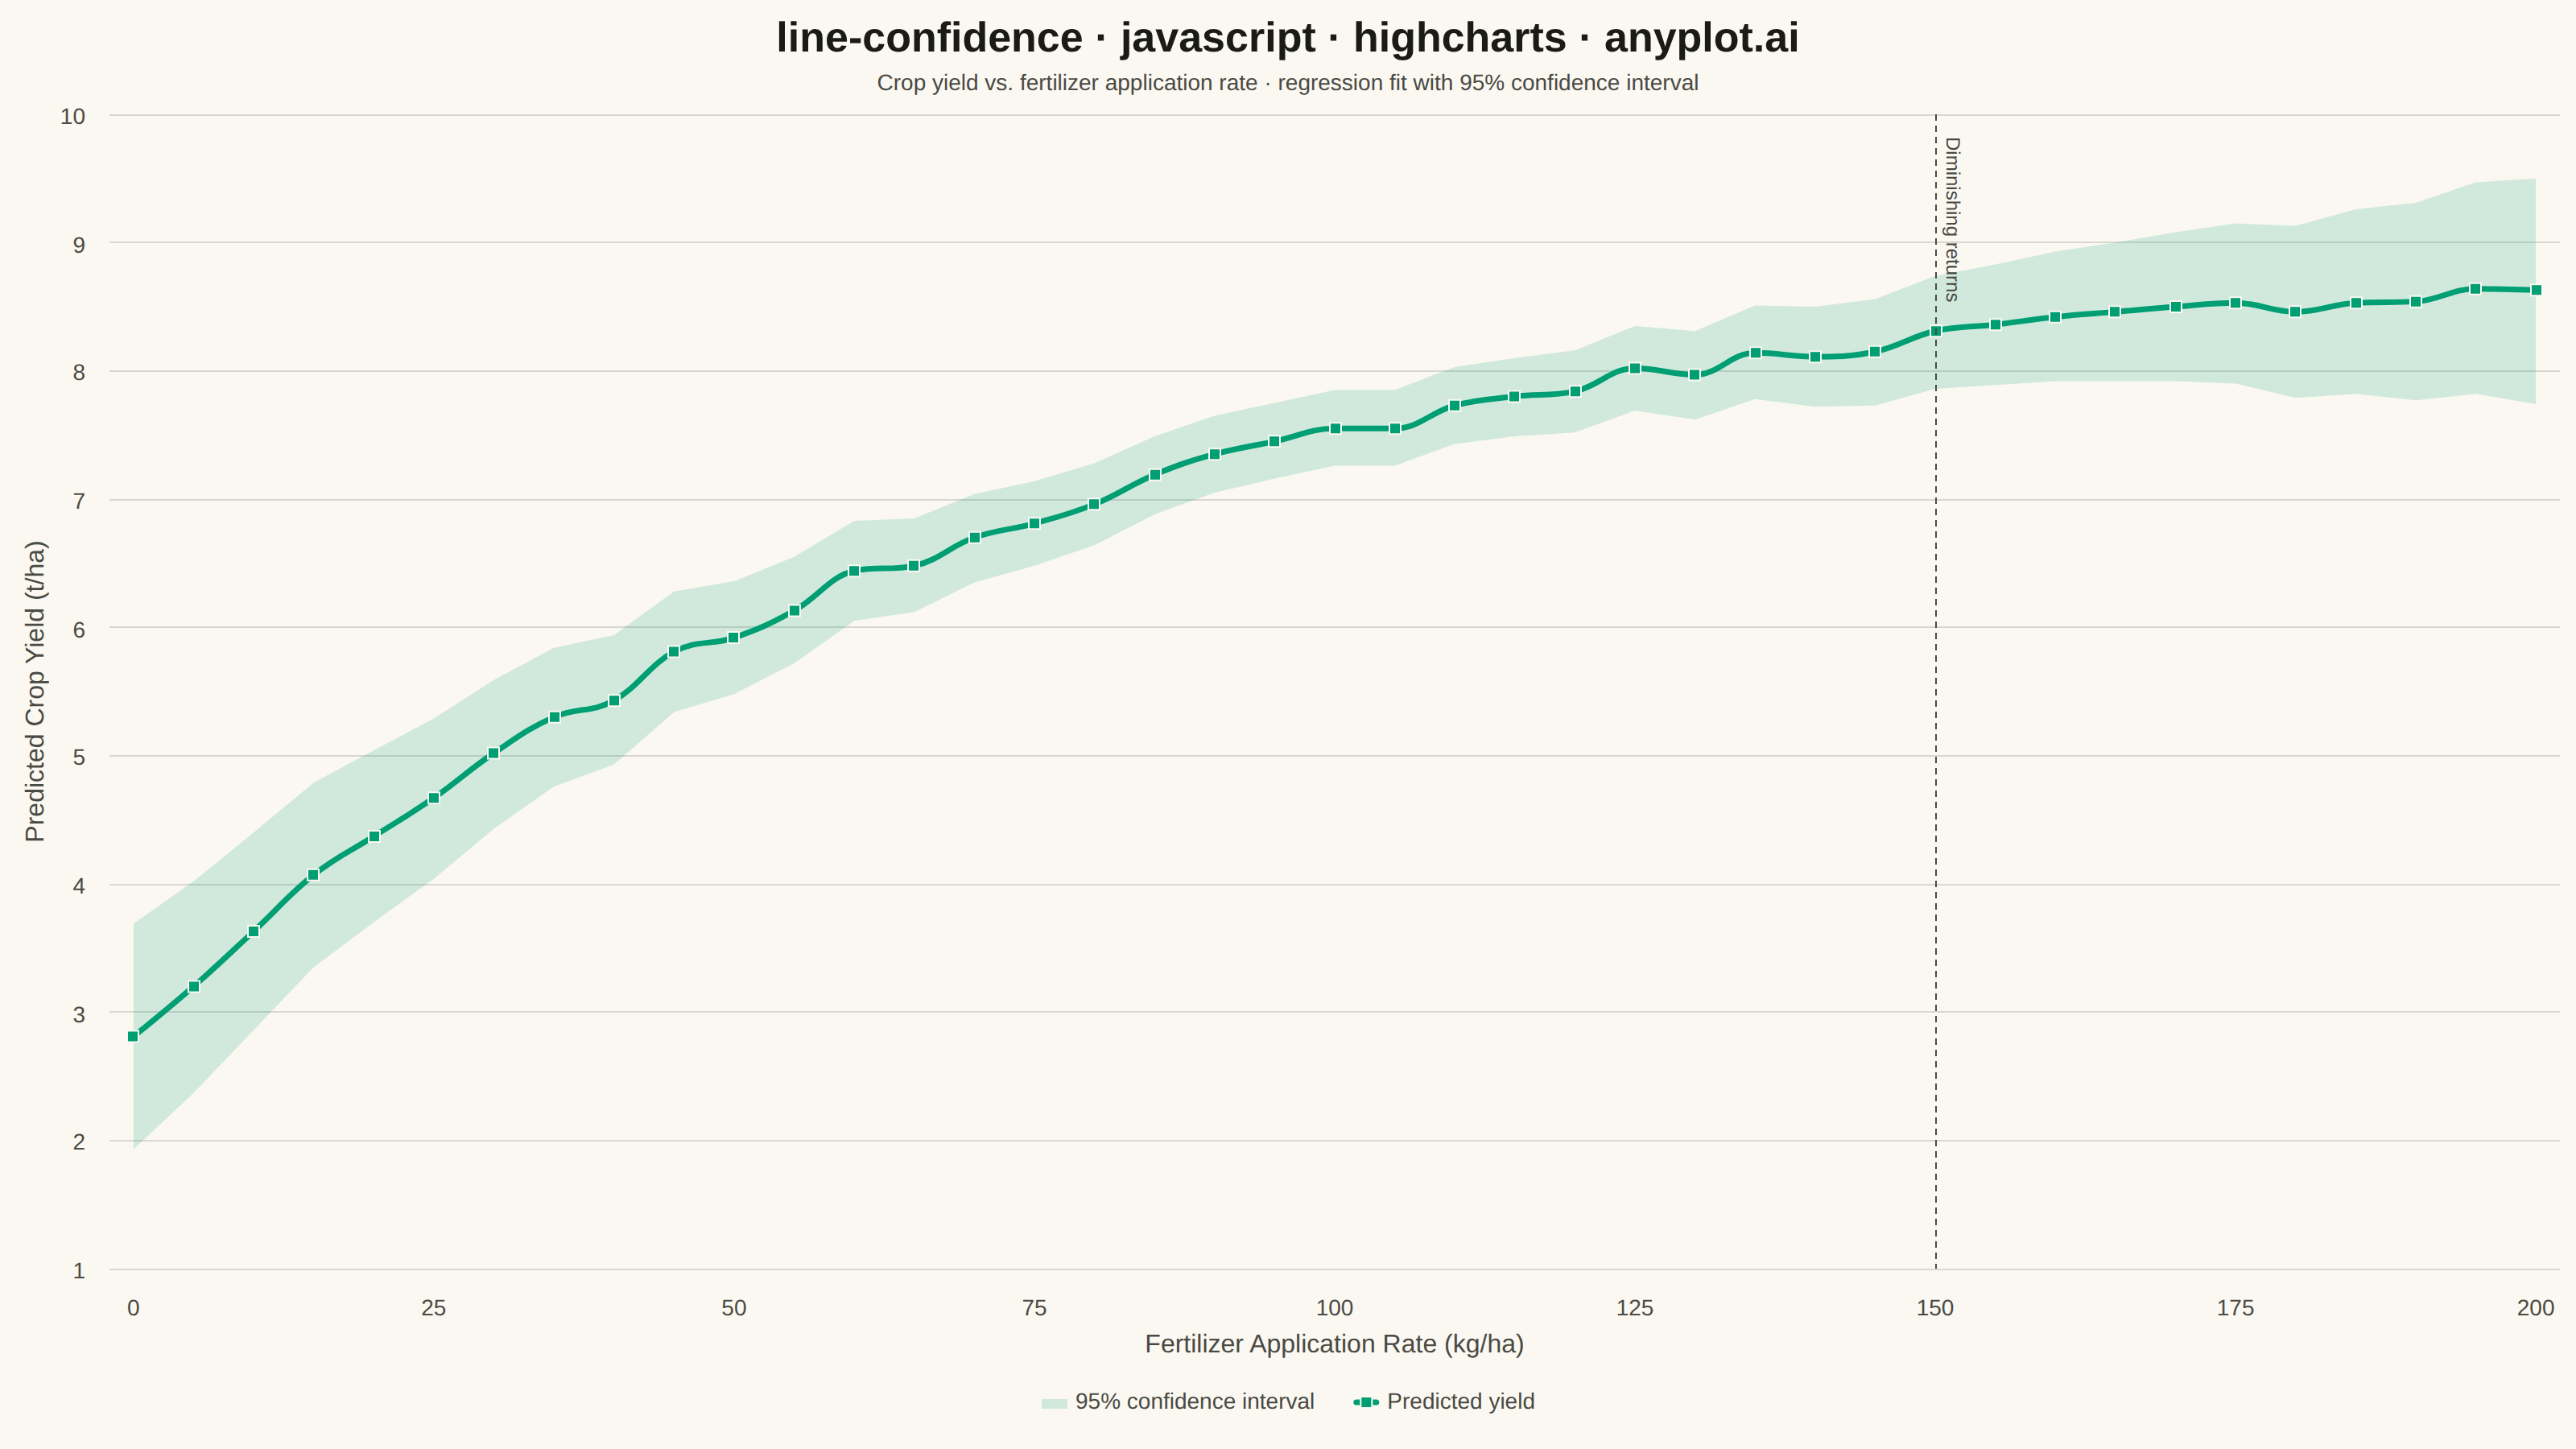
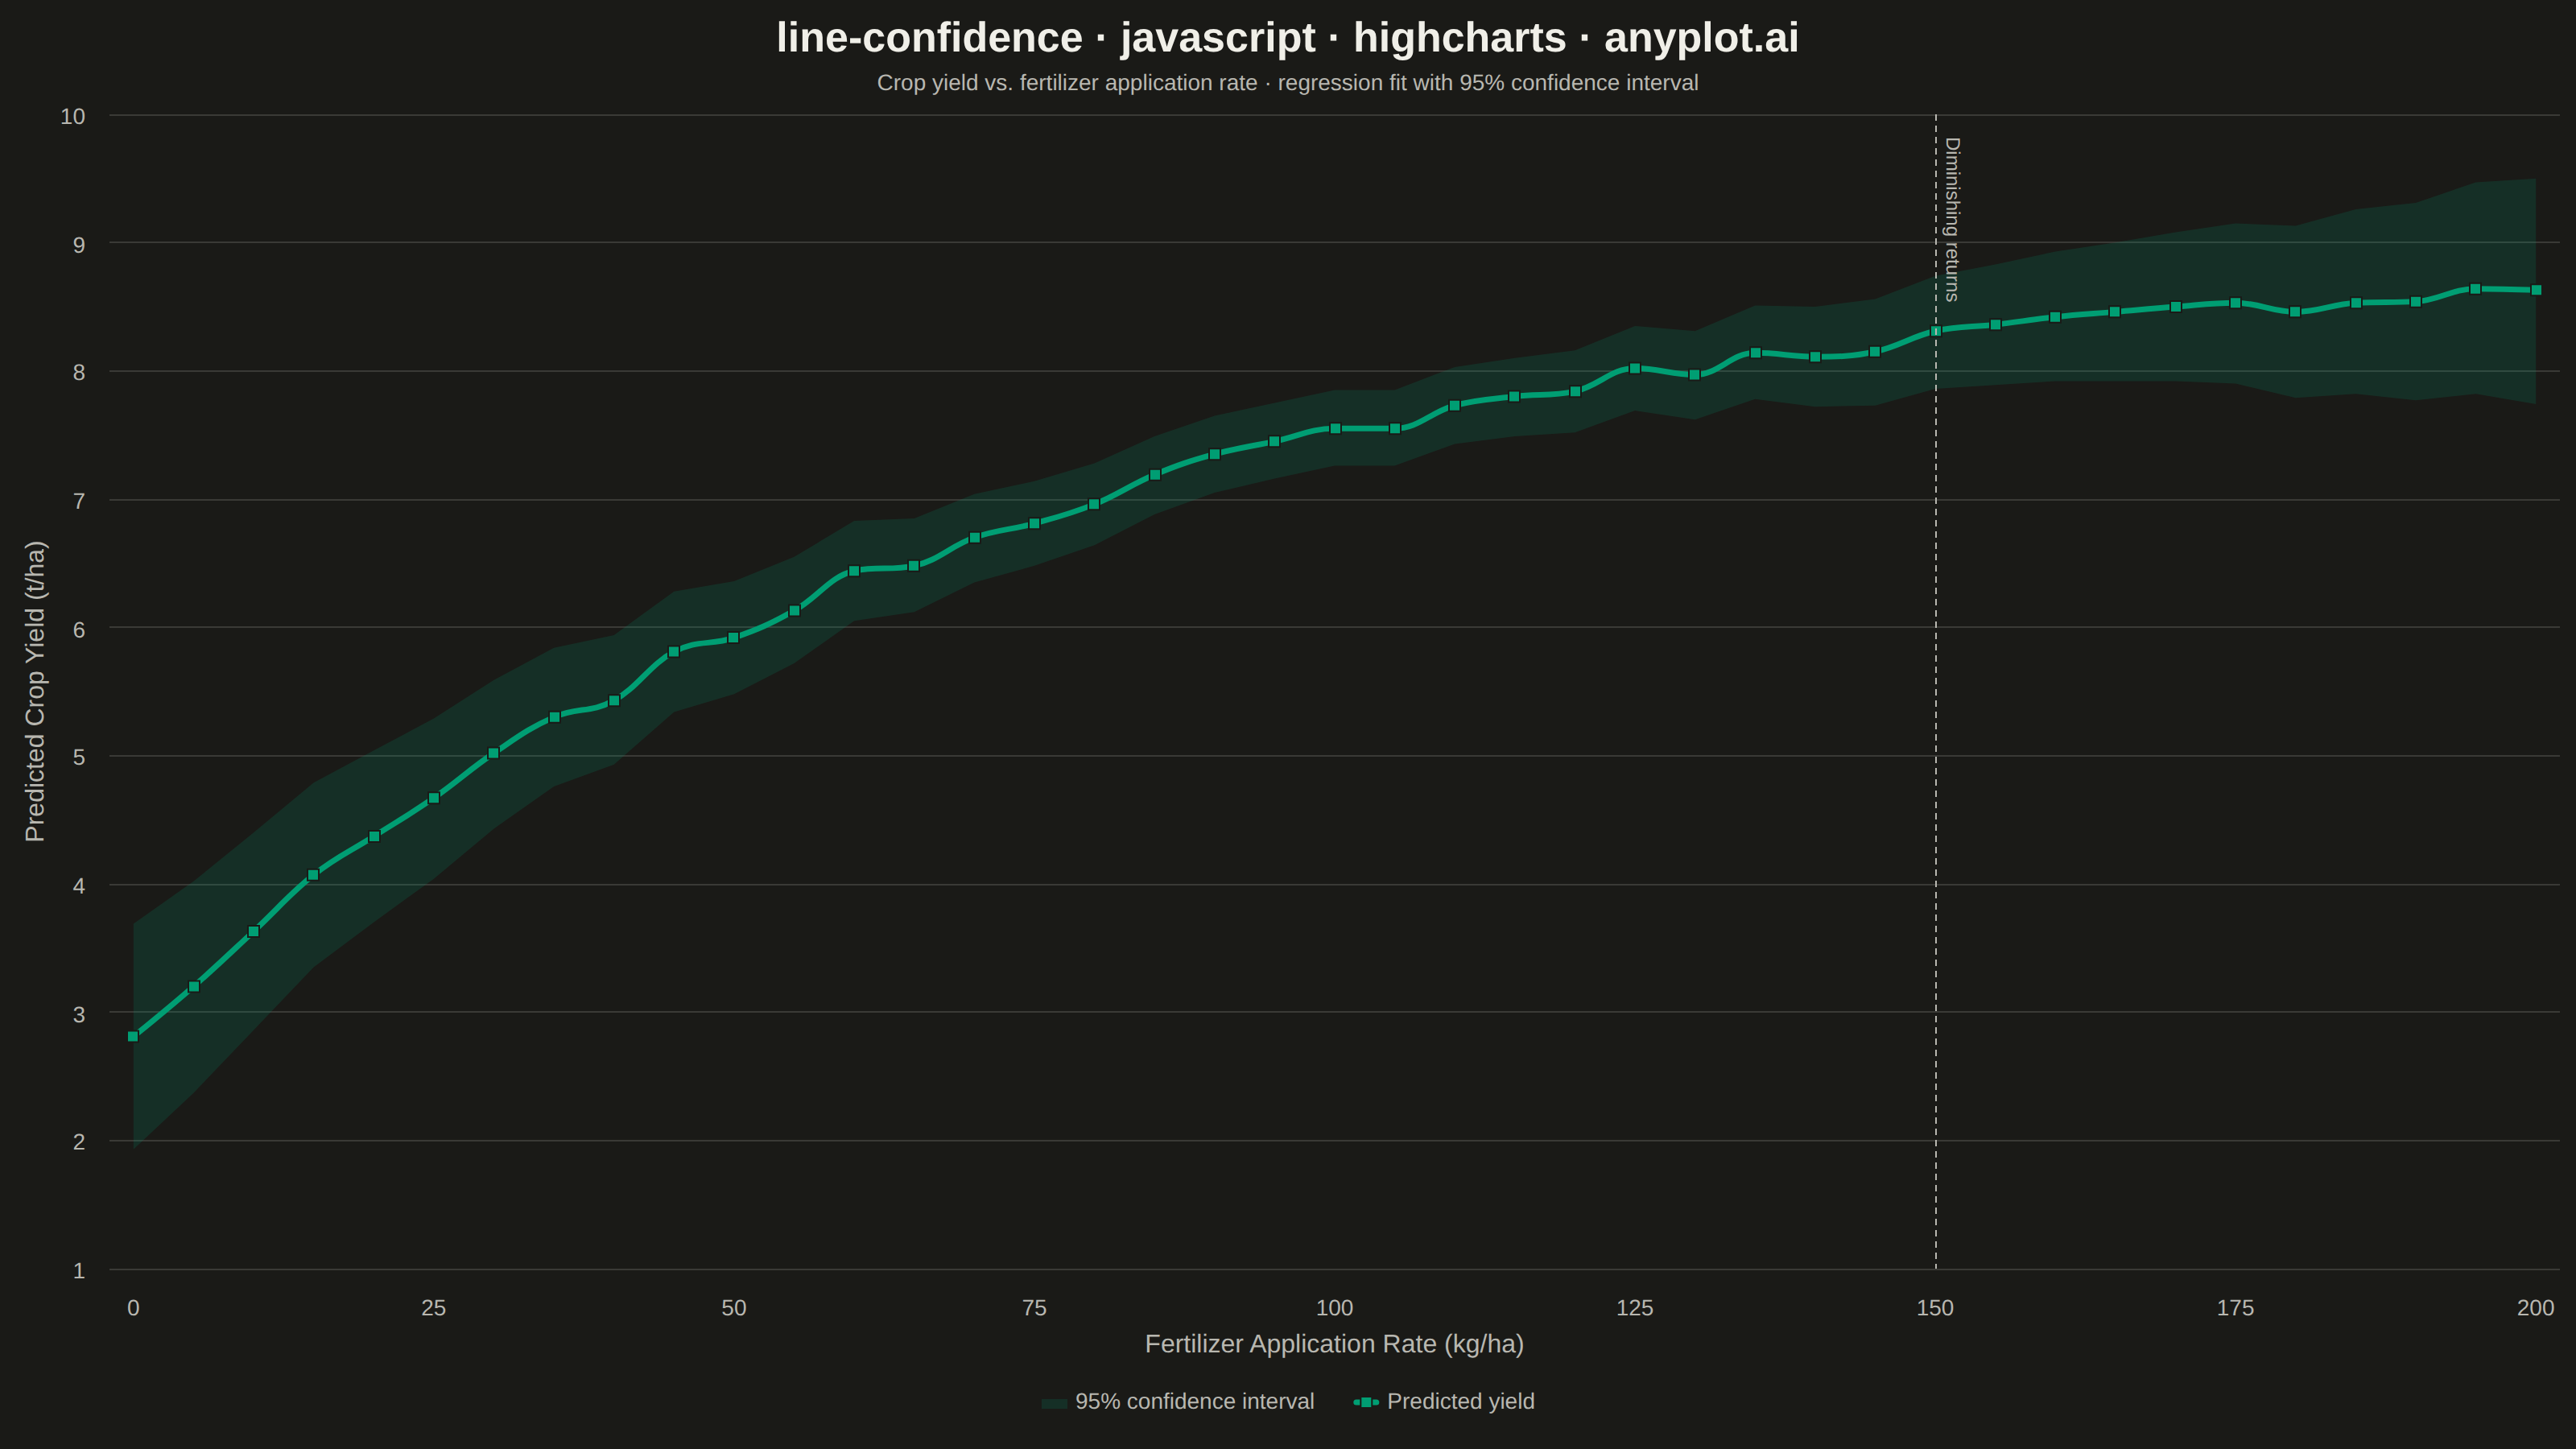
The same plot in 14 other libraries — JavaScript: Chart.js, D3.js, Apache ECharts, MUI X Charts; Python: Altair, Bokeh, lets-plot, Matplotlib, Plotly, plotnine, Pygal, Seaborn; R: ggplot2; Julia: Makie.jl. Compare all 15 side by side: Line Plot with Confidence Interval in Python, R, Julia and JavaScript.
A line plot with a confidence interval displays a central trend line (typically mean or median) surrounded by a shaded band representing uncertainty or variability. The combination of a clear central line and semi-transparent confidence region effectively communicates both the estimated value and its associated uncertainty, making it essential for visualizing statistical estimates, model predictions, and forecast ranges.
// anyplot.ai
// line-confidence: Line Plot with Confidence Interval
// Library: highcharts 12.6.0 | JavaScript 22.23.2
// Quality: 91/100 | Created: 2026-09-05

const t = window.ANYPLOT_TOKENS;

// --- Data (in-memory, deterministic) ----------------------------------------
// Regression fit of crop yield against fertilizer application rate. The 95%
// confidence band follows the classic prediction-interval shape: narrowest
// near the mean of x (most data support) and widening toward both extremes,
// unlike a forecast band that only widens in one direction over time.
let seed = 7;
function nextRandom() {
  seed = (seed * 1103515245 + 12345) % 2147483648;
  return seed / 2147483648;
}

const rateStep = 5; // kg/ha
const rateMean = 100; // kg/ha, center of the sampled range
const lowerBase = []; // invisible stack base = y_lower
const bandHeight = []; // stacked on top of lowerBase to reach y_upper
const centerLine = []; // fitted trend

for (let rate = 0; rate <= 200; rate += rateStep) {
  const fit = 2.8 + 6.2 * (1 - Math.exp(-rate / 70)); // diminishing-returns fit
  const wobble = (nextRandom() - 0.5) * 0.15; // small residual scatter
  const center = fit + wobble;
  const se = 0.15 + 0.00003 * (rate - rateMean) ** 2; // bowtie-shaped std. error
  const halfWidth = 1.96 * se; // 95% prediction interval

  lowerBase.push(Math.round((center - halfWidth) * 100) / 100);
  bandHeight.push(Math.round(halfWidth * 2 * 100) / 100);
  centerLine.push(Math.round(center * 100) / 100);
}

const rates = [];
for (let rate = 0; rate <= 200; rate += rateStep) rates.push(rate);

const bandFill = Highcharts.color(t.palette[0]).setOpacity(0.22).get();

// --- Chart -------------------------------------------------------------------
Highcharts.chart("container", {
  chart: {
    backgroundColor: "transparent",
    animation: false,
    style: { fontFamily: "inherit" },
  },
  credits: { enabled: false },
  colors: t.palette,
  title: {
    text: "line-confidence · javascript · highcharts · anyplot.ai",
    style: { color: t.ink, fontSize: "26px", fontWeight: "700" },
  },
  subtitle: {
    text: "Crop yield vs. fertilizer application rate · regression fit with 95% confidence interval",
    style: { color: t.inkSoft, fontSize: "14px" },
  },
  xAxis: {
    title: {
      text: "Fertilizer Application Rate (kg/ha)",
      style: { color: t.inkSoft, fontSize: "16px" },
    },
    lineWidth: 0,
    tickWidth: 0,
    gridLineColor: t.grid,
    tickInterval: 25,
    labels: { style: { color: t.inkSoft, fontSize: "14px" } },
    // Diminishing-returns marker: the fit's slope flattens sharply past this
    // rate, so a light guide line + label reinforces the story the band and
    // curve already tell.
    plotLines: [
      {
        value: 150,
        color: t.inkSoft,
        dashStyle: "Dash",
        width: 1,
        zIndex: 4,
        label: {
          text: "Diminishing returns",
          align: "left",
          x: 6,
          y: 14,
          style: { color: t.inkSoft, fontSize: "12px" },
        },
      },
    ],
  },
  yAxis: {
    title: {
      text: "Predicted Crop Yield (t/ha)",
      style: { color: t.inkSoft, fontSize: "16px" },
    },
    // The stacking trick anchors an invisible spacer series at 0, which would
    // otherwise force the axis to start at 0 and waste most of the canvas
    // below the ~2-9 t/ha data range. Cropping the visible min is safe: the
    // spacer stays fully transparent, so the stacking math is unaffected.
    min: 1.5,
    lineWidth: 0,
    tickWidth: 0,
    gridLineColor: t.grid,
    labels: { style: { color: t.inkSoft, fontSize: "14px" } },
  },
  legend: {
    symbolRadius: 2,
    itemDistance: 24,
    itemStyle: { color: t.inkSoft, fontSize: "14px" },
    itemHoverStyle: { color: t.ink },
  },
  tooltip: { shared: true, valueSuffix: " t/ha" },
  plotOptions: {
    series: { animation: false, marker: { enabled: false } },
  },
  series: [
    // Stacking order matters: Highcharts stacks the FIRST series in this array
    // as the cumulative top of the stack, and the LAST as the base at 0. So the
    // visible band goes first (rendering from y_lower to y_upper) and the
    // invisible spacer goes second (rendering from 0 to y_lower, hidden).
    {
      name: "95% confidence interval",
      type: "area",
      data: rates.map((rate, i) => [rate, bandHeight[i]]),
      stacking: "normal",
      color: bandFill,
      lineWidth: 0,
      enableMouseTracking: false,
      showInLegend: true,
    },
    {
      name: "Lower bound",
      type: "area",
      data: rates.map((rate, i) => [rate, lowerBase[i]]),
      stacking: "normal",
      color: "transparent",
      fillOpacity: 0,
      lineWidth: 0,
      enableMouseTracking: false,
      showInLegend: false,
    },
    {
      name: "Predicted yield",
      type: "spline",
      data: rates.map((rate, i) => [rate, centerLine[i]]),
      color: t.palette[0],
      lineWidth: 3.5,
      marker: {
        enabled: true,
        radius: 3.5,
        fillColor: t.palette[0],
        lineWidth: 1,
        lineColor: t.pageBg,
      },
      showInLegend: true,
    },
  ],
});
Runnable source as JSON, for any HTTP client: https://api.anyplot.ai/specs/line-confidence/highcharts/code. Any spec id and library id listed in llms-full.txt fit the same URL shape; every URL below is complete and callable.
{
  "spec_id": "line-confidence",
  "language": "javascript",
  "library": "highcharts",
  "page": "https://anyplot.ai/line-confidence/javascript/highcharts",
  "hub": "https://anyplot.ai/line-confidence",
  "code_json": "https://api.anyplot.ai/specs/line-confidence/highcharts/code",
  "spec_json": "https://api.anyplot.ai/specs/line-confidence",
  "render_light_png": "https://storage.googleapis.com/anyplot-images/plots/line-confidence/javascript/highcharts/plot-light.png",
  "render_dark_png": "https://storage.googleapis.com/anyplot-images/plots/line-confidence/javascript/highcharts/plot-dark.png",
  "interactive_light_html": "https://storage.googleapis.com/anyplot-images/plots/line-confidence/javascript/highcharts/plot-light.html",
  "interactive_dark_html": "https://storage.googleapis.com/anyplot-images/plots/line-confidence/javascript/highcharts/plot-dark.html",
  "quality_score": 91.0,
  "license": "MIT",
  "guide": "https://anyplot.ai/llms.txt"
}
Part of Line Plot with Confidence Interval on anyplot.ai.