The same plot in 14 other libraries — JavaScript: Chart.js, D3.js, Highcharts, MUI X Charts; Python: Altair, Bokeh, lets-plot, Matplotlib, Plotly, plotnine, Pygal, Seaborn; R: ggplot2; Julia: Makie.jl. Compare all 15 side by side: Line Plot with Confidence Interval in Python, R, Julia and JavaScript.
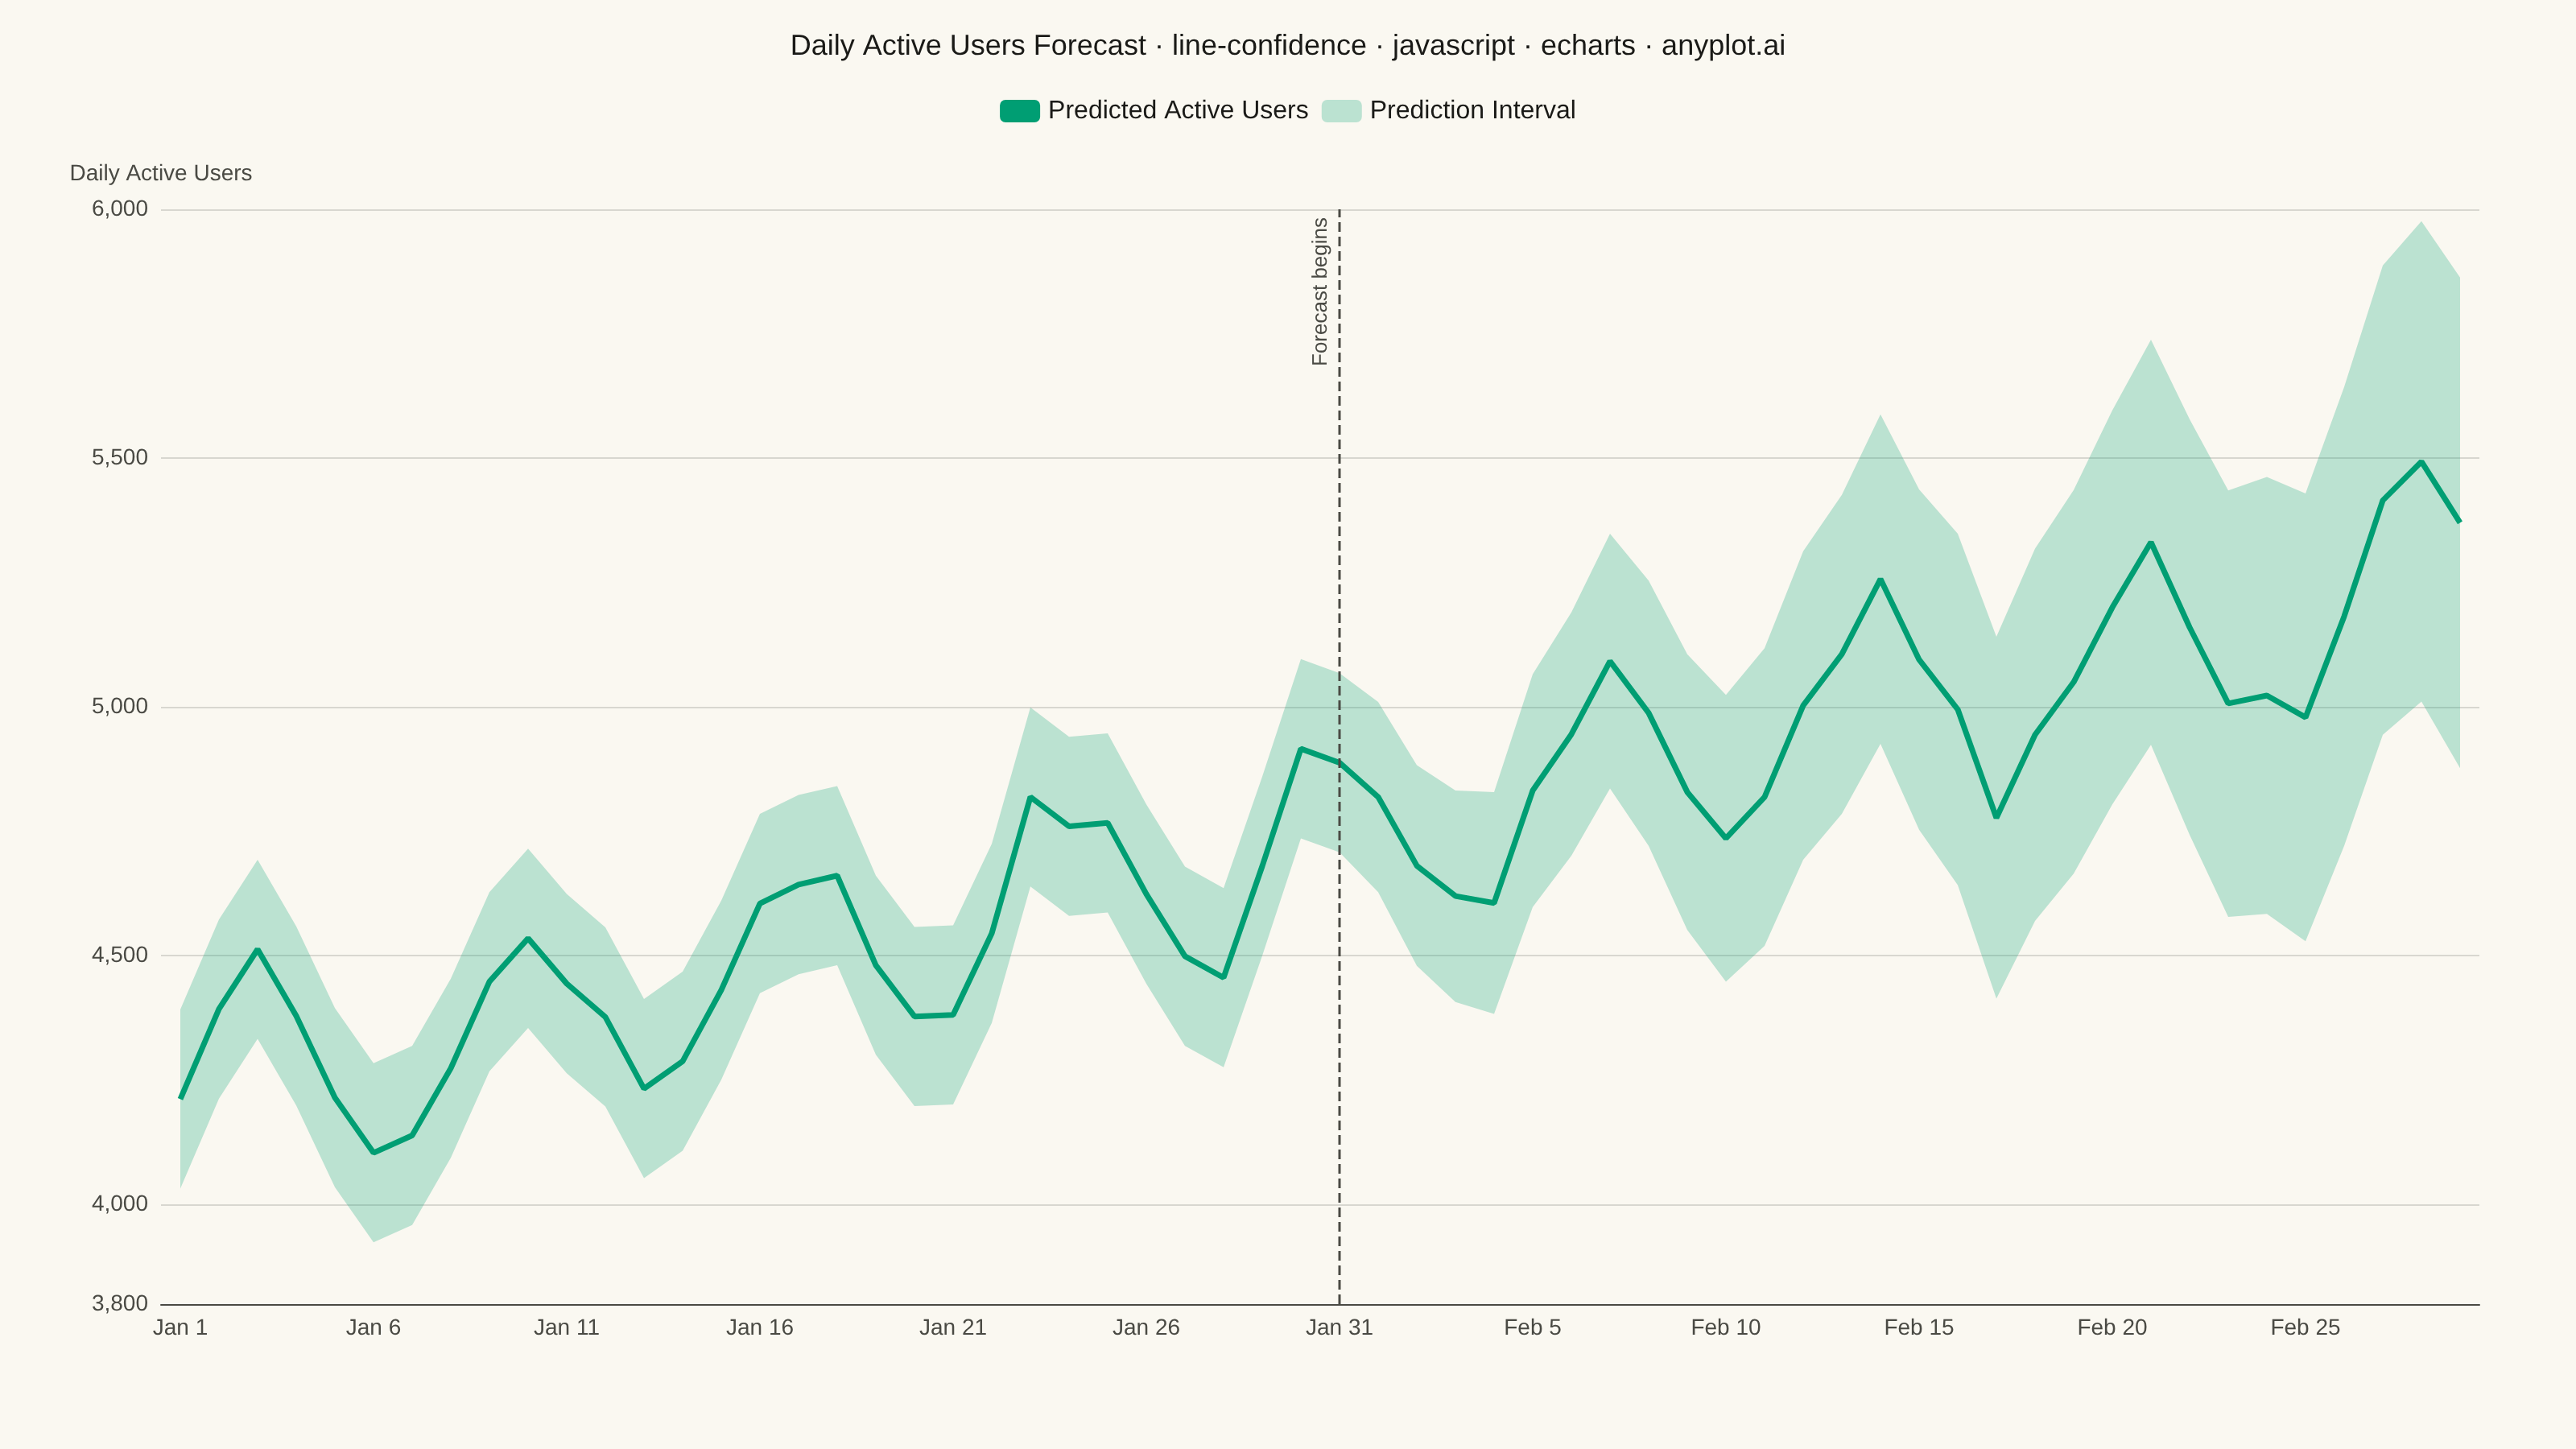
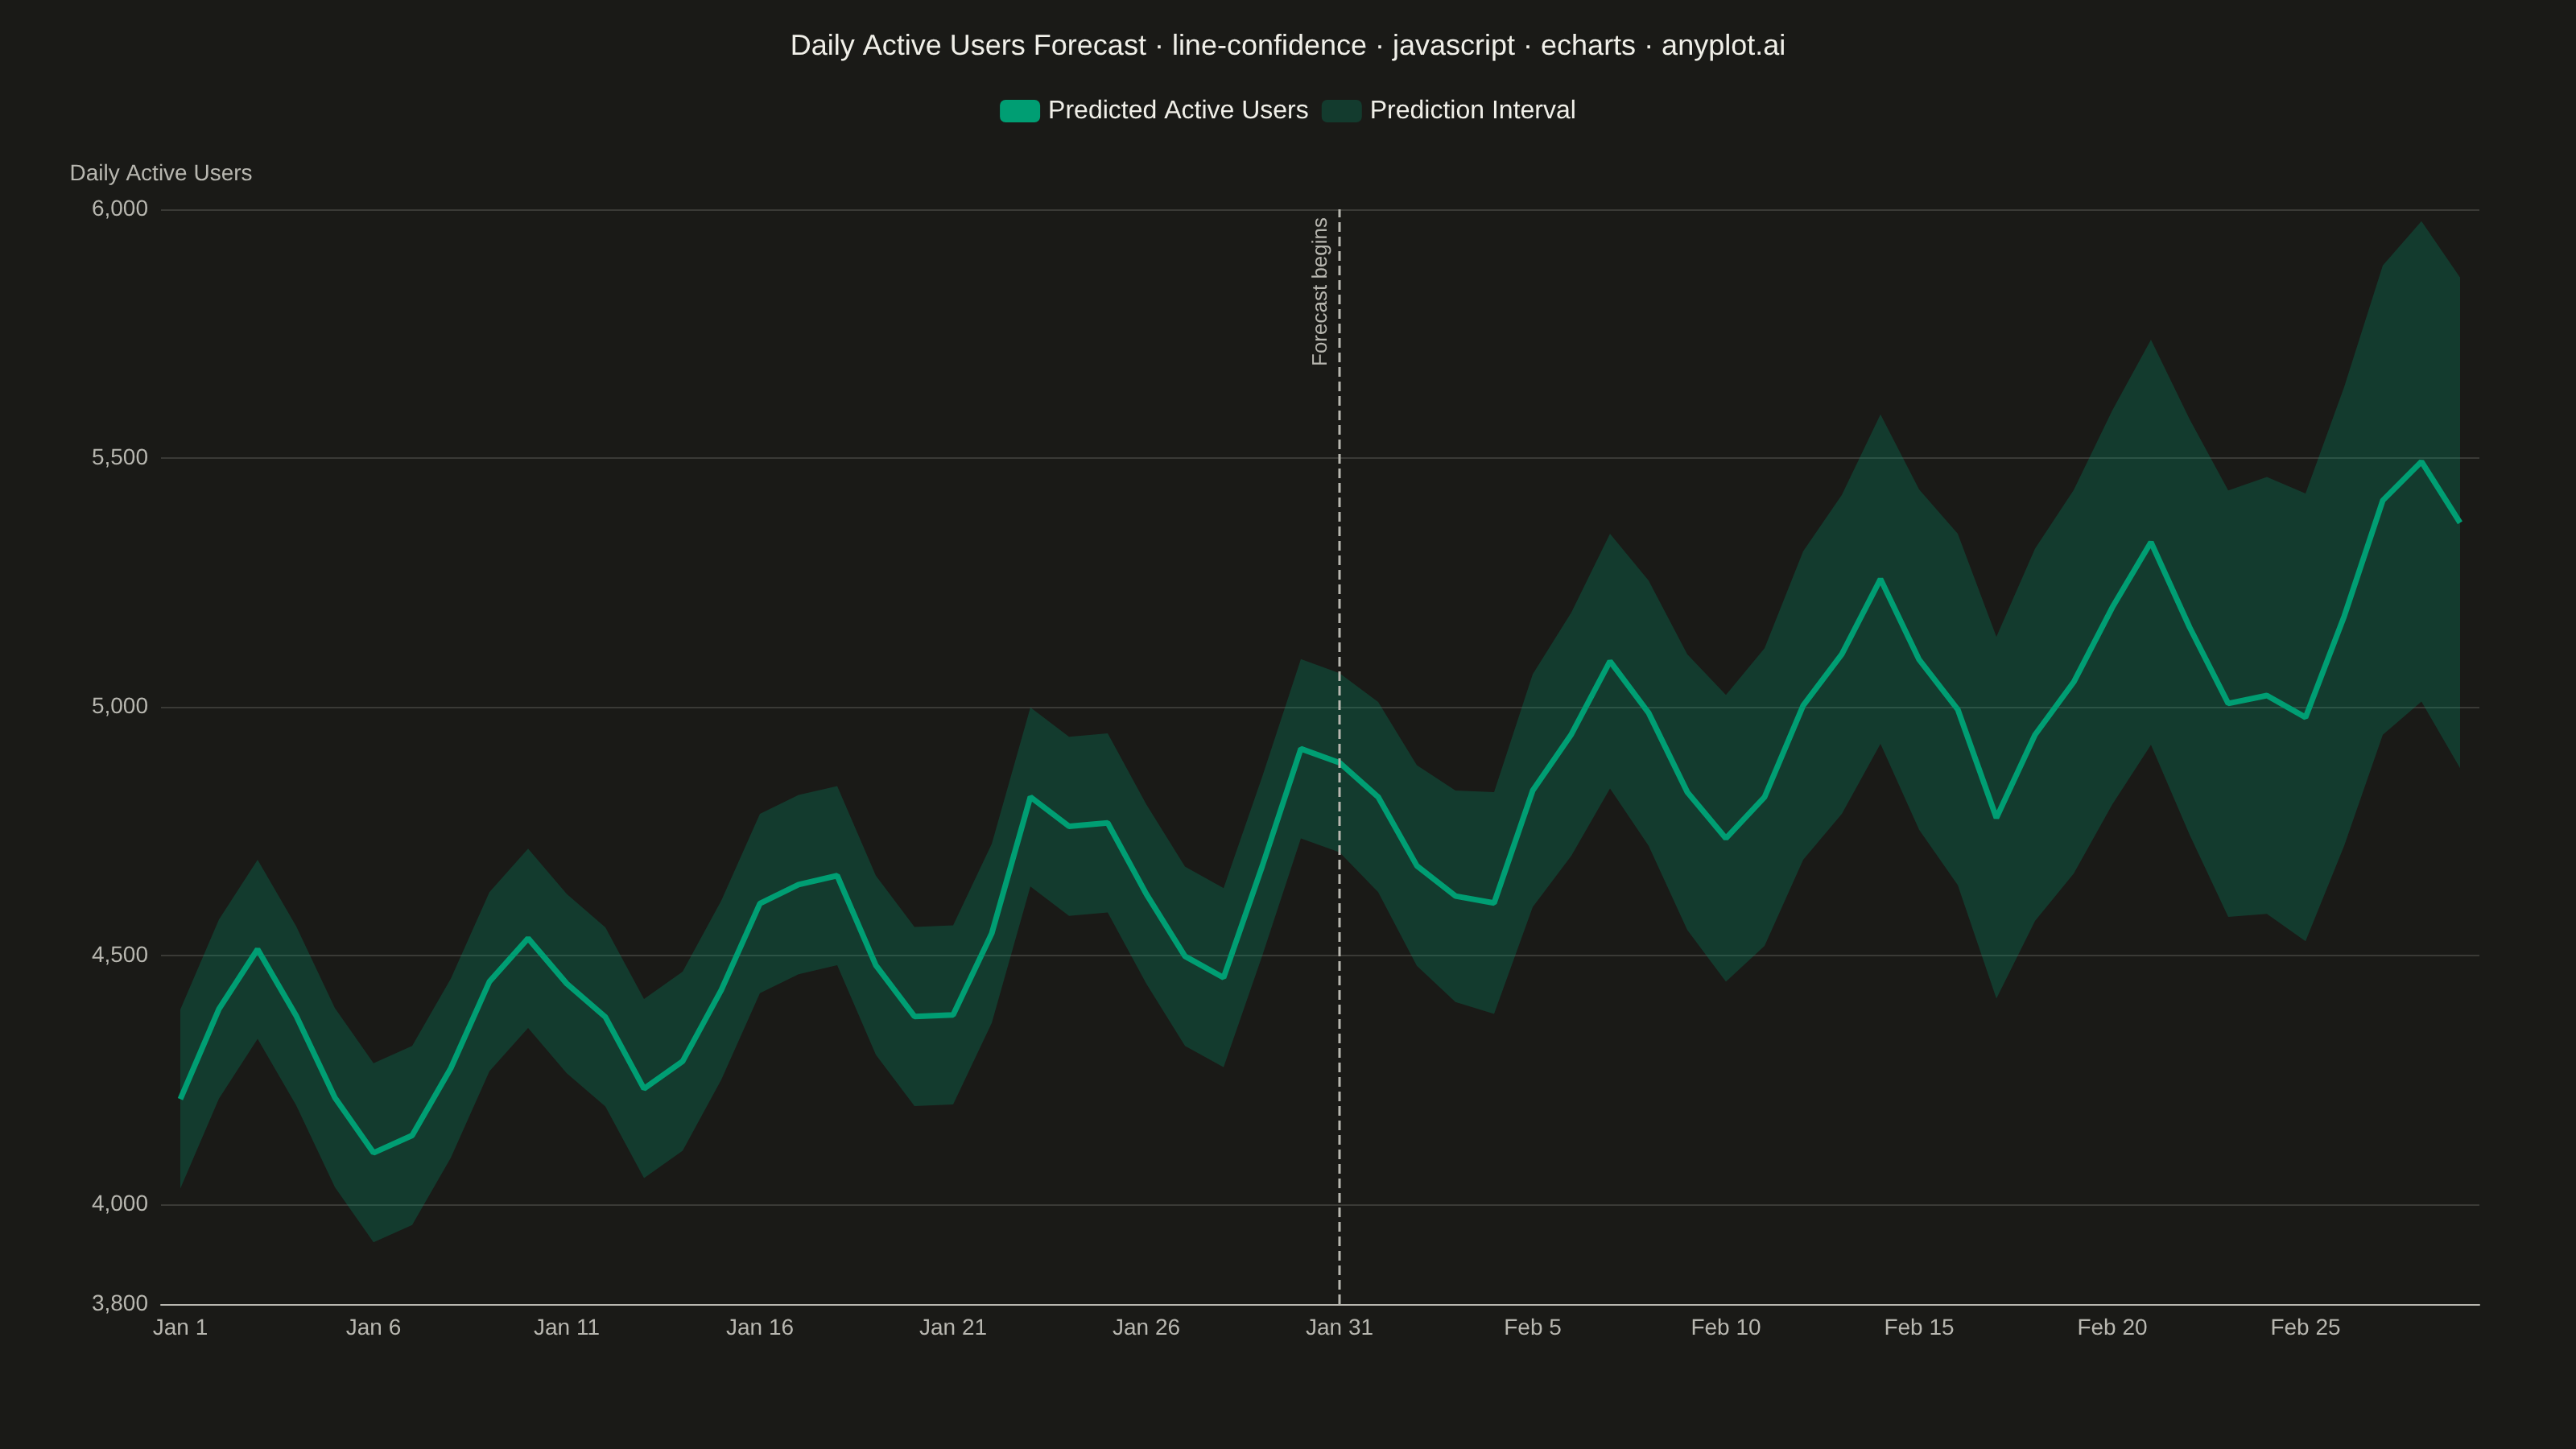
A line plot with a confidence interval displays a central trend line (typically mean or median) surrounded by a shaded band representing uncertainty or variability. The combination of a clear central line and semi-transparent confidence region effectively communicates both the estimated value and its associated uncertainty, making it essential for visualizing statistical estimates, model predictions, and forecast ranges.
// anyplot.ai
// line-confidence: Line Plot with Confidence Interval
// Library: echarts 6.1.0 | JavaScript 22.23.2
// Quality: 92/100 | Created: 2026-09-05

//# anyplot-orientation: landscape
const t = window.ANYPLOT_TOKENS;

// --- Data (in-memory, deterministic LCG) ------------------------------------
function lcg(seed) {
  let state = seed;
  return () => {
    state = (state * 1103515245 + 12345) % 2147483648;
    return state / 2147483648;
  };
}
const rand = lcg(42);

const days = 60;
const startDate = new Date(2026, 0, 1);
const dates = [];
for (let i = 0; i < days; i++) {
  const d = new Date(startDate);
  d.setDate(d.getDate() + i);
  dates.push(d.toLocaleDateString("en-US", { month: "short", day: "numeric" }));
}

// Forecast model: trend + weekly seasonality + noise. Uncertainty is tight
// over the observed window (days 0-29) and widens across the forecast
// horizon (days 30-59), matching how prediction intervals grow with lead time.
const predicted = [];
const lower = [];
const upper = [];
const baseUsers = 4200;
for (let i = 0; i < days; i++) {
  const trend = i * 18;
  const weekly = Math.sin((i / 7) * Math.PI * 2) * 220;
  const noise = (rand() - 0.5) * 150;
  const value = baseUsers + trend + weekly + noise;
  const horizonFactor = i < 30 ? 1 : 1 + (i - 30) * 0.06;
  const margin = 180 * horizonFactor;
  predicted.push(Math.round(value));
  lower.push(Math.round(value - margin));
  upper.push(Math.round(value + margin));
}
const band = upper.map((u, i) => u - lower[i]);

// Zoom the y-axis to the data range (rather than starting at 0) so the trend
// and the widening confidence band aren't diluted by empty vertical space.
const yMin = Math.floor((Math.min(...lower) - 100) / 200) * 200;

// Boundary between the observed window (days 0-29) and the forecast horizon
// (days 30-59), marked on the chart so viewers can see where the forecast begins.
const forecastStart = 30;

// --- Init --------------------------------------------------------------------
const chart = echarts.init(document.getElementById("container"));

// --- Option --------------------------------------------------------------------
const title = "Daily Active Users Forecast · line-confidence · javascript · echarts · anyplot.ai";

chart.setOption({
  animation: false,
  backgroundColor: "transparent",
  color: t.palette,
  title: {
    text: title,
    left: "center",
    textStyle: { color: t.ink, fontSize: 18, fontWeight: 500 },
  },
  legend: {
    data: [
      { name: "Predicted Active Users", icon: "roundRect" },
      { name: "Prediction Interval", icon: "roundRect" },
    ],
    top: 56,
    textStyle: { color: t.ink, fontSize: 16 },
  },
  grid: { left: 100, right: 60, top: 130, bottom: 90 },
  tooltip: {
    trigger: "axis",
    formatter: (params) => {
      const shown = params.filter((p) => p.seriesName !== "Lower Bound");
      const lines = shown.map((p) => `${p.marker} ${p.seriesName}: ${p.value.toLocaleString()}`);
      return `${params[0].axisValueLabel}<br/>${lines.join("<br/>")}`;
    },
  },
  xAxis: {
    type: "category",
    data: dates,
    axisLabel: { color: t.inkSoft, fontSize: 14, interval: 4 },
    axisLine: { lineStyle: { color: t.inkSoft } },
    axisTick: { show: false },
    splitLine: { show: false },
  },
  yAxis: {
    type: "value",
    name: "Daily Active Users",
    min: yMin,
    nameTextStyle: { color: t.inkSoft, fontSize: 14 },
    axisLabel: { color: t.inkSoft, fontSize: 14 },
    axisLine: { show: false },
    splitLine: { lineStyle: { color: t.grid } },
  },
  series: [
    {
      name: "Lower Bound",
      type: "line",
      data: lower,
      stack: "confidence-band",
      symbol: "none",
      lineStyle: { opacity: 0 },
      silent: true,
      tooltip: { show: false },
    },
    {
      name: "Prediction Interval",
      type: "line",
      data: band,
      stack: "confidence-band",
      symbol: "none",
      lineStyle: { opacity: 0 },
      itemStyle: { color: t.palette[0], opacity: 0.25 },
      areaStyle: { color: t.palette[0], opacity: 0.25 },
    },
    {
      name: "Predicted Active Users",
      type: "line",
      data: predicted,
      symbol: "none",
      lineStyle: { width: 3.5, color: t.palette[0] },
      itemStyle: { color: t.palette[0] },
      z: 3,
      markLine: {
        silent: true,
        symbol: "none",
        lineStyle: { type: "dashed", color: t.inkSoft, width: 1.5 },
        label: { formatter: "Forecast begins", color: t.inkSoft, fontSize: 13, position: "insideEndTop" },
        data: [{ xAxis: forecastStart }],
      },
    },
  ],
});
Runnable source as JSON, for any HTTP client: https://api.anyplot.ai/specs/line-confidence/echarts/code. Any spec id and library id listed in llms-full.txt fit the same URL shape; every URL below is complete and callable.
{
  "spec_id": "line-confidence",
  "language": "javascript",
  "library": "echarts",
  "page": "https://anyplot.ai/line-confidence/javascript/echarts",
  "hub": "https://anyplot.ai/line-confidence",
  "code_json": "https://api.anyplot.ai/specs/line-confidence/echarts/code",
  "spec_json": "https://api.anyplot.ai/specs/line-confidence",
  "render_light_png": "https://storage.googleapis.com/anyplot-images/plots/line-confidence/javascript/echarts/plot-light.png",
  "render_dark_png": "https://storage.googleapis.com/anyplot-images/plots/line-confidence/javascript/echarts/plot-dark.png",
  "interactive_light_html": "https://storage.googleapis.com/anyplot-images/plots/line-confidence/javascript/echarts/plot-light.html",
  "interactive_dark_html": "https://storage.googleapis.com/anyplot-images/plots/line-confidence/javascript/echarts/plot-dark.html",
  "quality_score": 92.0,
  "license": "MIT",
  "guide": "https://anyplot.ai/llms.txt"
}
Part of Line Plot with Confidence Interval on anyplot.ai.