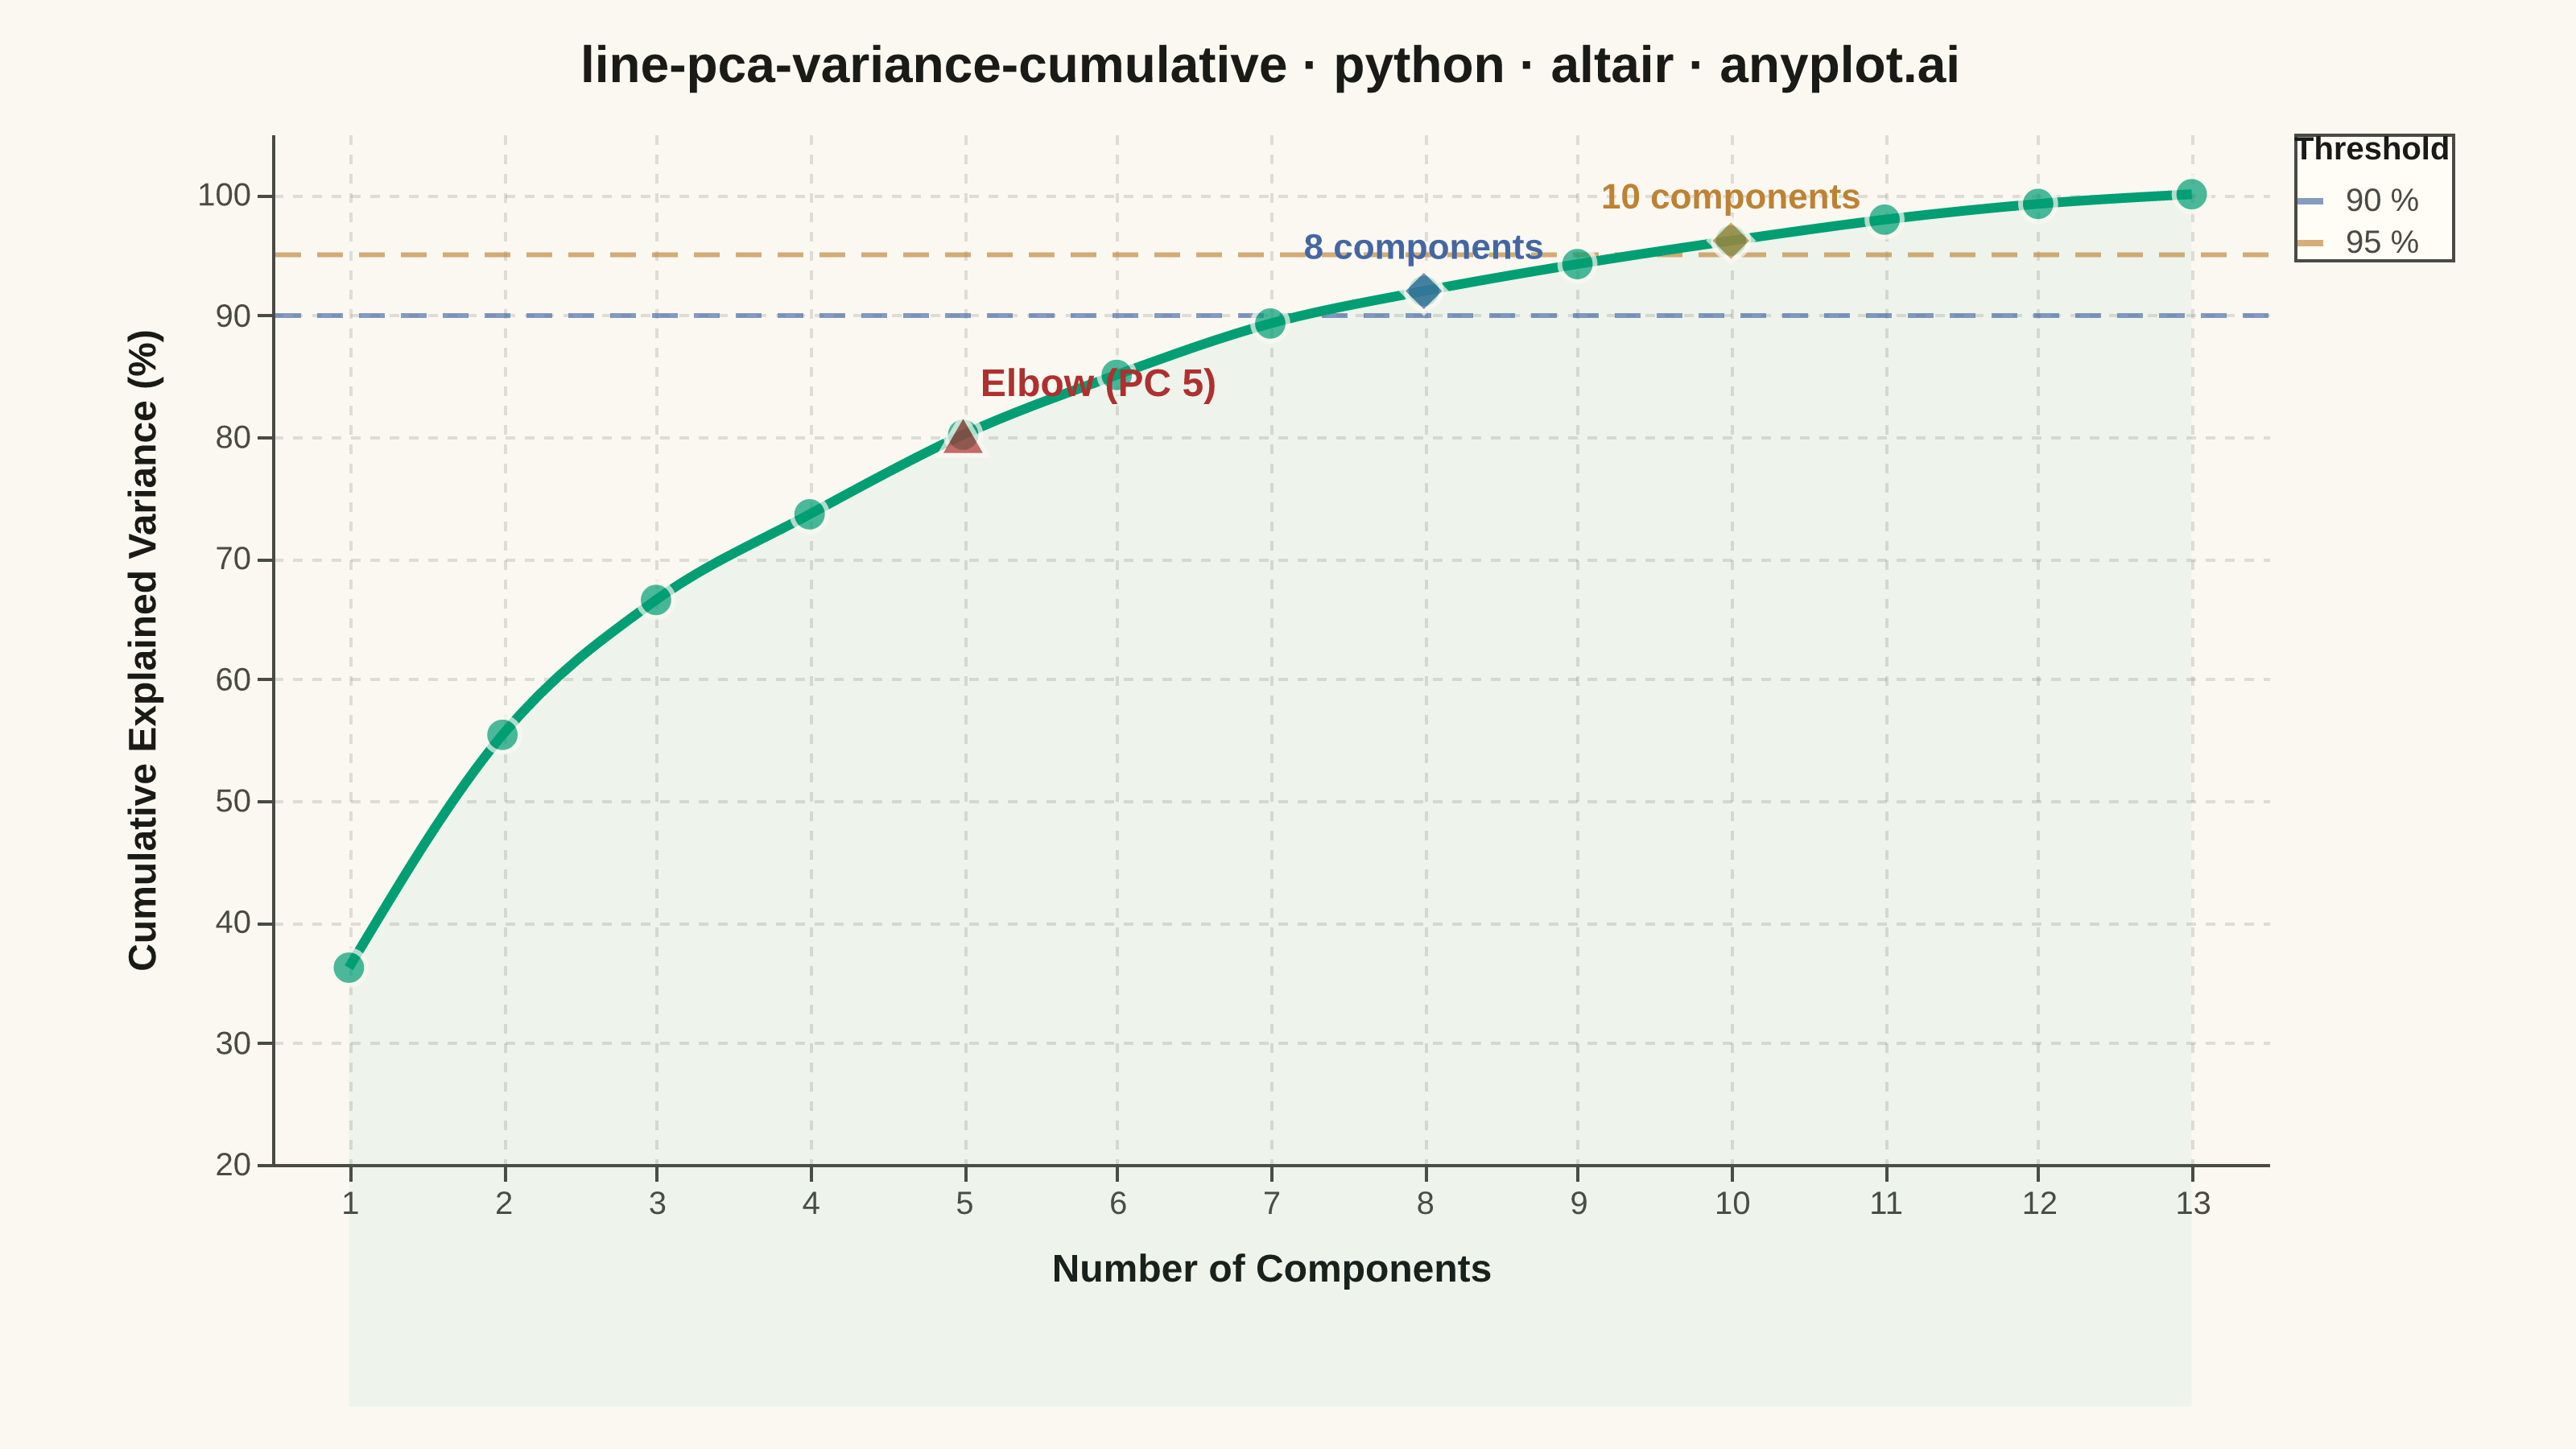
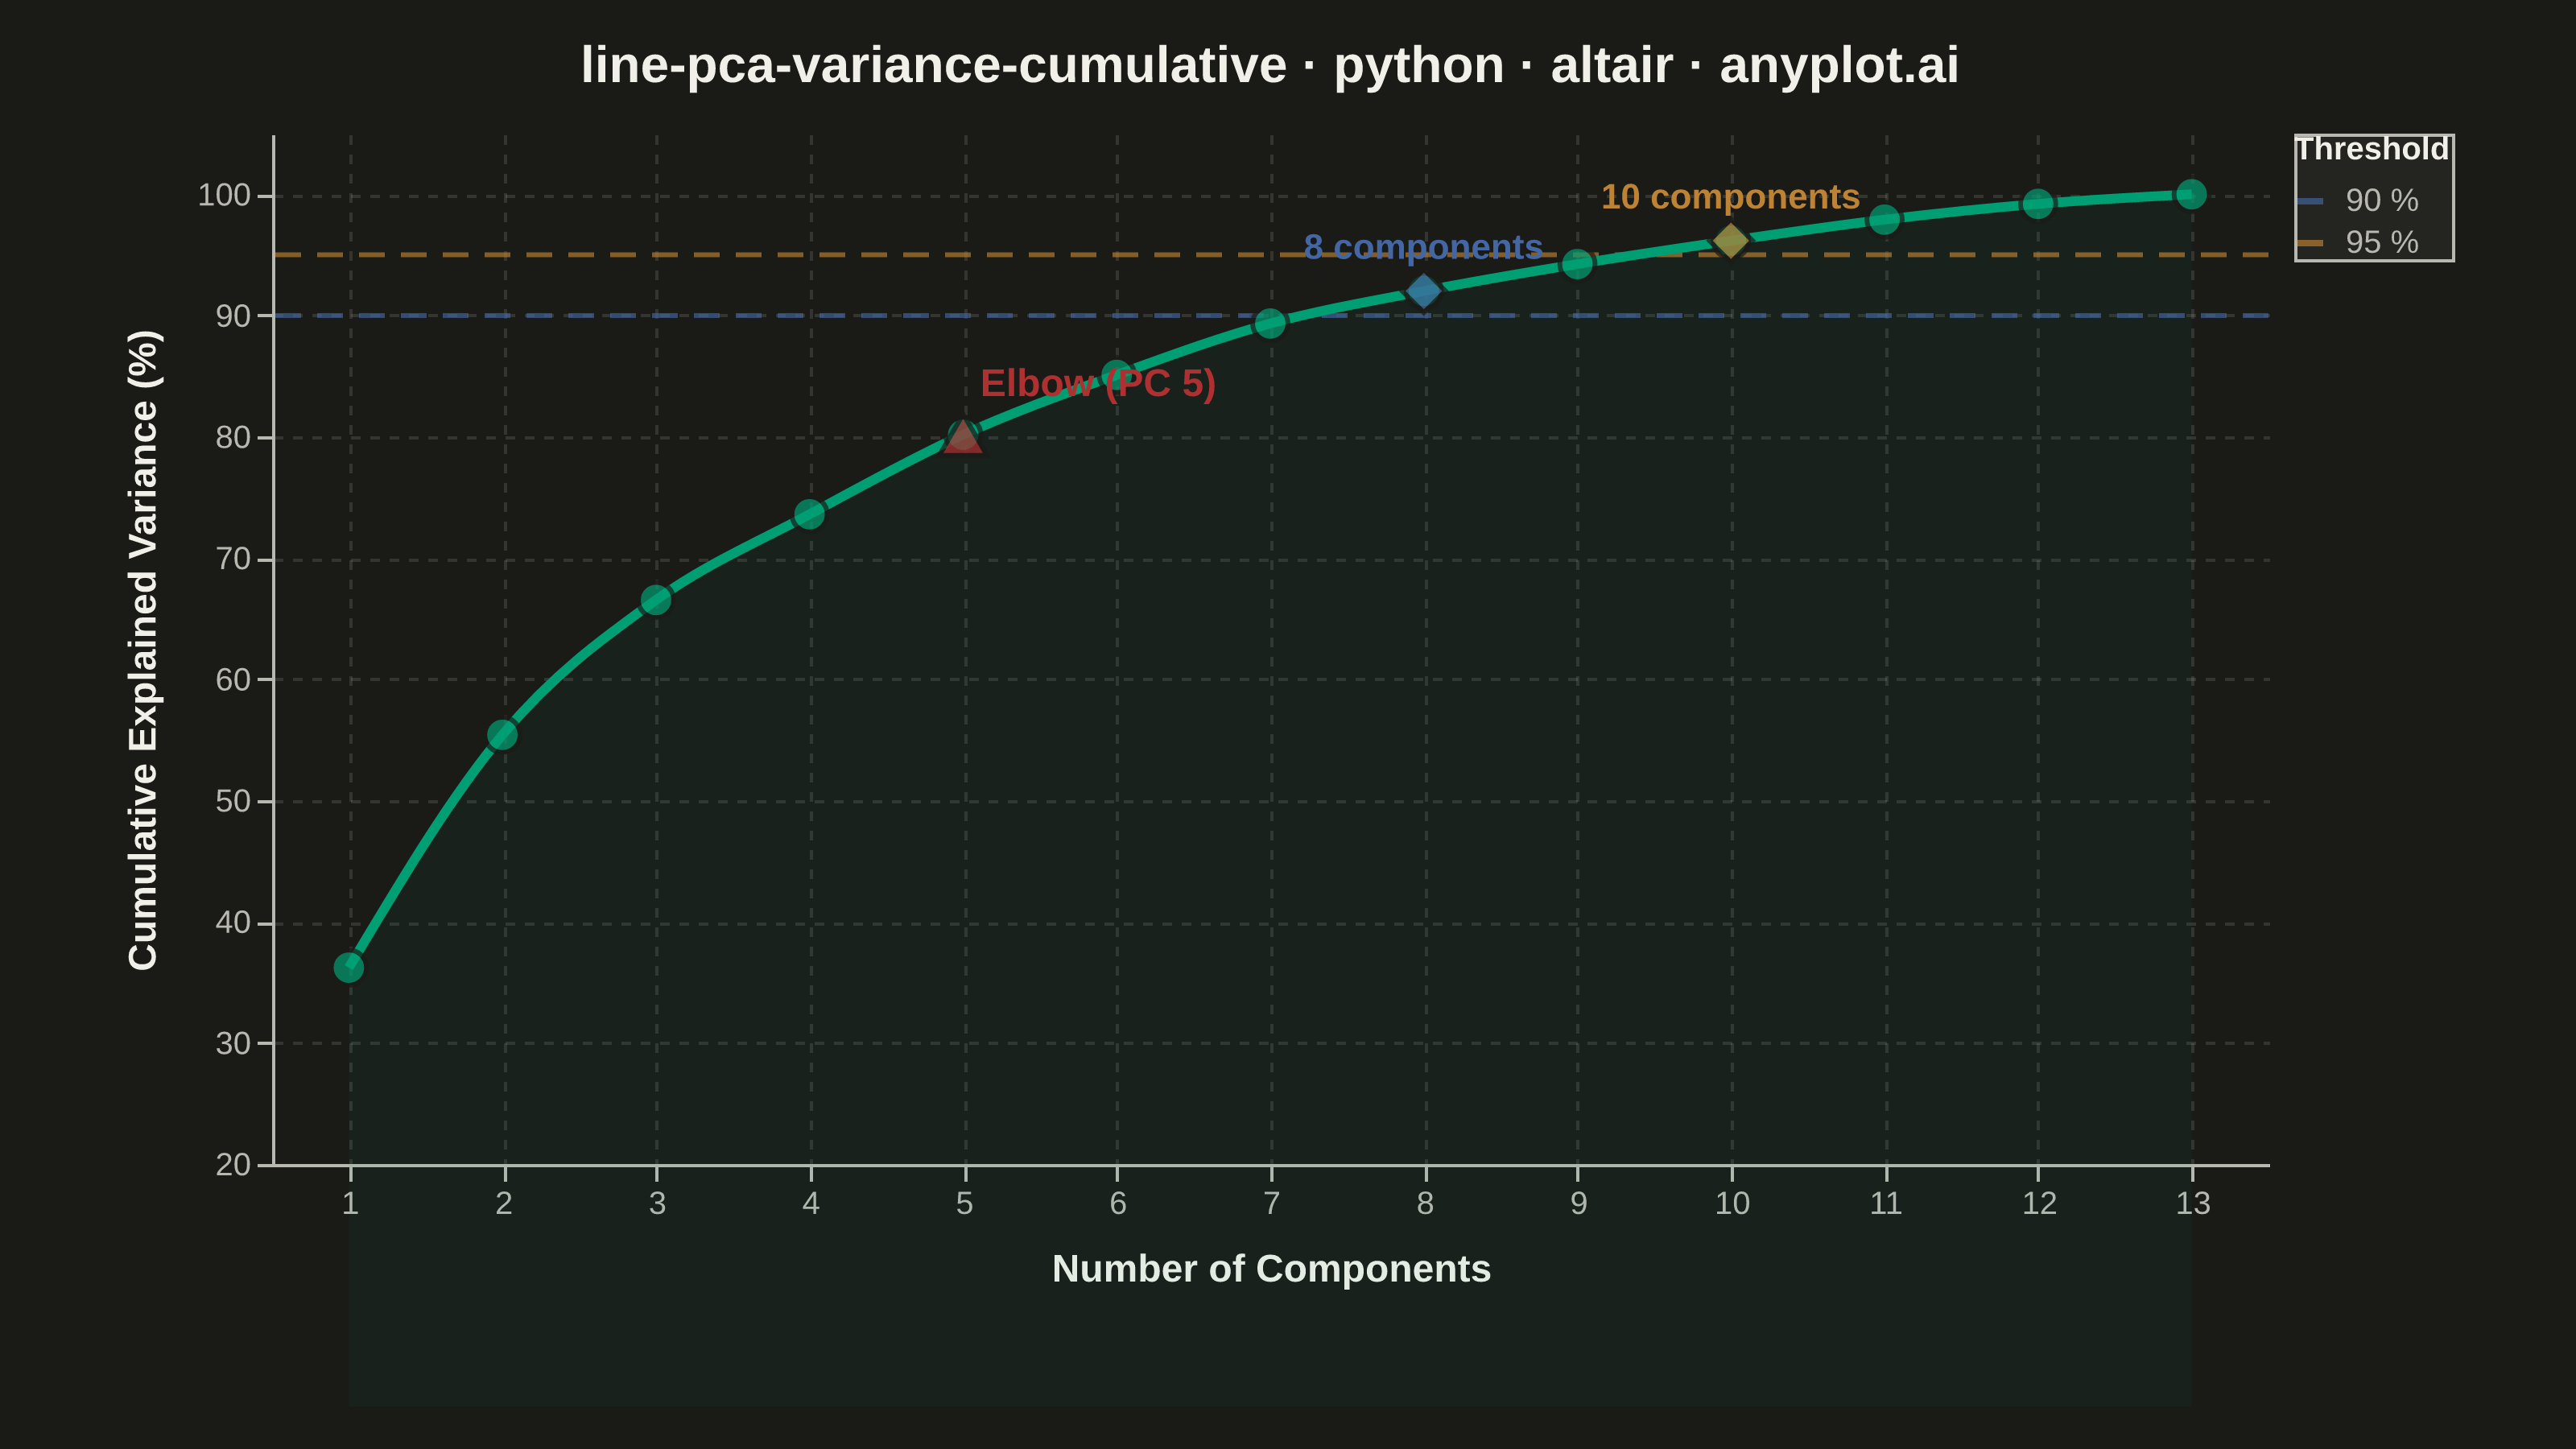
A line plot showing the cumulative proportion of explained variance as a function of the number of Principal Component Analysis (PCA) components. This visualization helps determine the optimal number of components to retain by displaying the trade-off between dimensionality reduction and information preservation. The cumulative curve typically exhibits an elbow pattern where additional components yield diminishing returns, and horizontal threshold lines (e.g., 90%, 95%) guide component selection decisions.
Preview render from the Altair implementation.