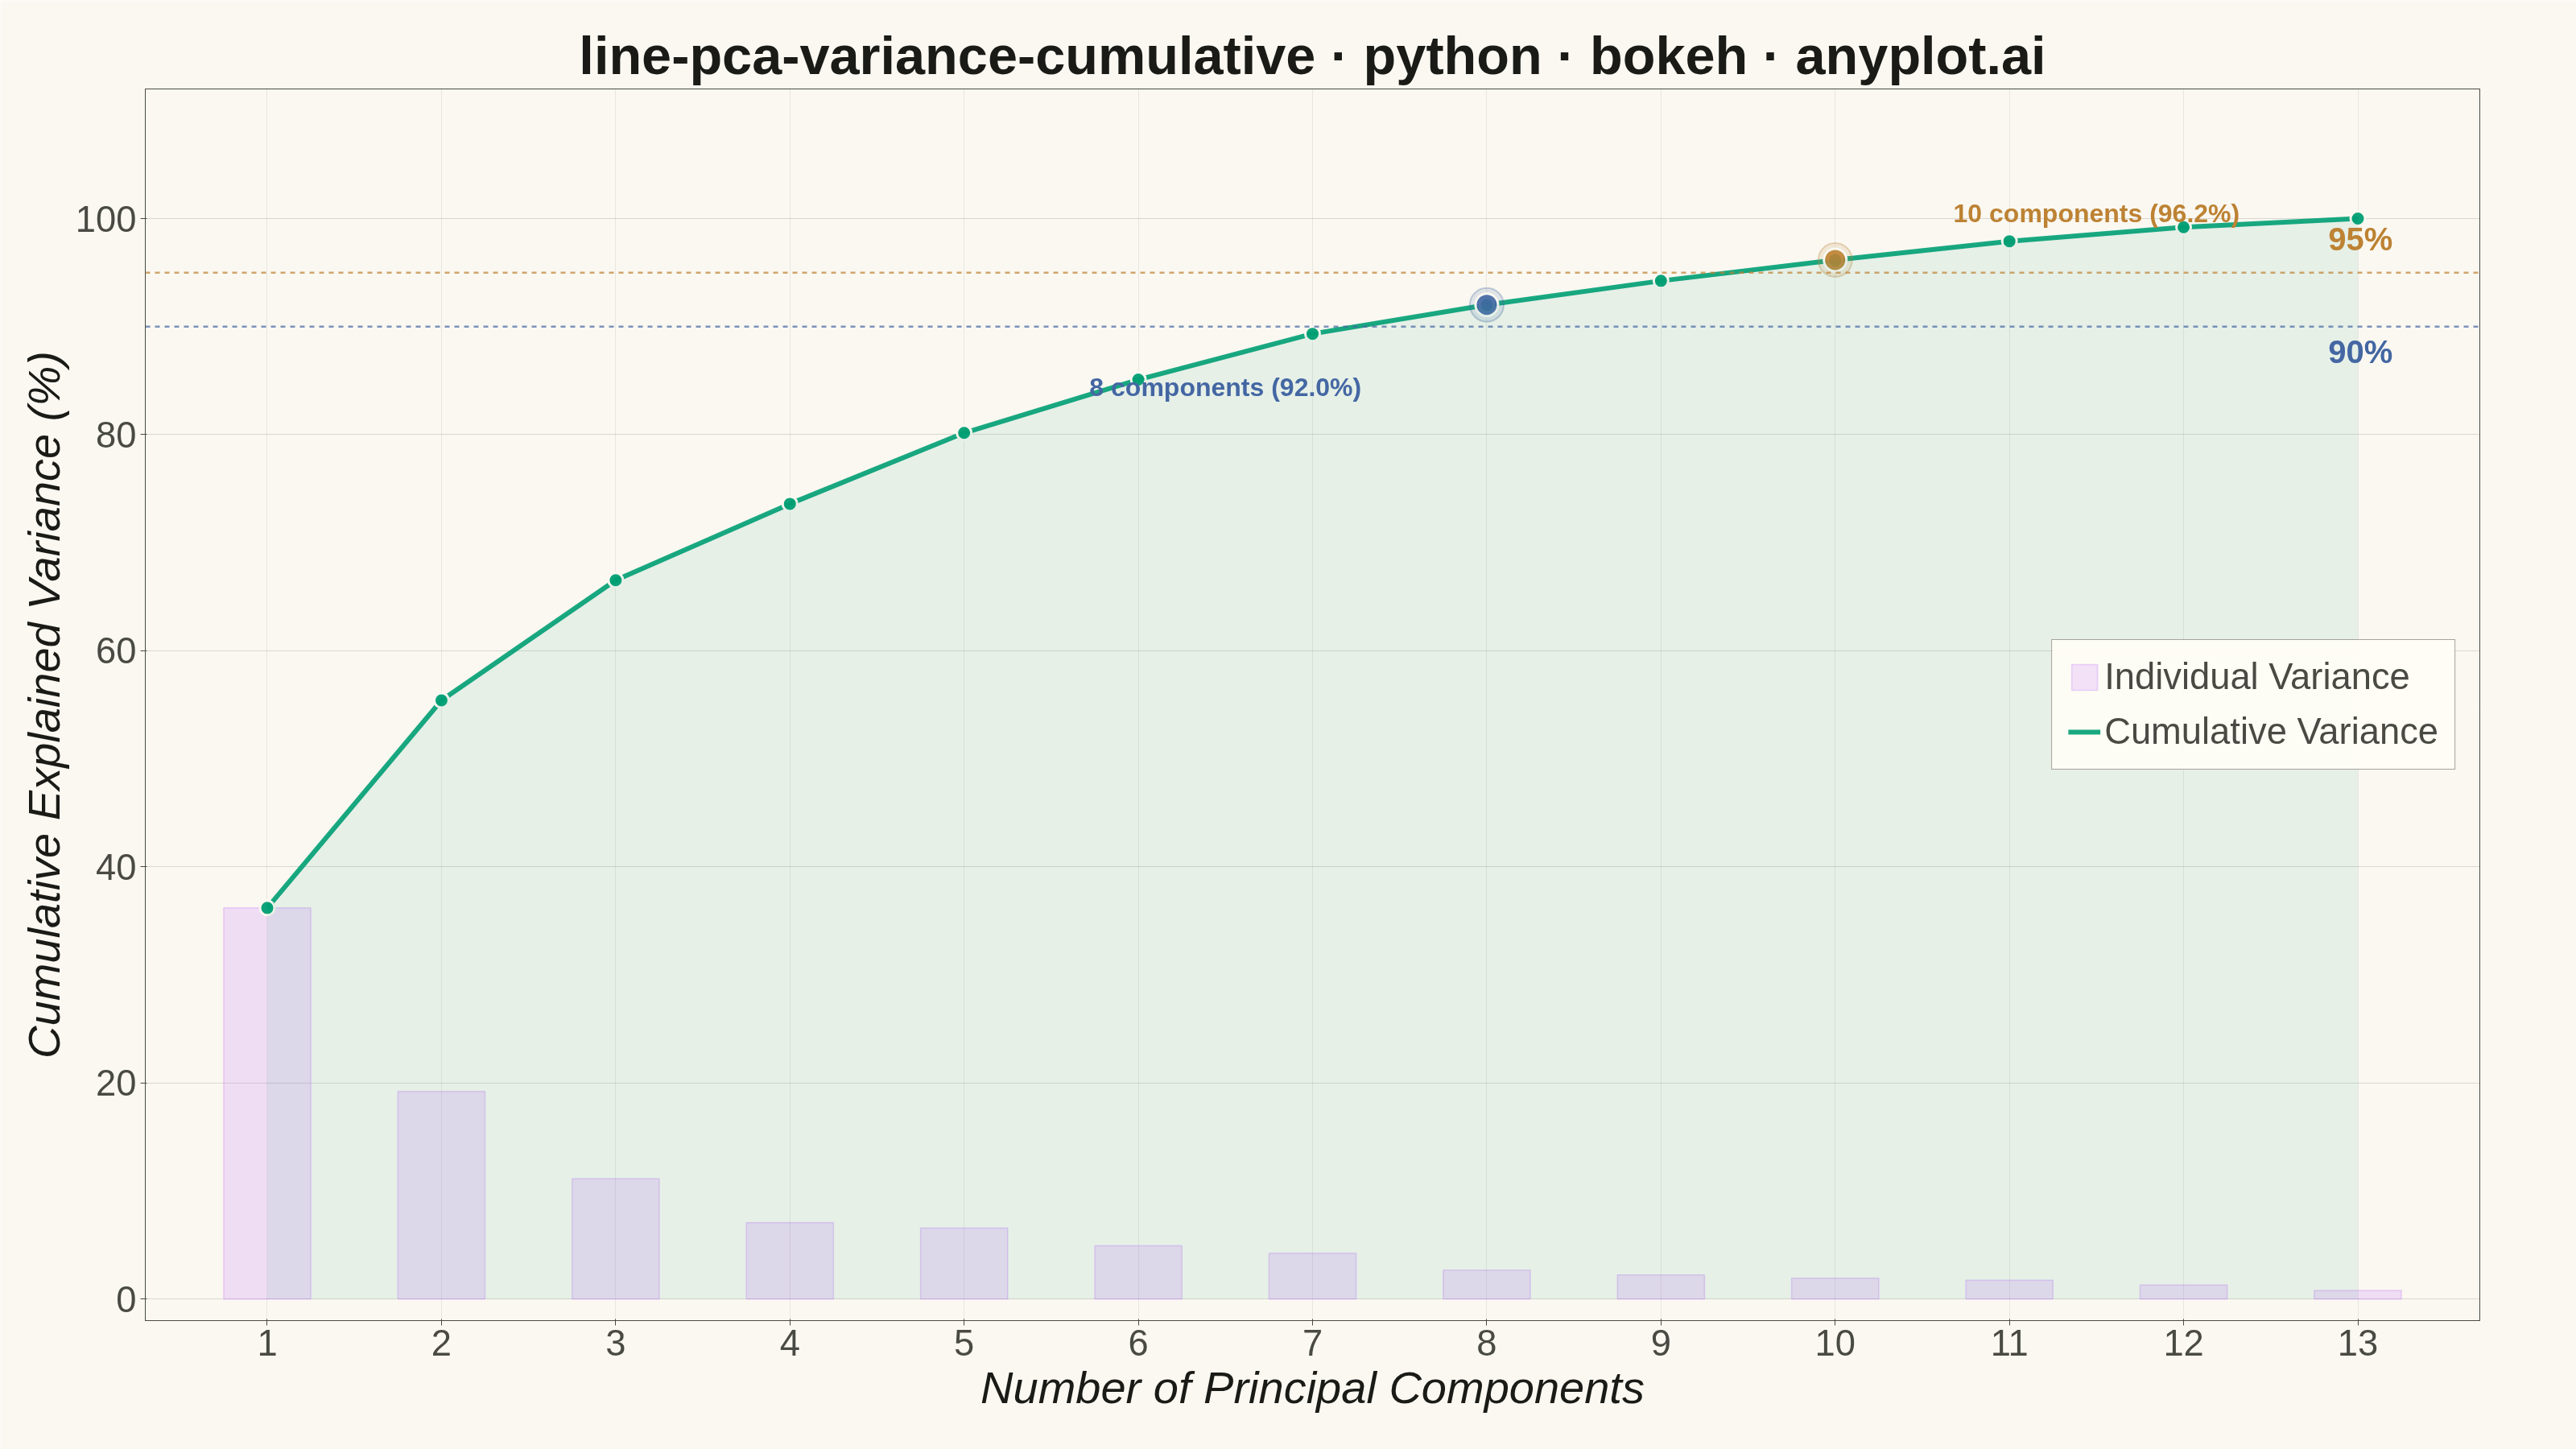
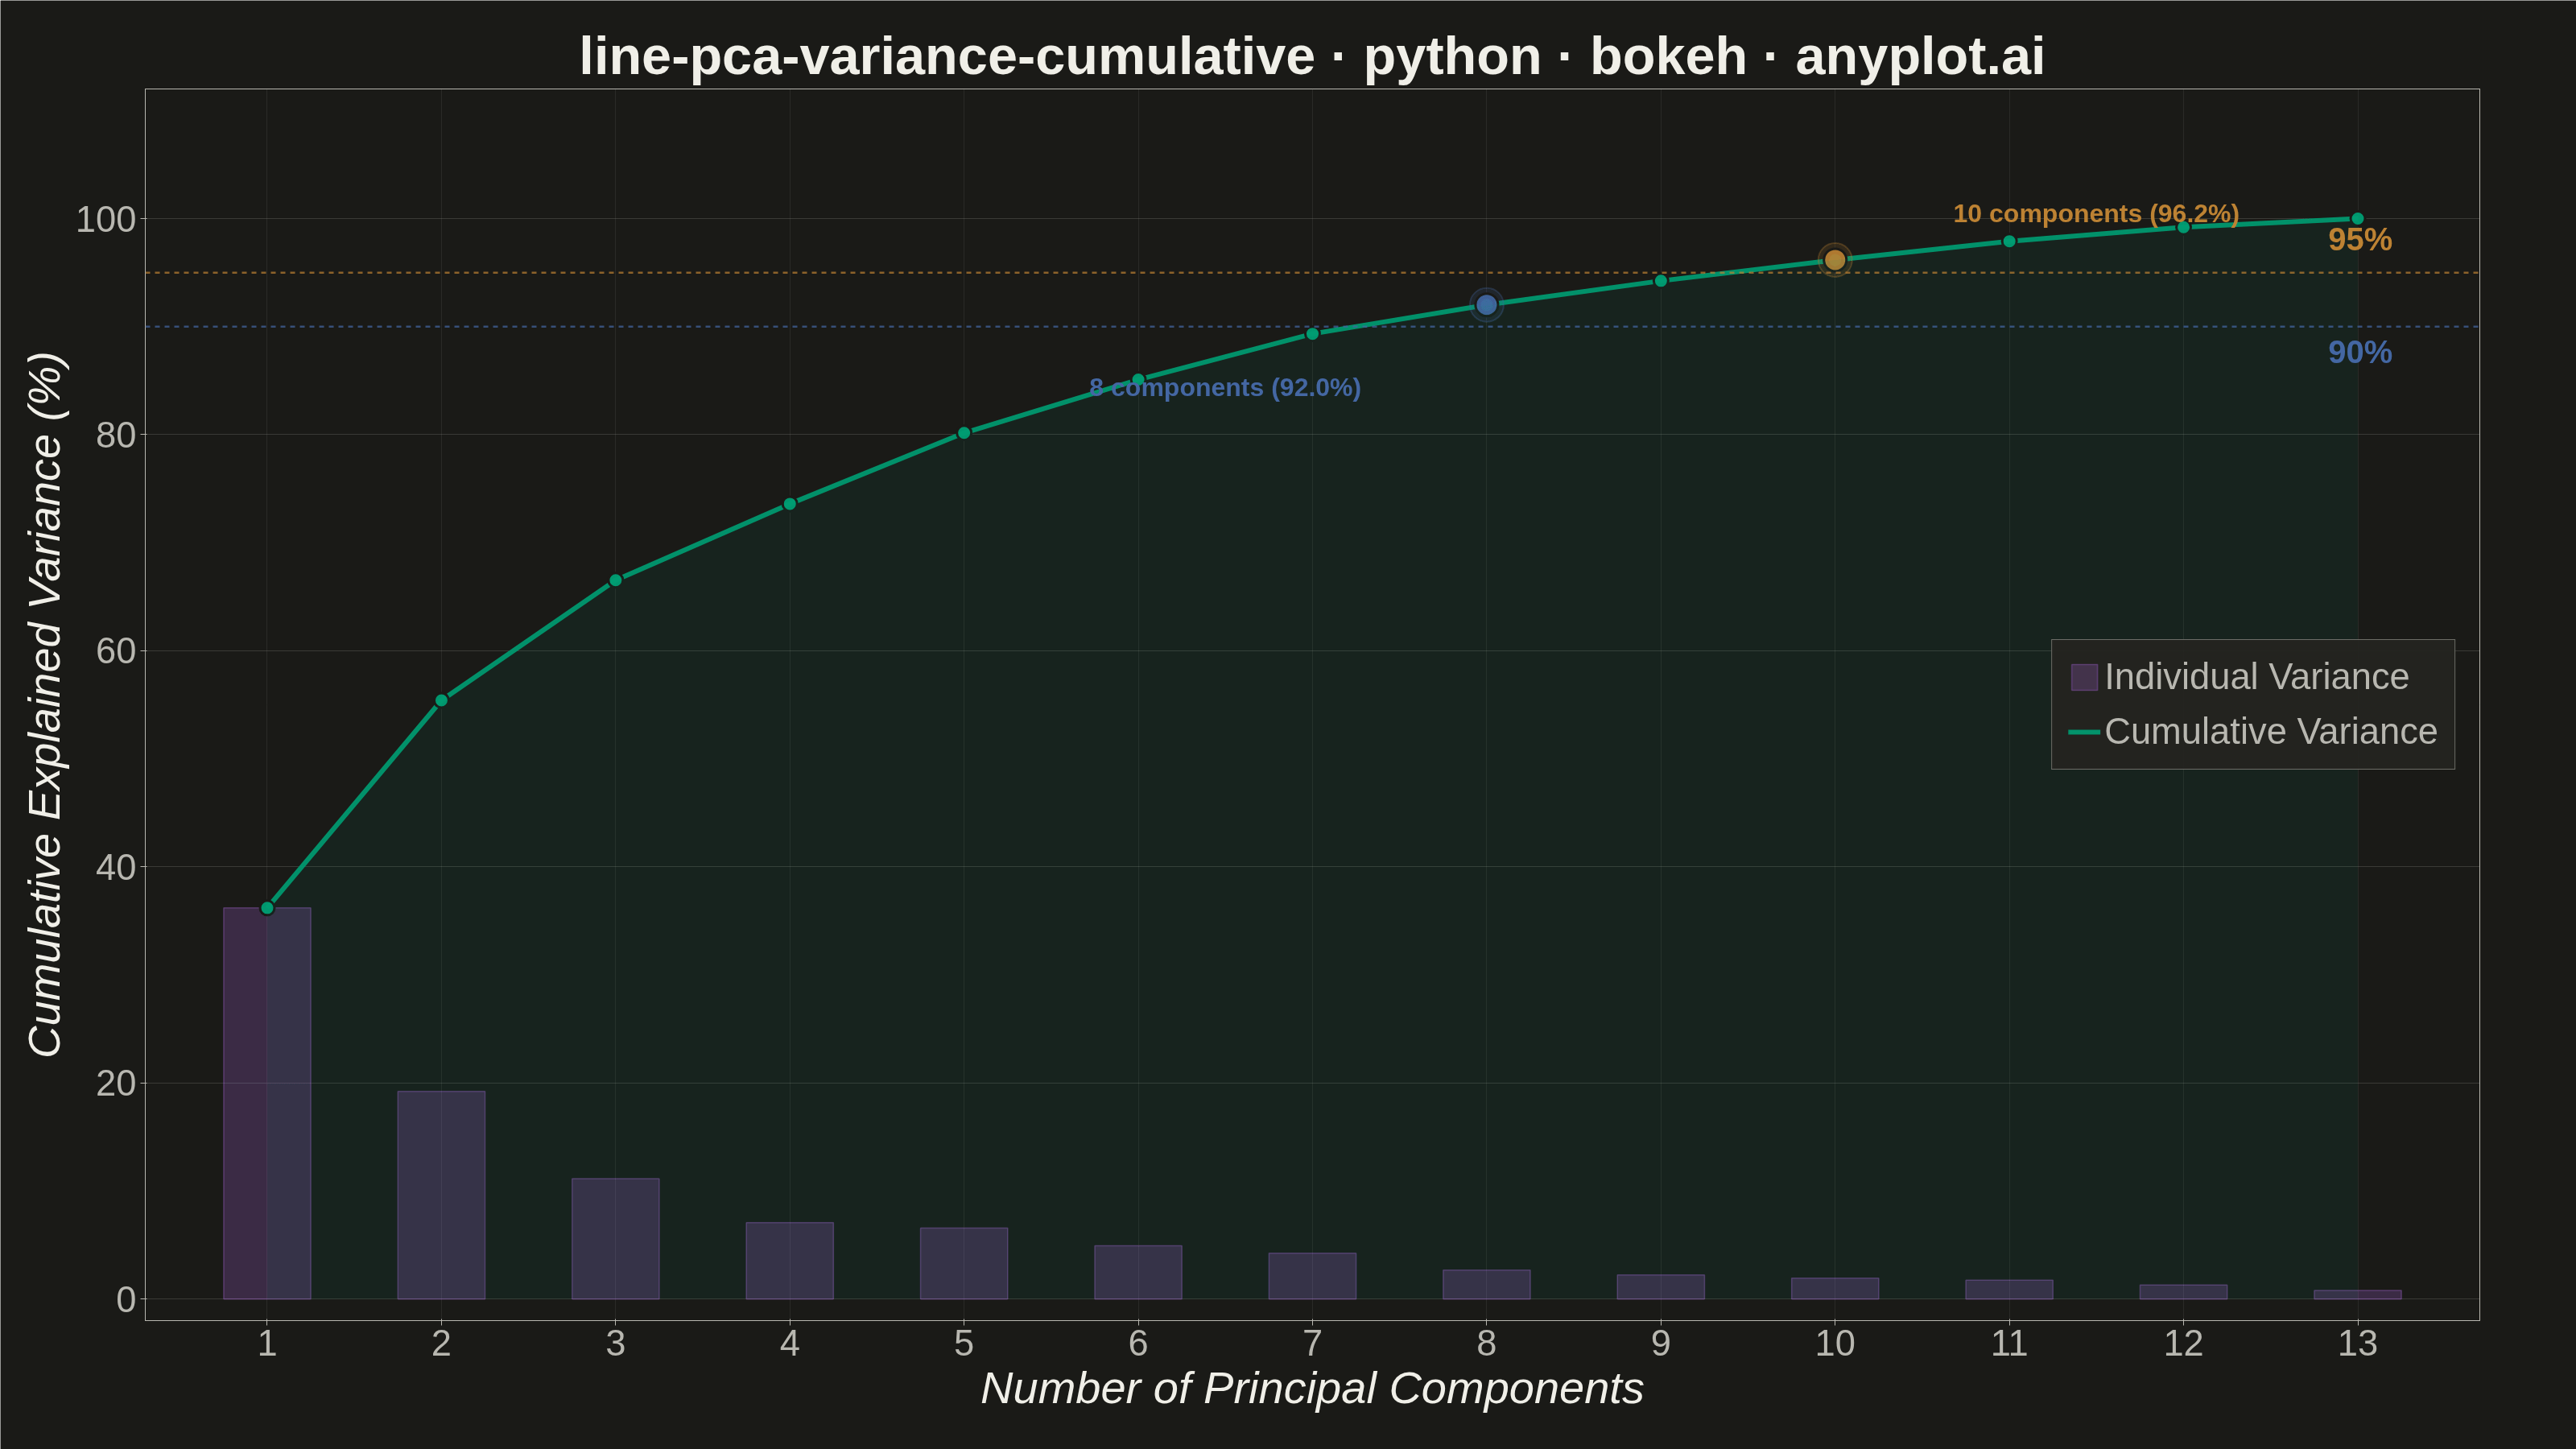
A line plot showing the cumulative proportion of explained variance as a function of the number of Principal Component Analysis (PCA) components. This visualization helps determine the optimal number of components to retain by displaying the trade-off between dimensionality reduction and information preservation. The cumulative curve typically exhibits an elbow pattern where additional components yield diminishing returns, and horizontal threshold lines (e.g., 90%, 95%) guide component selection decisions.
""" anyplot.ai
line-pca-variance-cumulative: Cumulative Explained Variance for PCA Component Selection
Library: bokeh 3.9.0 | Python 3.13.13
Quality: 91/100 | Updated: 2026-05-29
"""

import os
import time
from pathlib import Path

import numpy as np
from bokeh.io import output_file, save
from bokeh.models import Band, ColumnDataSource, HoverTool, Label, Span
from bokeh.plotting import figure
from selenium import webdriver
from selenium.webdriver.chrome.options import Options
from sklearn.datasets import load_wine
from sklearn.decomposition import PCA
from sklearn.preprocessing import StandardScaler


# Theme tokens (Imprint palette — theme-adaptive chrome)
THEME = os.getenv("ANYPLOT_THEME", "light")
PAGE_BG = "#FAF8F1" if THEME == "light" else "#1A1A17"
ELEVATED_BG = "#FFFDF6" if THEME == "light" else "#242420"
INK = "#1A1A17" if THEME == "light" else "#F0EFE8"
INK_SOFT = "#4A4A44" if THEME == "light" else "#B8B7B0"

# Imprint categorical palette — canonical order, positions 1–4
BRAND = "#009E73"  # pos 1: cumulative variance line (always first series)
LAVENDER = "#C475FD"  # pos 2: individual variance bars
BLUE = "#4467A3"  # pos 3: 90% threshold reference line
OCHRE = "#BD8233"  # pos 4: 95% threshold reference line

# Data — Wine dataset (13 chemical features, authentic PCA distribution)
wine = load_wine()
X_scaled = StandardScaler().fit_transform(wine.data)
pca = PCA()
pca.fit(X_scaled)

n_components = np.arange(1, len(pca.explained_variance_ratio_) + 1)
cumulative_variance = np.cumsum(pca.explained_variance_ratio_) * 100
individual_variance = pca.explained_variance_ratio_ * 100

threshold_90 = int(np.argmax(cumulative_variance >= 90) + 1)
threshold_95 = int(np.argmax(cumulative_variance >= 95) + 1)

# ColumnDataSources
source_main = ColumnDataSource(
    data={
        "component": n_components,
        "cumulative": cumulative_variance,
        "individual": individual_variance,
        "base": np.zeros_like(cumulative_variance),
    }
)
source_bars = ColumnDataSource(data={"component": n_components, "individual": individual_variance})

# Title — scale fontsize if > 67 chars
title_str = "line-pca-variance-cumulative · python · bokeh · anyplot.ai"
n_chars = len(title_str)
ratio = 67 / n_chars if n_chars > 67 else 1.0
title_fontsize = f"{max(34, round(50 * ratio))}pt"

# Plot — canonical 3200×1800 bokeh canvas with toolbar disabled for PNG
p = figure(
    width=3200,
    height=1800,
    title=title_str,
    x_axis_label="Number of Principal Components",
    y_axis_label="Cumulative Explained Variance (%)",
    toolbar_location=None,
    y_range=(-2, 112),
    x_range=(0.3, 13.7),
    min_border_bottom=160,
    min_border_left=180,
    min_border_top=110,
    min_border_right=120,
)

# Area fill under cumulative curve (Bokeh Band — library-distinctive)
band = Band(
    base="component",
    upper="cumulative",
    lower="base",
    source=source_main,
    fill_color=BRAND,
    fill_alpha=0.08,
    line_color=None,
)
p.add_layout(band)

# Individual variance bars (subtle background, secondary series)
p.vbar(
    x="component",
    top="individual",
    source=source_bars,
    width=0.5,
    fill_color=LAVENDER,
    fill_alpha=0.20,
    line_color=LAVENDER,
    line_alpha=0.30,
    line_width=1.5,
    legend_label="Individual Variance",
)

# Cumulative variance line — capture renderer for HoverTool attachment
cumulative_renderer = p.line(
    x="component",
    y="cumulative",
    source=source_main,
    line_width=6,
    line_color=BRAND,
    line_alpha=0.9,
    legend_label="Cumulative Variance",
)

# Markers at each component count
p.scatter(
    x="component",
    y="cumulative",
    source=source_main,
    size=18,
    fill_color=BRAND,
    line_color=PAGE_BG,
    line_width=3,
    fill_alpha=0.95,
)

# Horizontal threshold reference lines
p.add_layout(Span(location=90, dimension="width", line_color=BLUE, line_width=2.5, line_dash="dashed", line_alpha=0.7))
p.add_layout(Span(location=95, dimension="width", line_color=OCHRE, line_width=2.5, line_dash="dashed", line_alpha=0.7))

# Right-edge threshold labels (kept inside canvas boundary)
p.add_layout(
    Label(
        x=13.2, y=86.0, text="90%", text_font_size="30pt", text_color=BLUE, text_align="right", text_font_style="bold"
    )
)
p.add_layout(
    Label(
        x=13.2, y=96.5, text="95%", text_font_size="30pt", text_color=OCHRE, text_align="right", text_font_style="bold"
    )
)

# Glow-ring highlights at threshold crossings
for th, color in [(threshold_90, BLUE), (threshold_95, OCHRE)]:
    p.scatter(
        x=[th],
        y=[cumulative_variance[th - 1]],
        size=42,
        fill_color=color,
        fill_alpha=0.15,
        line_color=color,
        line_alpha=0.3,
        line_width=2,
    )
    p.scatter(
        x=[th],
        y=[cumulative_variance[th - 1]],
        size=28,
        fill_color=color,
        line_color=PAGE_BG,
        line_width=3,
        fill_alpha=0.9,
    )

# Crossing annotations — offset to avoid crowding
p.add_layout(
    Label(
        x=threshold_90 - 1.5,
        y=cumulative_variance[threshold_90 - 1] - 9,
        text=f"{threshold_90} components ({cumulative_variance[threshold_90 - 1]:.1f}%)",
        text_font_size="24pt",
        text_color=BLUE,
        text_font_style="bold",
        text_align="center",
    )
)
p.add_layout(
    Label(
        x=threshold_95 + 1.5,
        y=cumulative_variance[threshold_95 - 1] + 3,
        text=f"{threshold_95} components ({cumulative_variance[threshold_95 - 1]:.1f}%)",
        text_font_size="24pt",
        text_color=OCHRE,
        text_font_style="bold",
        text_align="center",
    )
)

# HoverTool attached to named renderer (avoids fragile magic index)
p.add_tools(
    HoverTool(
        tooltips=[
            ("Component", "@component"),
            ("Cumulative Variance", "@cumulative{0.1}%"),
            ("Individual Variance", "@individual{0.1}%"),
        ],
        mode="vline",
        renderers=[cumulative_renderer],
    )
)

# Theme-adaptive chrome
p.background_fill_color = PAGE_BG
p.border_fill_color = PAGE_BG
p.outline_line_color = INK_SOFT

p.title.text_font_size = title_fontsize
p.title.text_color = INK
p.title.align = "center"
p.title.text_font_style = "bold"

p.xaxis.axis_label_text_font_size = "42pt"
p.yaxis.axis_label_text_font_size = "42pt"
p.xaxis.axis_label_text_color = INK
p.yaxis.axis_label_text_color = INK
p.xaxis.major_label_text_font_size = "34pt"
p.yaxis.major_label_text_font_size = "34pt"
p.xaxis.major_label_text_color = INK_SOFT
p.yaxis.major_label_text_color = INK_SOFT
p.xaxis.axis_line_color = INK_SOFT
p.yaxis.axis_line_color = INK_SOFT
p.xaxis.major_tick_line_color = INK_SOFT
p.yaxis.major_tick_line_color = INK_SOFT
p.xaxis.minor_tick_line_color = None
p.yaxis.minor_tick_line_color = None

p.xaxis.ticker = list(n_components)

p.ygrid.grid_line_color = INK
p.ygrid.grid_line_alpha = 0.15
p.xgrid.grid_line_color = INK
p.xgrid.grid_line_alpha = 0.08

p.legend.location = "center_right"
p.legend.label_text_font_size = "34pt"
p.legend.label_text_color = INK_SOFT
p.legend.background_fill_color = ELEVATED_BG
p.legend.border_line_color = INK_SOFT
p.legend.border_line_width = 1
p.legend.padding = 20
p.legend.margin = 30
p.legend.glyph_height = 40
p.legend.glyph_width = 40
p.legend.spacing = 16

# Save interactive HTML (required catalog artifact)
output_file(f"plot-{THEME}.html")
save(p)

# Screenshot with headless Chrome — CDP override pins inner viewport to exact dims
# (--window-size alone gives 1661 instead of 1800 due to browser chrome offset)
W, H = 3200, 1800
opts = Options()
for arg in (
    "--headless=new",
    "--no-sandbox",
    "--disable-dev-shm-usage",
    "--disable-gpu",
    f"--window-size={W},{H}",
    "--hide-scrollbars",
):
    opts.add_argument(arg)
driver = webdriver.Chrome(options=opts)
driver.execute_cdp_cmd(
    "Emulation.setDeviceMetricsOverride", {"width": W, "height": H, "deviceScaleFactor": 1, "mobile": False}
)
driver.get(f"file://{Path(f'plot-{THEME}.html').resolve()}")
time.sleep(3)
driver.save_screenshot(f"plot-{THEME}.png")
driver.quit()

# Belt-and-braces: ensure saved PNG is exactly W×H so the post-render gate passes
from PIL import Image as _PILImage


_img = _PILImage.open(f"plot-{THEME}.png").convert("RGB")
if _img.size != (W, H):
    _norm = _PILImage.new("RGB", (W, H), PAGE_BG)
    _norm.paste(_img, ((W - _img.size[0]) // 2, (H - _img.size[1]) // 2))
    _norm.save(f"plot-{THEME}.png")
Runnable source as JSON, for any HTTP client: https://api.anyplot.ai/specs/line-pca-variance-cumulative/bokeh/code. Any spec id and library id listed in llms-full.txt fit the same URL shape; every URL below is complete and callable.
{
  "spec_id": "line-pca-variance-cumulative",
  "language": "python",
  "library": "bokeh",
  "page": "https://anyplot.ai/line-pca-variance-cumulative/python/bokeh",
  "hub": "https://anyplot.ai/line-pca-variance-cumulative",
  "code_json": "https://api.anyplot.ai/specs/line-pca-variance-cumulative/bokeh/code",
  "spec_json": "https://api.anyplot.ai/specs/line-pca-variance-cumulative",
  "render_light_png": "https://storage.googleapis.com/anyplot-images/plots/line-pca-variance-cumulative/python/bokeh/plot-light.png",
  "render_dark_png": "https://storage.googleapis.com/anyplot-images/plots/line-pca-variance-cumulative/python/bokeh/plot-dark.png",
  "interactive_light_html": "https://storage.googleapis.com/anyplot-images/plots/line-pca-variance-cumulative/python/bokeh/plot-light.html",
  "interactive_dark_html": "https://storage.googleapis.com/anyplot-images/plots/line-pca-variance-cumulative/python/bokeh/plot-dark.html",
  "quality_score": 91.0,
  "license": "MIT",
  "guide": "https://anyplot.ai/llms.txt"
}
Part of Cumulative Explained Variance for PCA Component Selection on anyplot.ai.