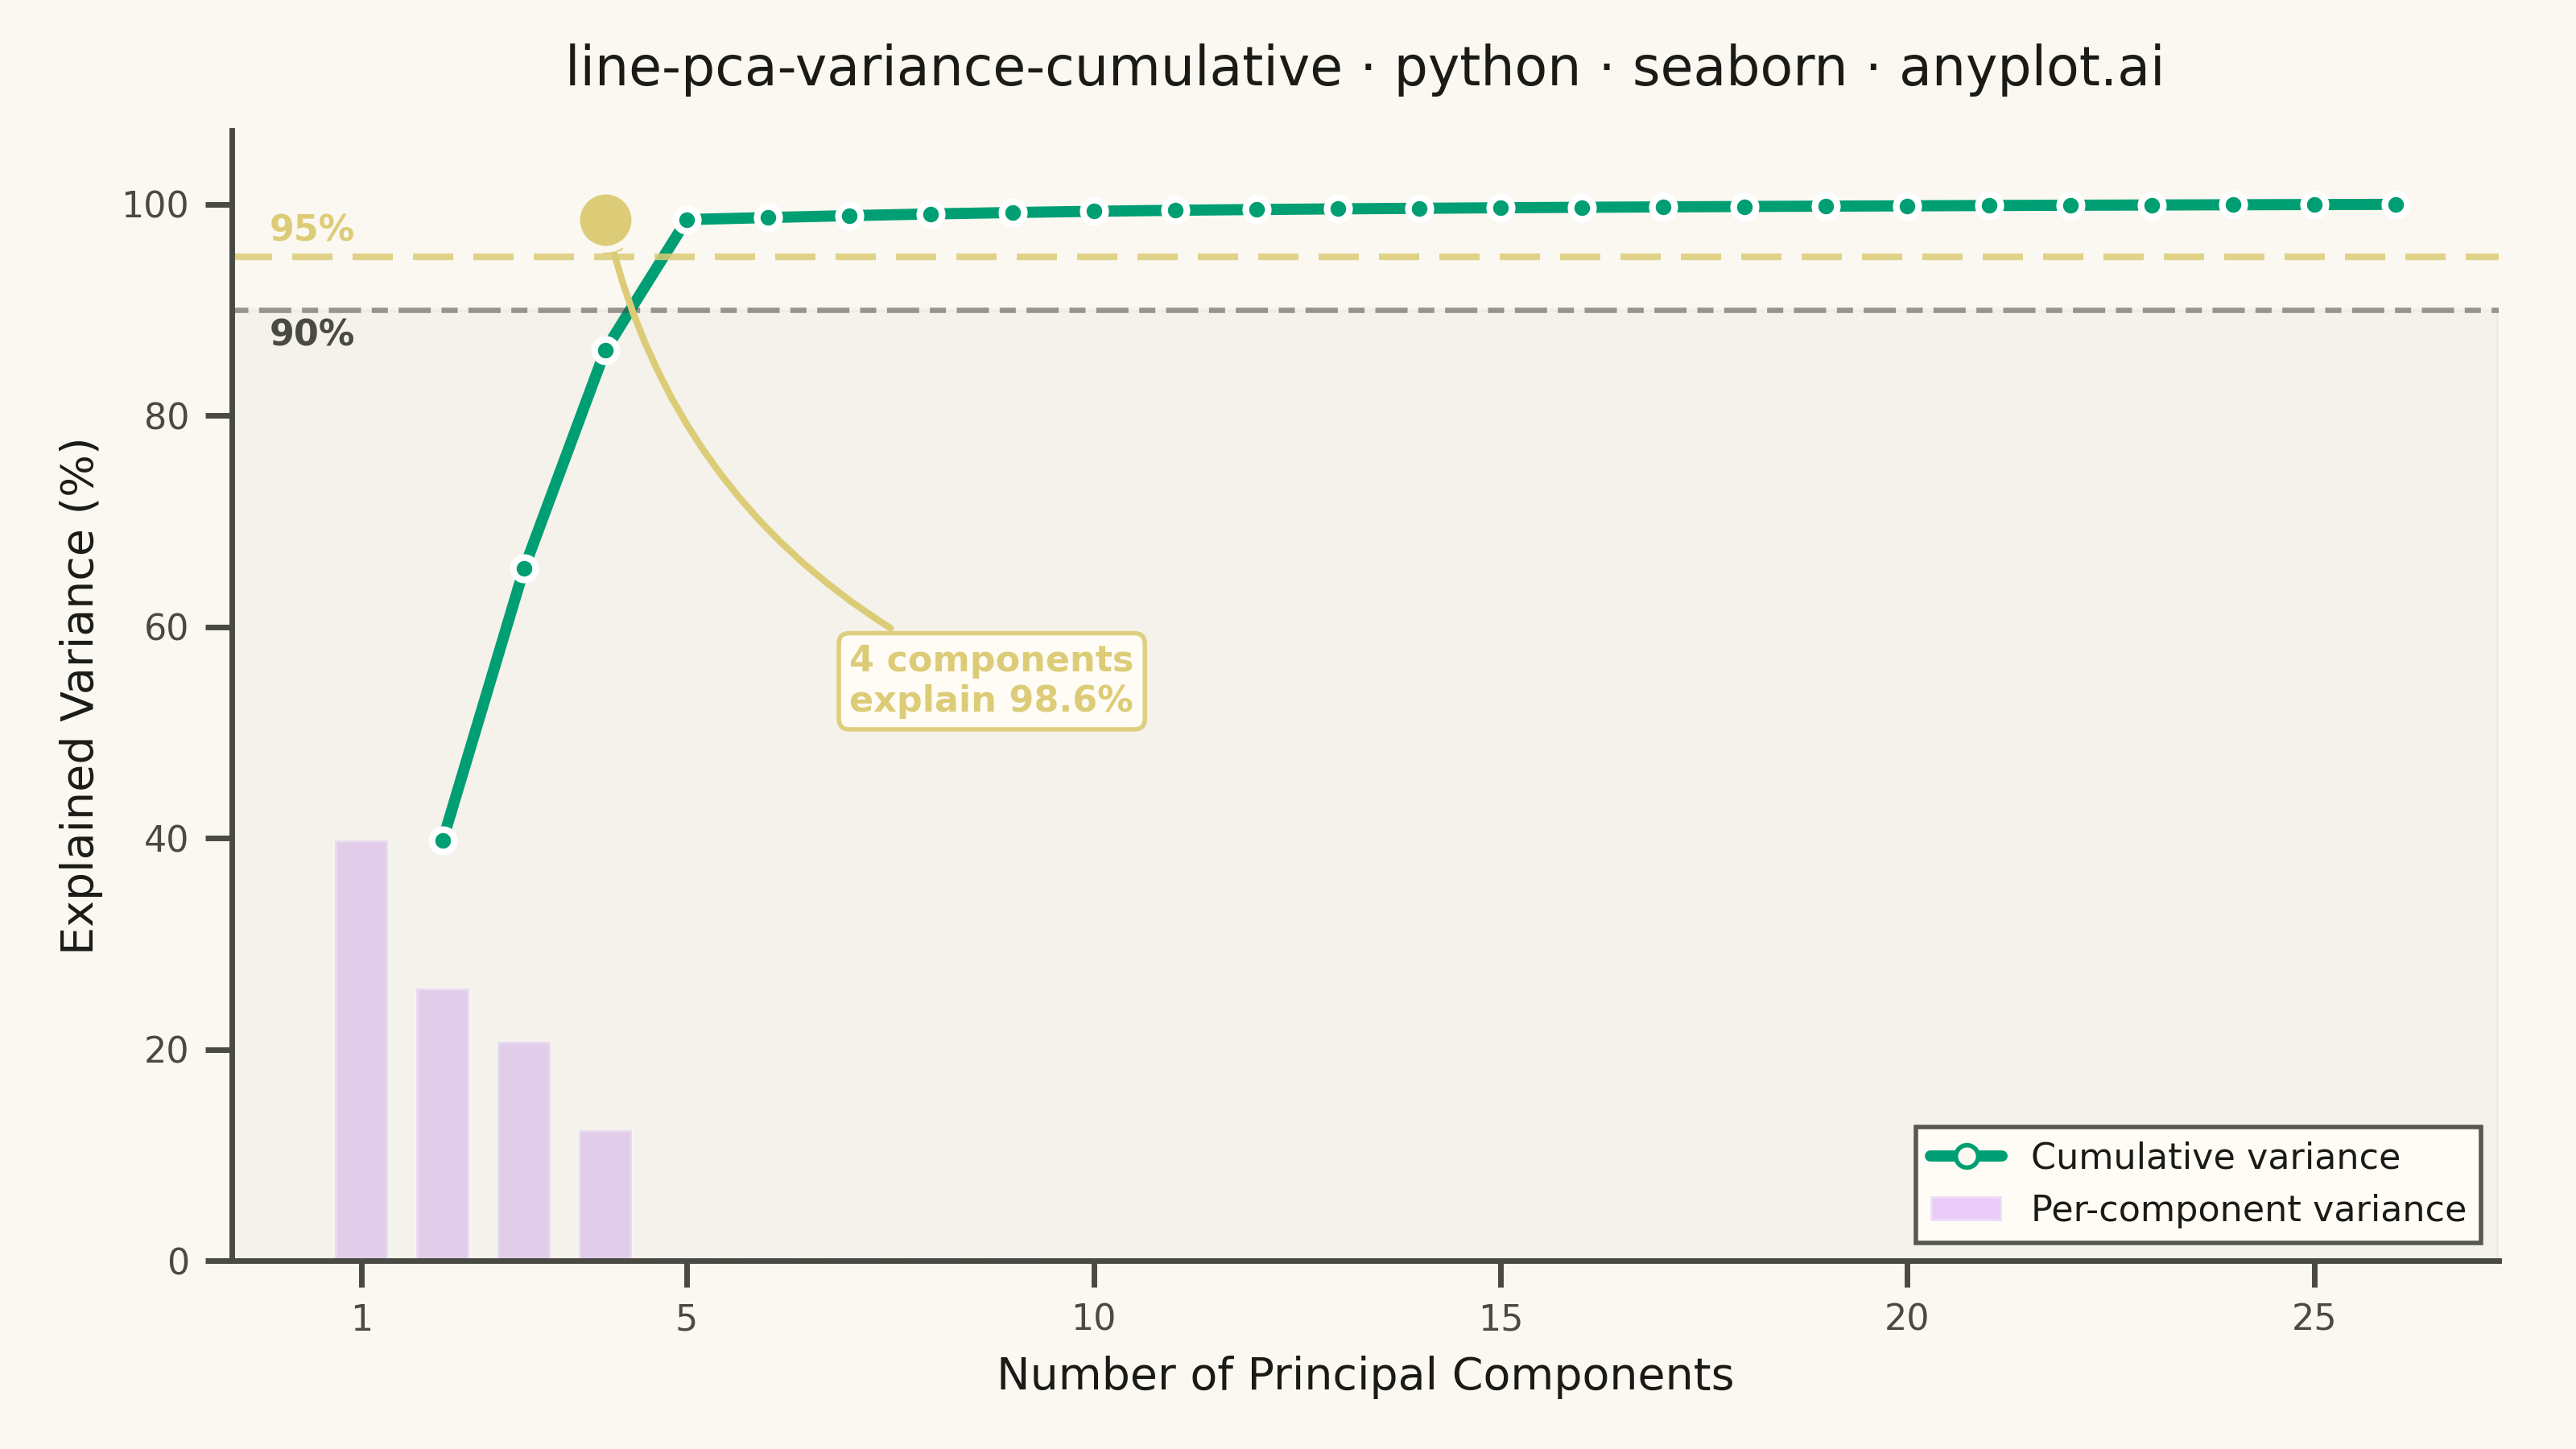
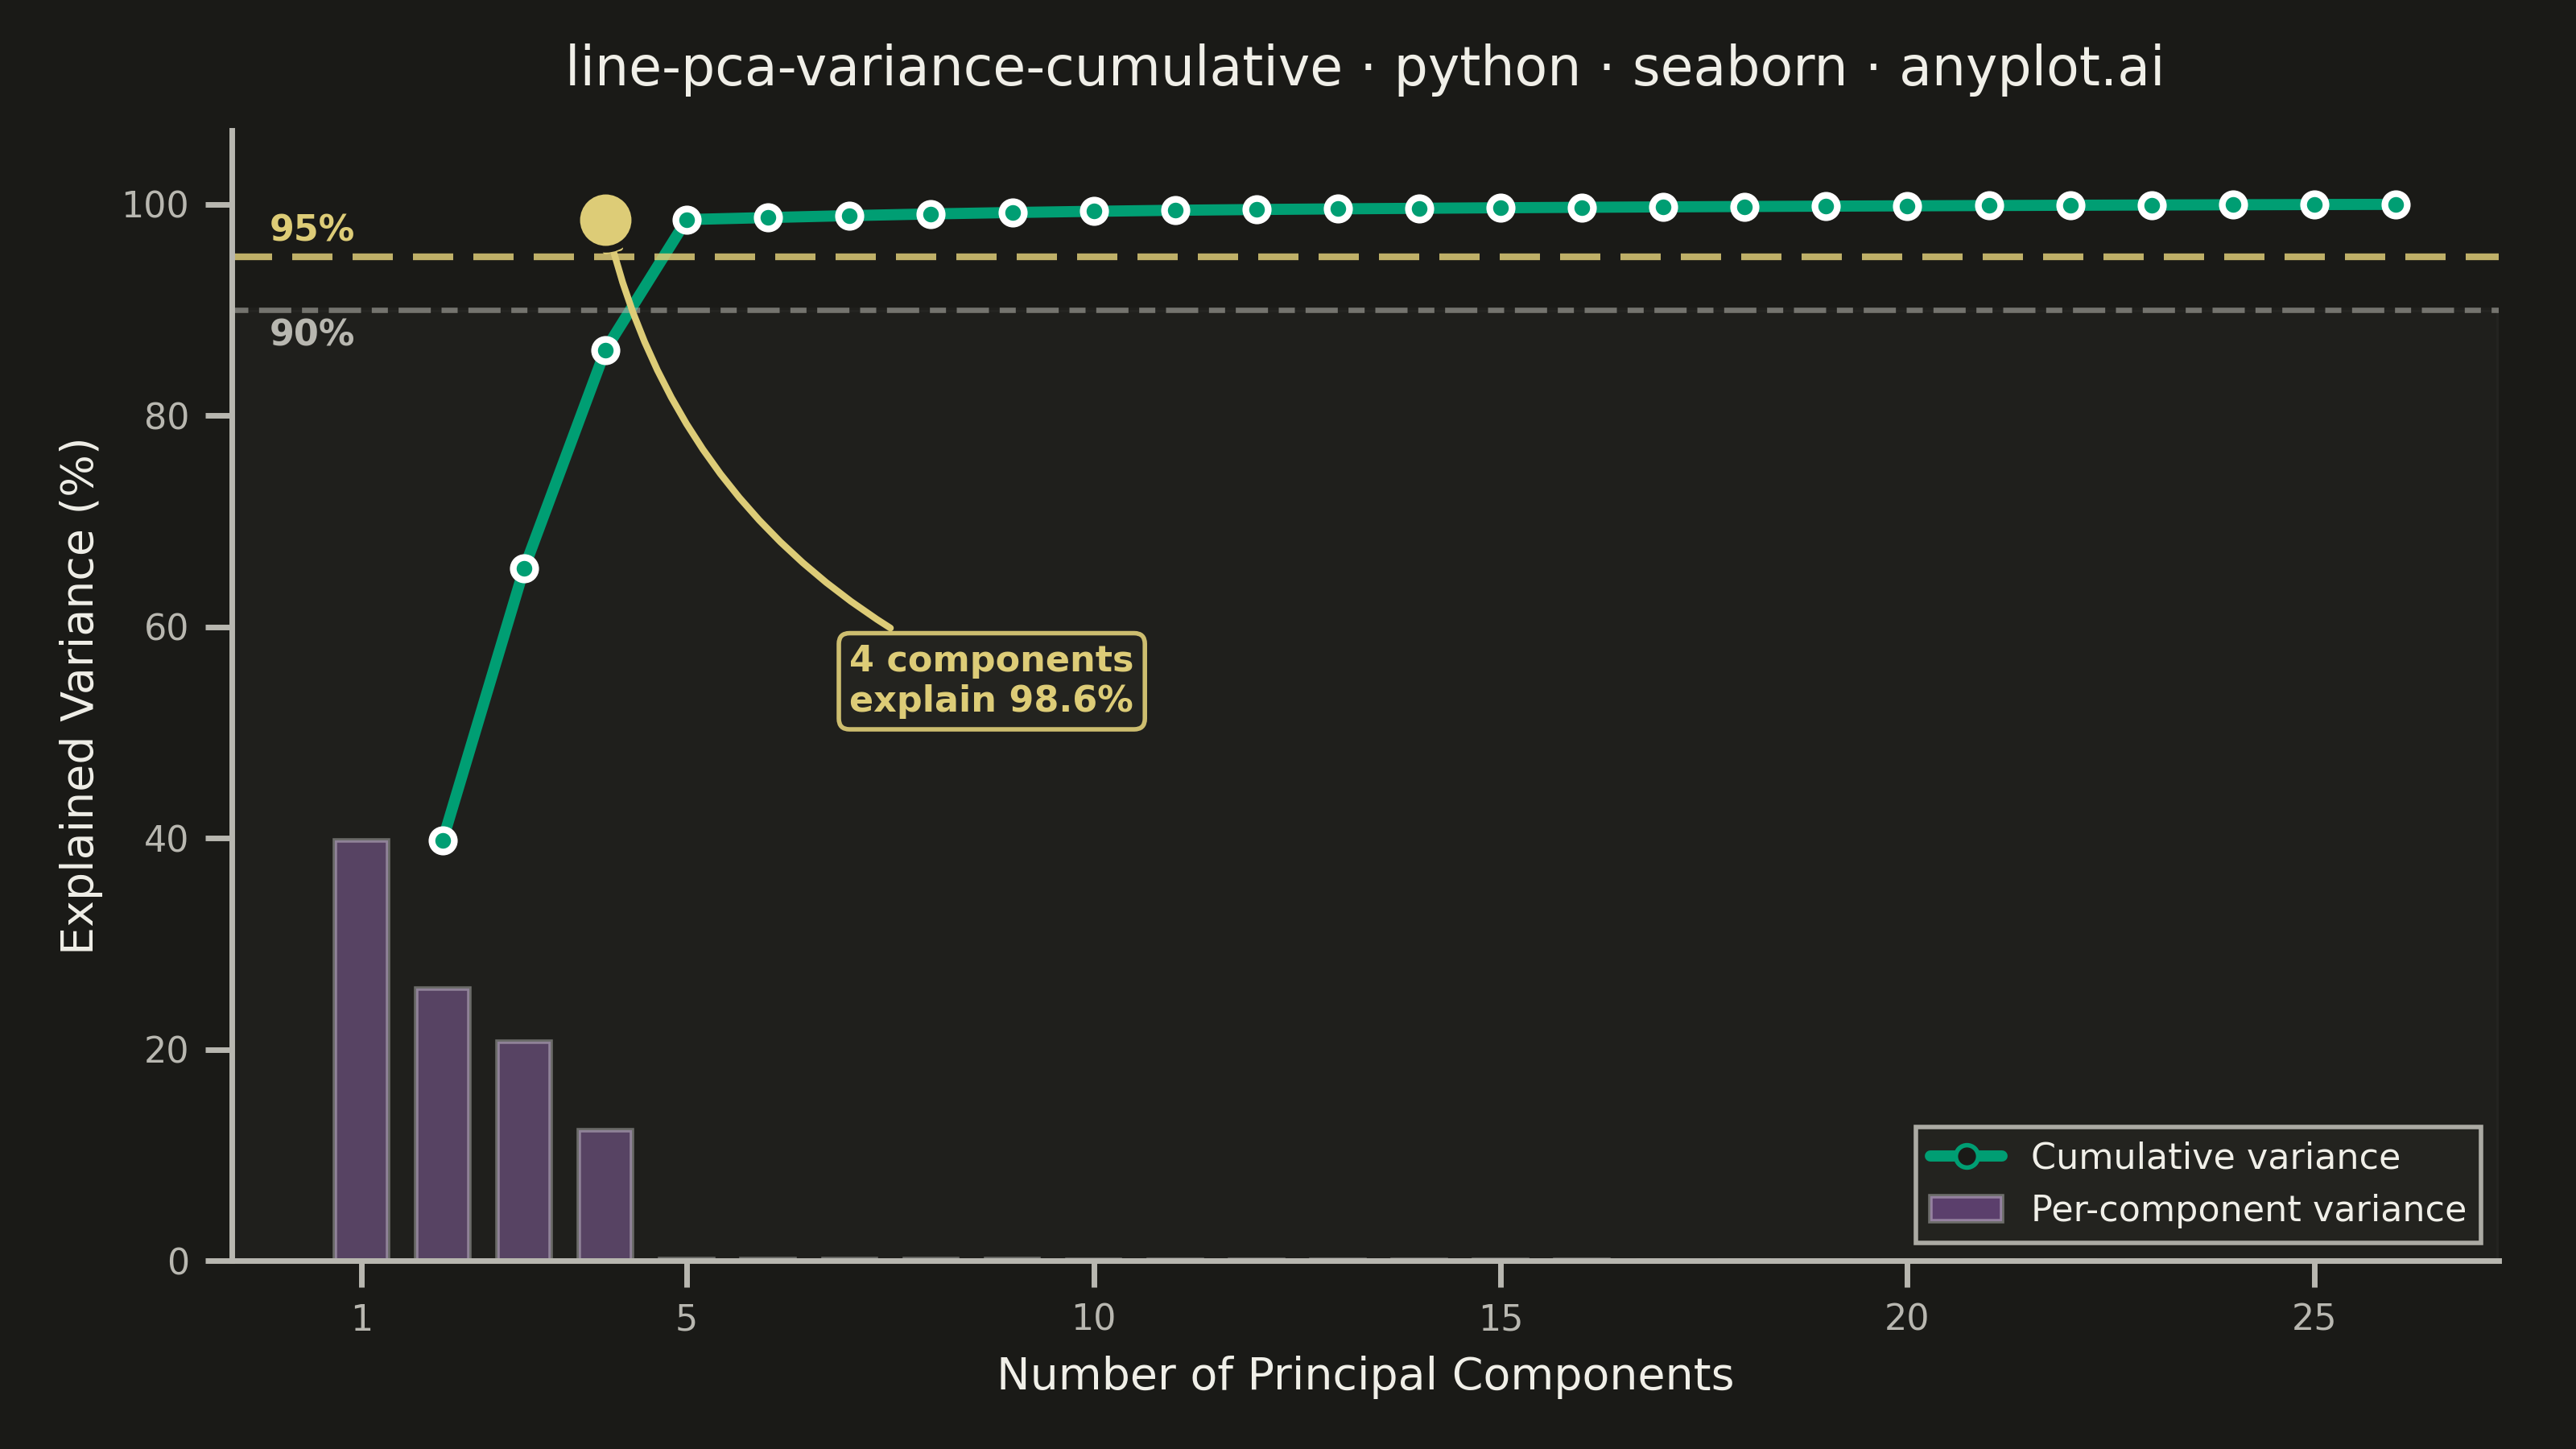
A line plot showing the cumulative proportion of explained variance as a function of the number of Principal Component Analysis (PCA) components. This visualization helps determine the optimal number of components to retain by displaying the trade-off between dimensionality reduction and information preservation. The cumulative curve typically exhibits an elbow pattern where additional components yield diminishing returns, and horizontal threshold lines (e.g., 90%, 95%) guide component selection decisions.
""" anyplot.ai
line-pca-variance-cumulative: Cumulative Explained Variance for PCA Component Selection
Library: seaborn 0.13.2 | Python 3.13.13
Quality: 90/100 | Updated: 2026-05-29
"""

import os
import sys as _sys


# Remove the script's own directory from sys.path to prevent sibling files
# (e.g. matplotlib.py, seaborn.py) from shadowing installed packages.
_script_dir = os.path.dirname(os.path.abspath(__file__)) if "__file__" in vars() else os.getcwd()
_sys.path = [p for p in _sys.path if os.path.realpath(p or ".") != os.path.realpath(_script_dir)]
del _sys, _script_dir

import matplotlib.pyplot as plt
import numpy as np
import pandas as pd
import seaborn as sns
from matplotlib.lines import Line2D
from matplotlib.patches import Patch
from sklearn.decomposition import PCA
from sklearn.preprocessing import StandardScaler


# Theme tokens — Imprint palette
THEME = os.getenv("ANYPLOT_THEME", "light")
PAGE_BG = "#FAF8F1" if THEME == "light" else "#1A1A17"
ELEVATED_BG = "#FFFDF6" if THEME == "light" else "#242420"
INK = "#1A1A17" if THEME == "light" else "#F0EFE8"
INK_SOFT = "#4A4A44" if THEME == "light" else "#B8B7B0"
INK_MUTED = "#6B6A63" if THEME == "light" else "#A8A79F"

IMPRINT_PALETTE = ["#009E73", "#C475FD", "#4467A3", "#BD8233", "#AE3030", "#2ABCCD", "#954477", "#99B314"]
ANYPLOT_AMBER = "#DDCC77"

# Data — synthetic macroeconomic indicators (240 months × 25 indicators, 4 latent factors)
# Represents macro-factor decomposition: growth, inflation, financial stress, trade
np.random.seed(42)
n_periods, n_indicators = 240, 25
factor_names = ["Growth", "Inflation", "Financial Stress", "Trade"]
factors = np.random.randn(n_periods, 4)
loadings = np.random.randn(4, n_indicators) * 1.8
X = factors @ loadings + np.random.randn(n_periods, n_indicators) * 0.35
X = StandardScaler().fit_transform(X)

pca = PCA()
pca.fit(X)

n_components = np.arange(1, len(pca.explained_variance_ratio_) + 1)
individual_variance = pca.explained_variance_ratio_ * 100
cumulative_variance = np.cumsum(individual_variance)

# Find where cumulative variance crosses thresholds
idx_90 = int(np.argmax(cumulative_variance >= 90))
idx_95 = int(np.argmax(cumulative_variance >= 95))
comp_95 = n_components[idx_95]
val_95 = cumulative_variance[idx_95]

# Tidy dataframe — seaborn categorical x-axis
df = pd.DataFrame(
    {
        "Component": np.tile(n_components, 2),
        "Variance (%)": np.concatenate([individual_variance, cumulative_variance]),
        "Measure": (["Individual Variance"] * len(n_components) + ["Cumulative Variance"] * len(n_components)),
    }
)

# Seaborn theme with Imprint chrome
sns.set_theme(
    style="ticks",
    rc={
        "figure.facecolor": PAGE_BG,
        "axes.facecolor": PAGE_BG,
        "axes.edgecolor": INK_SOFT,
        "axes.labelcolor": INK,
        "text.color": INK,
        "xtick.color": INK_SOFT,
        "ytick.color": INK_SOFT,
        "grid.color": INK,
        "grid.alpha": 0.15,
        "grid.linewidth": 0.6,
        "legend.facecolor": ELEVATED_BG,
        "legend.edgecolor": INK_SOFT,
        "axes.spines.top": False,
        "axes.spines.right": False,
        "axes.grid.axis": "y",
        "font.family": "sans-serif",
    },
)

fig, ax = plt.subplots(figsize=(8, 4.5), dpi=400, facecolor=PAGE_BG)
ax.set_facecolor(PAGE_BG)

# Individual variance bars — Imprint position 2 (lavender) as secondary series
df_bar = df[df["Measure"] == "Individual Variance"]
sns.barplot(
    data=df_bar, x="Component", y="Variance (%)", color=IMPRINT_PALETTE[1], alpha=0.35, width=0.65, legend=False, ax=ax
)

# Cumulative variance line — Imprint position 1 (#009E73) as first/primary series
df_line = df[df["Measure"] == "Cumulative Variance"]
sns.lineplot(
    data=df_line,
    x="Component",
    y="Variance (%)",
    color=IMPRINT_PALETTE[0],
    linewidth=2.5,
    marker="o",
    markersize=5,
    markeredgewidth=1.5,
    ax=ax,
)
# Hollow markers: PAGE_BG fill, Imprint green edge
ax.lines[0].set_markerfacecolor(PAGE_BG)
ax.lines[0].set_markeredgecolor(IMPRINT_PALETTE[0])

# Threshold reference lines
ax.axhline(y=95, color=ANYPLOT_AMBER, linestyle="--", linewidth=1.5, alpha=0.85, dashes=(6, 3))
ax.axhline(y=90, color=INK_SOFT, linestyle="--", linewidth=1.2, alpha=0.55, dashes=(3, 2, 6, 2))

# Threshold labels (left margin, outside plot data)
ax.text(-0.6, 95.8, "95%", fontsize=8, color=ANYPLOT_AMBER, fontweight="bold", va="bottom", ha="center")
ax.text(-0.6, 89.2, "90%", fontsize=8, color=INK_SOFT, fontweight="bold", va="top", ha="center")

# Highlight 95% crossing — amber ring marker
ax.plot(
    idx_95,
    val_95,
    "o",
    markersize=13,
    markerfacecolor=ANYPLOT_AMBER,
    markeredgecolor=PAGE_BG,
    markeredgewidth=1.5,
    zorder=5,
)

# Annotation with curved arrow
annotation_x = idx_95 + 3 if idx_95 < len(n_components) // 2 else idx_95 - 5
ax.annotate(
    f"{comp_95} components\nexplain {val_95:.1f}%",
    xy=(idx_95, val_95),
    xytext=(annotation_x, 52),
    fontsize=8,
    fontweight="bold",
    color=ANYPLOT_AMBER,
    arrowprops={"arrowstyle": "-|>", "color": ANYPLOT_AMBER, "lw": 1.5, "connectionstyle": "arc3,rad=-0.25"},
    bbox={"boxstyle": "round,pad=0.3", "facecolor": ELEVATED_BG, "edgecolor": ANYPLOT_AMBER, "alpha": 0.92},
)

# Subtle shading: below-90% region
ax.axhspan(0, 90, color=INK_MUTED, alpha=0.04)

# Manual legend
legend_elements = [
    Line2D(
        [0],
        [0],
        color=IMPRINT_PALETTE[0],
        linewidth=2.5,
        marker="o",
        markersize=5,
        markerfacecolor=PAGE_BG,
        markeredgecolor=IMPRINT_PALETTE[0],
        label="Cumulative variance",
    ),
    Patch(facecolor=IMPRINT_PALETTE[1], alpha=0.35, label="Per-component variance"),
]
ax.legend(handles=legend_elements, fontsize=8, loc="lower right", framealpha=0.92, edgecolor=INK_SOFT, fancybox=False)
sns.despine(ax=ax, top=True, right=True)

# Axis styling
ax.set_xlabel("Number of Principal Components", fontsize=10, color=INK)
ax.set_ylabel("Explained Variance (%)", fontsize=10, color=INK)

title = "line-pca-variance-cumulative · python · seaborn · anyplot.ai"
n = len(title)
title_fs = round(12 * 67 / n) if n > 67 else 12
ax.set_title(title, fontsize=title_fs, fontweight="medium", color=INK, pad=10)

ax.tick_params(axis="both", labelsize=8, colors=INK_SOFT)
ax.set_ylim(0, 107)

# Sparse x-tick labels so the axis stays readable for 25 components
n_total = len(n_components)
show_positions = [i for i in range(n_total) if (i + 1) % 5 == 0 or i == 0]
ax.set_xticks(show_positions)
ax.set_xticklabels([str(n_components[i]) for i in show_positions])

for spine in ("left", "bottom"):
    ax.spines[spine].set_color(INK_SOFT)

fig.subplots_adjust(top=0.91, bottom=0.13, left=0.09, right=0.97)
plt.savefig(f"plot-{THEME}.png", dpi=400, facecolor=PAGE_BG)
Runnable source as JSON, for any HTTP client: https://api.anyplot.ai/specs/line-pca-variance-cumulative/seaborn/code. Any spec id and library id listed in llms-full.txt fit the same URL shape; every URL below is complete and callable.
{
  "spec_id": "line-pca-variance-cumulative",
  "language": "python",
  "library": "seaborn",
  "page": "https://anyplot.ai/line-pca-variance-cumulative/python/seaborn",
  "hub": "https://anyplot.ai/line-pca-variance-cumulative",
  "code_json": "https://api.anyplot.ai/specs/line-pca-variance-cumulative/seaborn/code",
  "spec_json": "https://api.anyplot.ai/specs/line-pca-variance-cumulative",
  "render_light_png": "https://storage.googleapis.com/anyplot-images/plots/line-pca-variance-cumulative/python/seaborn/plot-light.png",
  "render_dark_png": "https://storage.googleapis.com/anyplot-images/plots/line-pca-variance-cumulative/python/seaborn/plot-dark.png",
  "quality_score": 90.0,
  "license": "MIT",
  "guide": "https://anyplot.ai/llms.txt"
}
Part of Cumulative Explained Variance for PCA Component Selection on anyplot.ai.