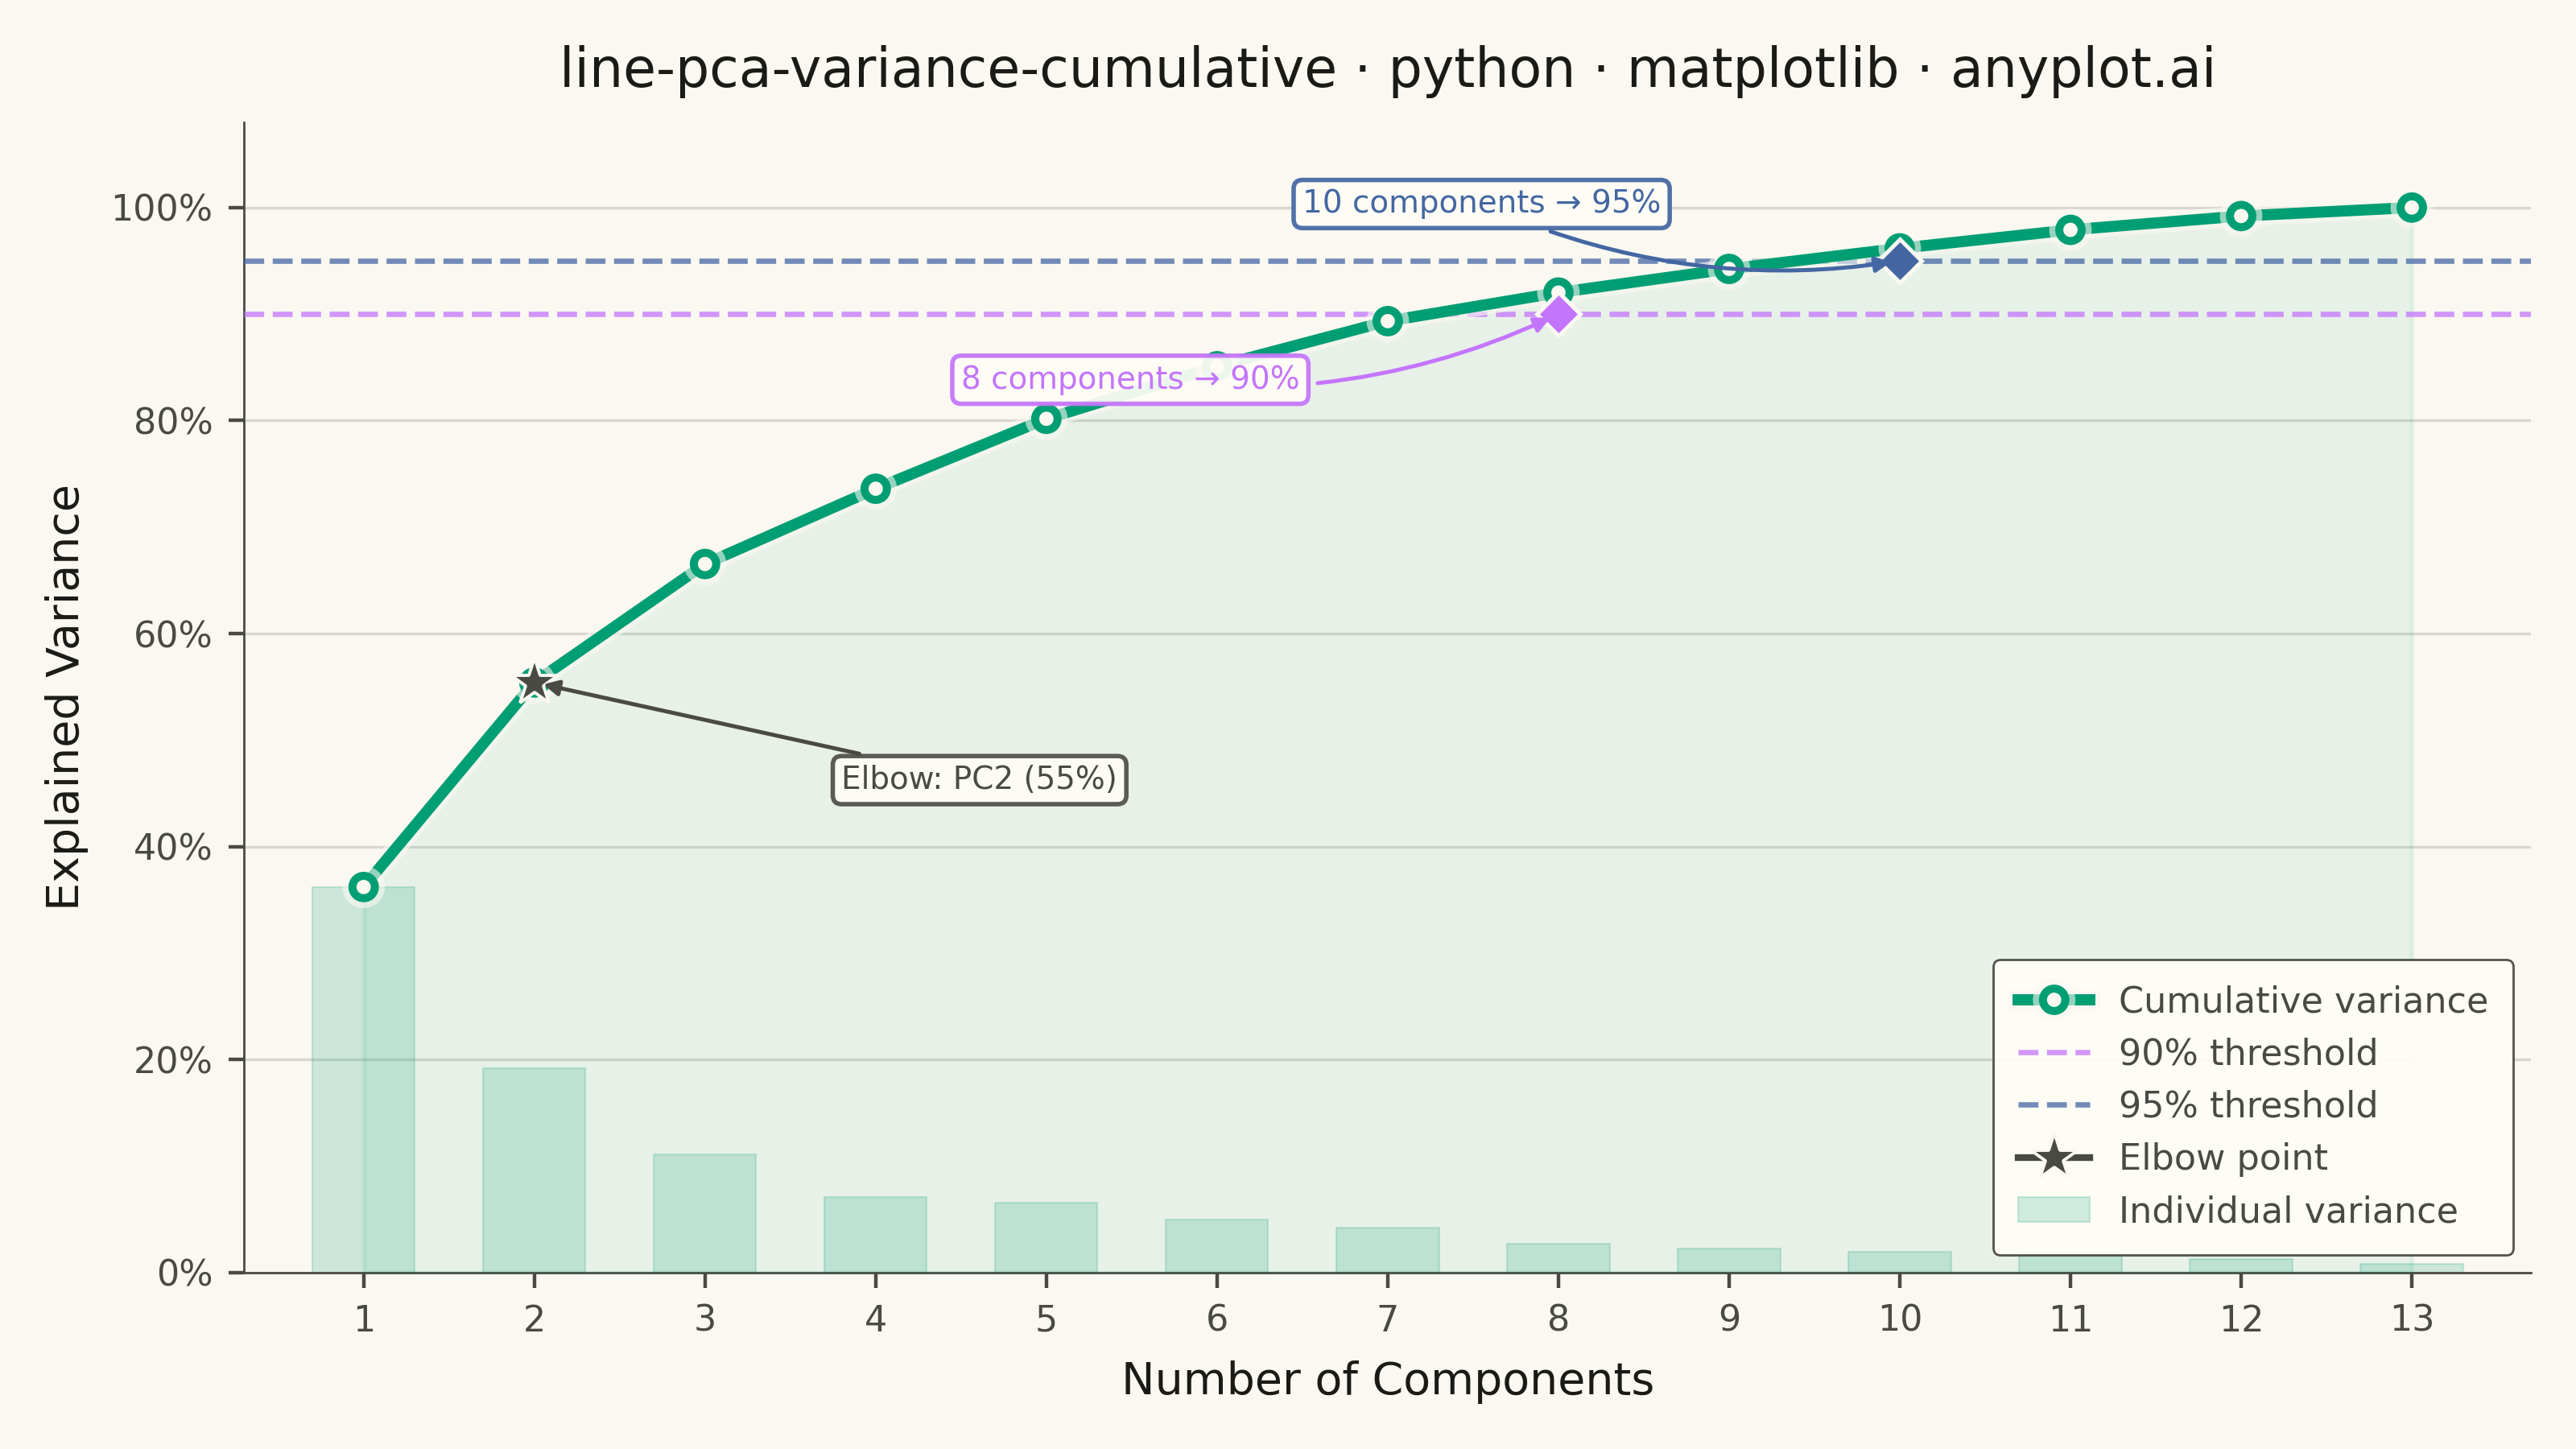
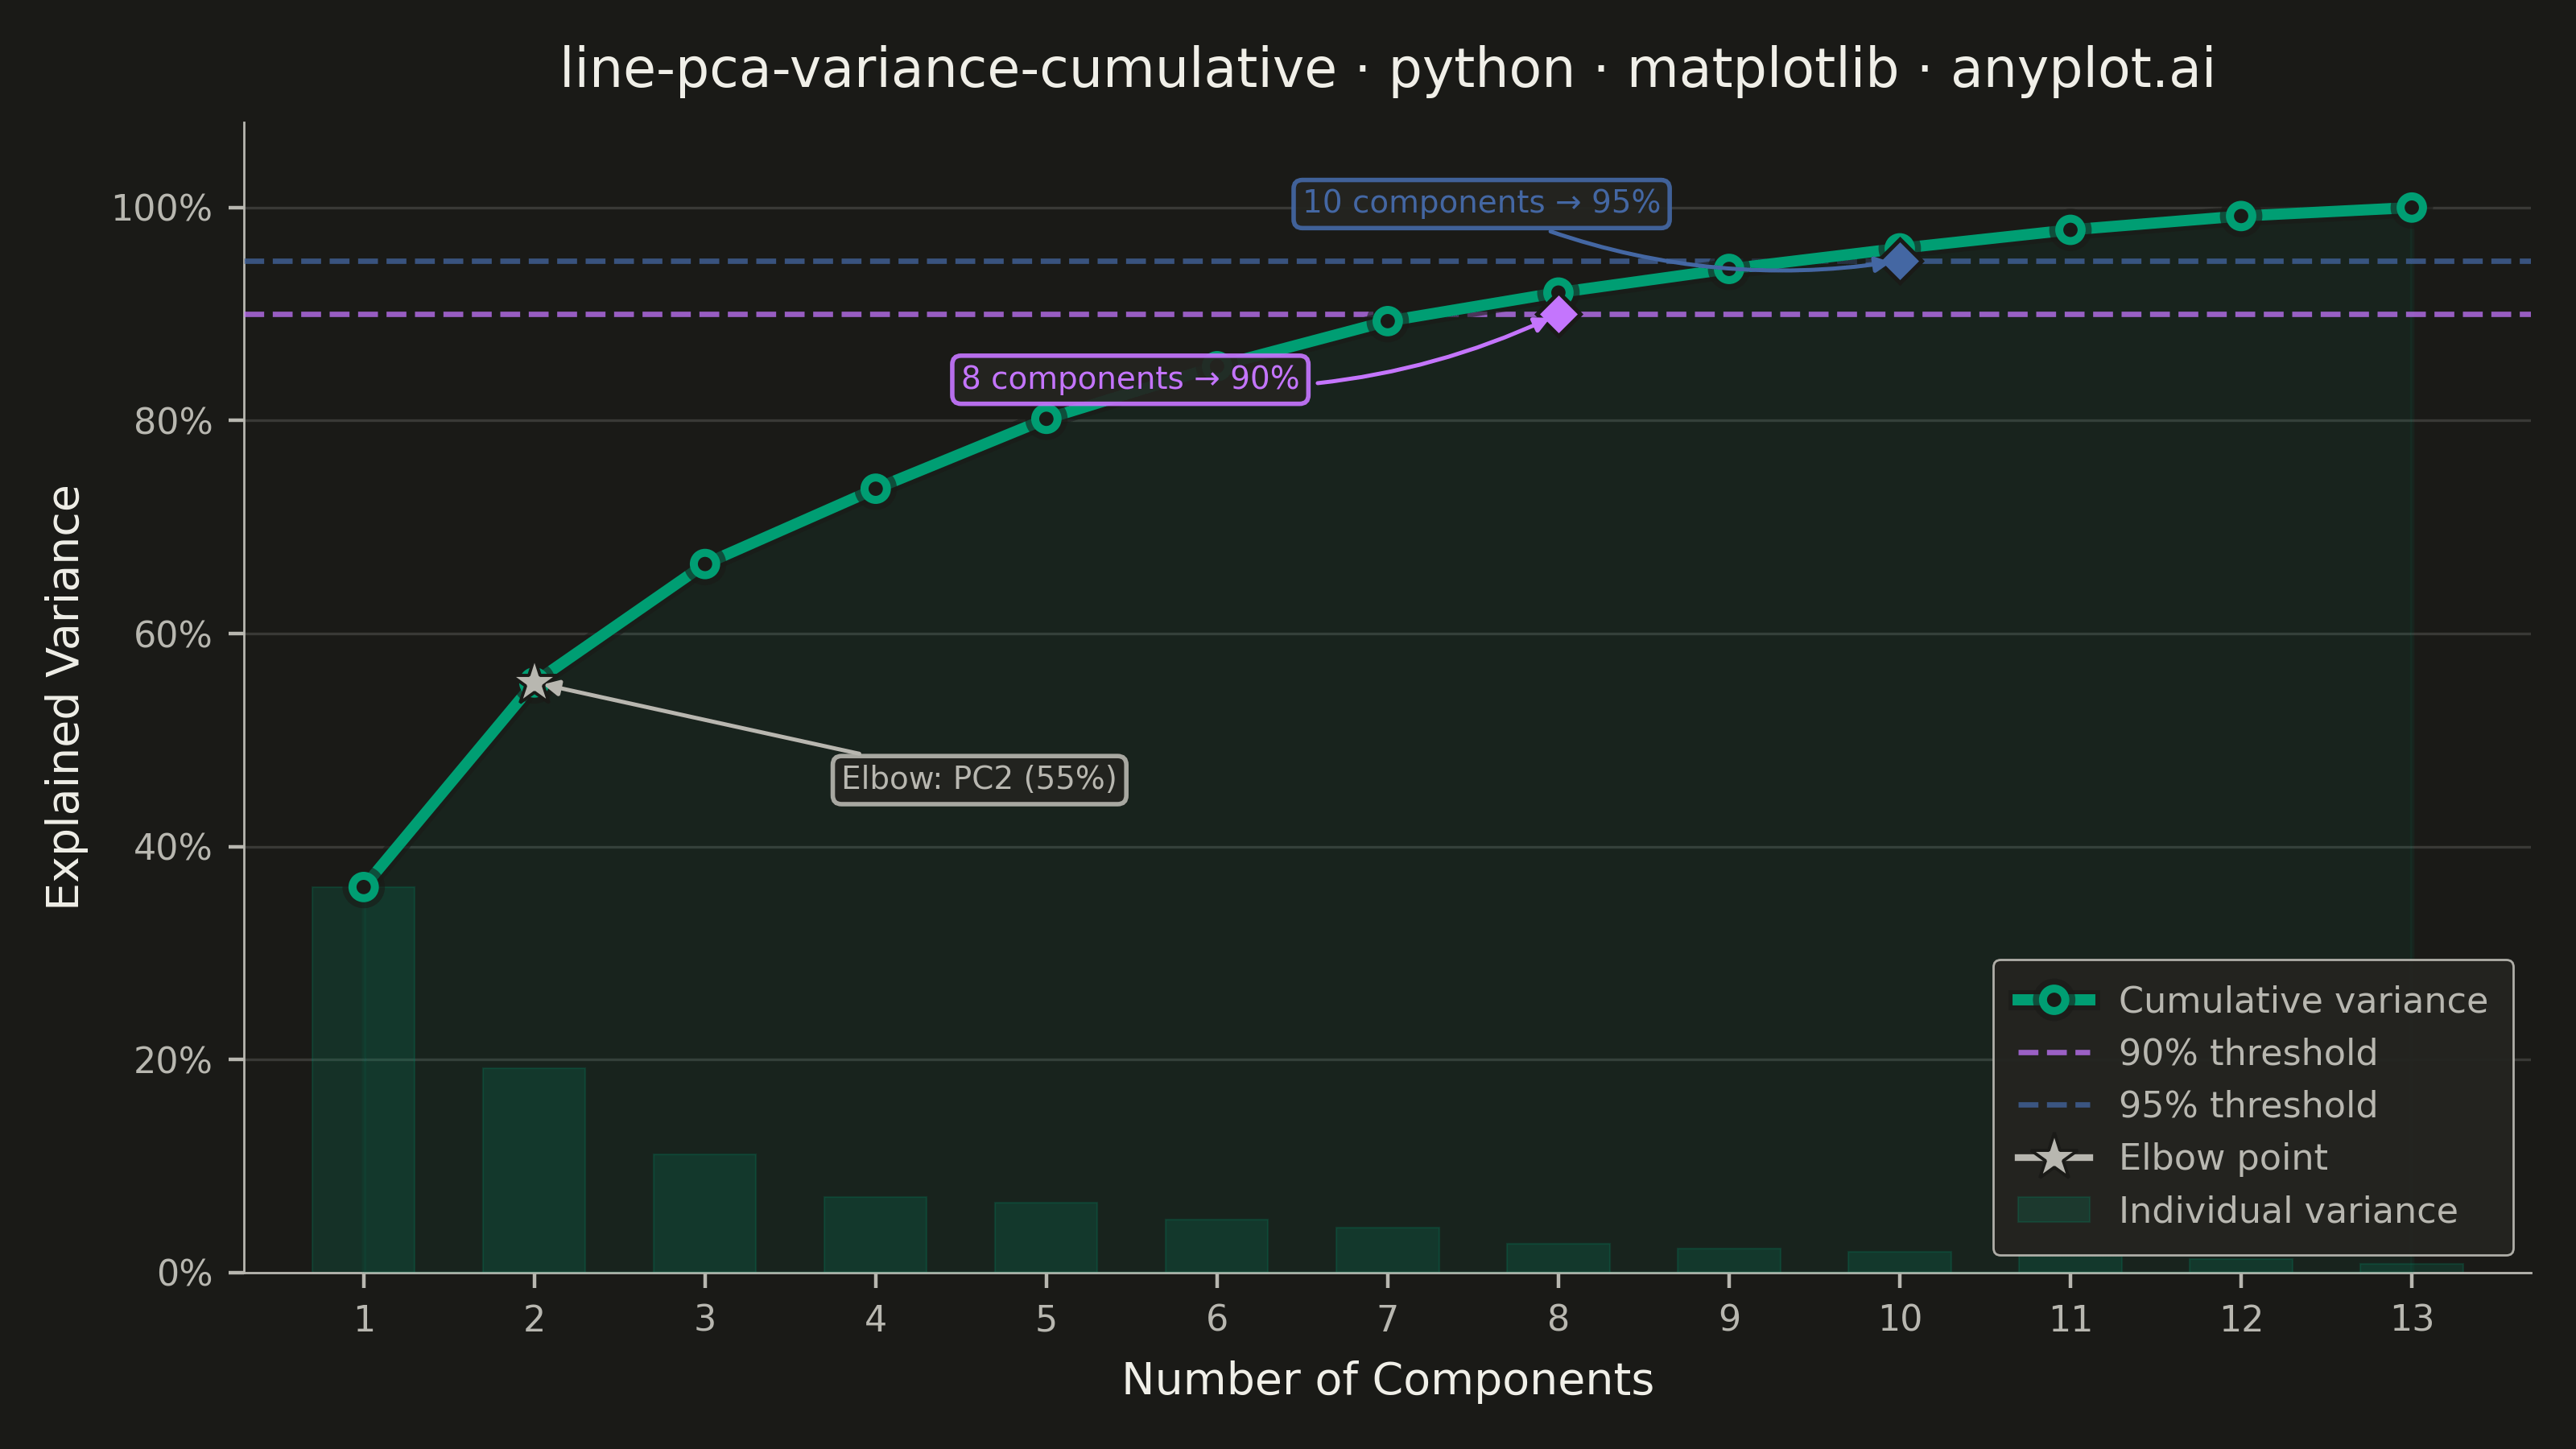
A line plot showing the cumulative proportion of explained variance as a function of the number of Principal Component Analysis (PCA) components. This visualization helps determine the optimal number of components to retain by displaying the trade-off between dimensionality reduction and information preservation. The cumulative curve typically exhibits an elbow pattern where additional components yield diminishing returns, and horizontal threshold lines (e.g., 90%, 95%) guide component selection decisions.
""" anyplot.ai
line-pca-variance-cumulative: Cumulative Explained Variance for PCA Component Selection
Library: matplotlib 3.10.9 | Python 3.13.13
Quality: 92/100 | Updated: 2026-05-29
"""

import os
import sys


# Remove the script's own directory from sys.path so this file (matplotlib.py)
# doesn't shadow the installed matplotlib package.
_this_dir = os.path.dirname(os.path.abspath(__file__))
sys.path = [p for p in sys.path if p and os.path.normcase(os.path.abspath(p)) != os.path.normcase(_this_dir)]

import matplotlib.patheffects as pe
import matplotlib.pyplot as plt
import matplotlib.ticker as mticker
import numpy as np
from sklearn.datasets import load_wine
from sklearn.decomposition import PCA
from sklearn.preprocessing import StandardScaler


# Theme
THEME = os.getenv("ANYPLOT_THEME", "light")
PAGE_BG = "#FAF8F1" if THEME == "light" else "#1A1A17"
ELEVATED_BG = "#FFFDF6" if THEME == "light" else "#242420"
INK = "#1A1A17" if THEME == "light" else "#F0EFE8"
INK_SOFT = "#4A4A44" if THEME == "light" else "#B8B7B0"
INK_MUTED = "#6B6A63" if THEME == "light" else "#A8A79F"

# Imprint palette — 8 hues, hybrid-v3 sort order
IMPRINT_PALETTE = ["#009E73", "#C475FD", "#4467A3", "#BD8233", "#AE3030", "#2ABCCD", "#954477", "#99B314"]
BRAND = IMPRINT_PALETTE[0]  # cumulative variance line
LAVENDER = IMPRINT_PALETTE[1]  # 90% threshold
BLUE = IMPRINT_PALETTE[2]  # 95% threshold

# Data — scikit-learn wine dataset (13 features → 13 PCA components)
wine = load_wine()
X = StandardScaler().fit_transform(wine.data)
pca = PCA().fit(X)

variance = pca.explained_variance_ratio_
cumulative = np.cumsum(variance)
components = np.arange(1, len(cumulative) + 1)

# Elbow detection via maximum curvature in second discrete difference
diffs = np.diff(cumulative)
diffs2 = np.diff(diffs)
elbow_idx = int(np.argmin(diffs2)) + 1  # shifted by one from double-diff
elbow_component = elbow_idx + 1  # 1-indexed

# Threshold crossings
thresholds = [(0.90, "90%", LAVENDER), (0.95, "95%", BLUE)]
n_at_threshold = [int(np.argmax(cumulative >= t)) + 1 for t, _, _ in thresholds]

# Canvas — hard rule: 3200 × 1800 px (landscape 16:9)
fig, ax = plt.subplots(figsize=(8, 4.5), dpi=400, facecolor=PAGE_BG)
ax.set_facecolor(PAGE_BG)

# Individual variance bars (muted overlay, same brand green at low alpha)
ax.bar(
    components,
    variance,
    color=BRAND,
    alpha=0.18,
    width=0.6,
    edgecolor=BRAND,
    linewidth=0.4,
    label="Individual variance",
    zorder=2,
)

# Shaded area under cumulative curve
ax.fill_between(components, cumulative, alpha=0.07, color=BRAND, zorder=3)

# Cumulative variance line with open-circle markers
ax.plot(
    components,
    cumulative,
    color=BRAND,
    linewidth=2.5,
    marker="o",
    markersize=5,
    markerfacecolor=PAGE_BG,
    markeredgecolor=BRAND,
    markeredgewidth=1.8,
    label="Cumulative variance",
    zorder=5,
    path_effects=[pe.Stroke(linewidth=4.5, foreground=PAGE_BG, alpha=0.6), pe.Normal()],
)

# Threshold horizontal lines + crossing annotations
for i, ((t, label, color), n_comp) in enumerate(zip(thresholds, n_at_threshold, strict=True)):
    ax.axhline(y=t, color=color, linestyle="--", linewidth=1.2, alpha=0.75, label=f"{label} threshold", zorder=4)
    ax.plot(n_comp, t, marker="D", color=color, markersize=7, zorder=6, markeredgecolor=PAGE_BG, markeredgewidth=0.9)
    # Annotation: place to the left of the crossing point
    text_x = max(n_comp - 3.5, 1.5)
    text_y = t + (0.045 if i == 1 else -0.07)
    ax.annotate(
        f"{n_comp} components → {label}",
        xy=(n_comp, t),
        xytext=(text_x, text_y),
        fontsize=7,
        color=color,
        arrowprops={"arrowstyle": "-|>", "color": color, "lw": 0.9, "connectionstyle": "arc3,rad=0.15"},
        bbox={"boxstyle": "round,pad=0.28", "facecolor": ELEVATED_BG, "edgecolor": color, "alpha": 0.93},
        zorder=7,
    )

# Elbow marker — neutral semantic anchor (reference / derived feature)
ax.plot(
    elbow_component,
    cumulative[elbow_idx],
    marker="*",
    color=INK_SOFT,
    markersize=11,
    zorder=6,
    markeredgecolor=PAGE_BG,
    markeredgewidth=0.7,
    label="Elbow point",
)
ax.annotate(
    f"Elbow: PC{elbow_component} ({cumulative[elbow_idx]:.0%})",
    xy=(elbow_component, cumulative[elbow_idx]),
    xytext=(elbow_component + 1.8, cumulative[elbow_idx] - 0.10),
    fontsize=7,
    color=INK_SOFT,
    arrowprops={"arrowstyle": "-|>", "color": INK_SOFT, "lw": 0.9},
    bbox={"boxstyle": "round,pad=0.28", "facecolor": ELEVATED_BG, "edgecolor": INK_SOFT, "alpha": 0.9},
    zorder=7,
)

# Title — scale fontsize to avoid overflow (formula from library prompt)
title = "line-pca-variance-cumulative · python · matplotlib · anyplot.ai"
title_fontsize = max(8, round(12 * 67 / len(title))) if len(title) > 67 else 12
ax.set_title(title, fontsize=title_fontsize, fontweight="medium", pad=8, color=INK)

# Axis labels
ax.set_xlabel("Number of Components", fontsize=10, labelpad=5, color=INK)
ax.set_ylabel("Explained Variance", fontsize=10, labelpad=5, color=INK)

# Ticks
ax.tick_params(axis="both", labelsize=8, colors=INK_SOFT, labelcolor=INK_SOFT)
ax.set_xticks(components)
ax.set_xlim(0.3, len(components) + 0.7)
ax.set_ylim(0, 1.08)

# Percentage formatter on y-axis
ax.yaxis.set_major_formatter(mticker.FuncFormatter(lambda v, _: f"{v:.0%}"))

# Spines — L-shaped frame
for spine in ("top", "right"):
    ax.spines[spine].set_visible(False)
for spine in ("left", "bottom"):
    ax.spines[spine].set_linewidth(0.5)
    ax.spines[spine].set_color(INK_SOFT)

# Grid — y-axis only, subtle
ax.yaxis.grid(True, which="major", alpha=0.15, linewidth=0.6, color=INK)
ax.set_axisbelow(True)

# Legend
handles, labels_list = ax.get_legend_handles_labels()
if len(handles) > 1:
    leg = ax.legend(fontsize=8, loc="lower right", framealpha=0.95, fancybox=True, borderpad=0.7, handlelength=2.0)
    if leg:
        leg.get_frame().set_facecolor(ELEVATED_BG)
        leg.get_frame().set_edgecolor(INK_SOFT)
        leg.get_frame().set_linewidth(0.5)
        plt.setp(leg.get_texts(), color=INK_SOFT)

plt.tight_layout(pad=1.0)
plt.savefig(f"plot-{THEME}.png", dpi=400, facecolor=PAGE_BG)
Runnable source as JSON, for any HTTP client: https://api.anyplot.ai/specs/line-pca-variance-cumulative/matplotlib/code. Any spec id and library id listed in llms-full.txt fit the same URL shape; every URL below is complete and callable.
{
  "spec_id": "line-pca-variance-cumulative",
  "language": "python",
  "library": "matplotlib",
  "page": "https://anyplot.ai/line-pca-variance-cumulative/python/matplotlib",
  "hub": "https://anyplot.ai/line-pca-variance-cumulative",
  "code_json": "https://api.anyplot.ai/specs/line-pca-variance-cumulative/matplotlib/code",
  "spec_json": "https://api.anyplot.ai/specs/line-pca-variance-cumulative",
  "render_light_png": "https://storage.googleapis.com/anyplot-images/plots/line-pca-variance-cumulative/python/matplotlib/plot-light.png",
  "render_dark_png": "https://storage.googleapis.com/anyplot-images/plots/line-pca-variance-cumulative/python/matplotlib/plot-dark.png",
  "quality_score": 92.0,
  "license": "MIT",
  "guide": "https://anyplot.ai/llms.txt"
}
Part of Cumulative Explained Variance for PCA Component Selection on anyplot.ai.