The same plot in 14 other libraries — JavaScript: Chart.js, D3.js, Highcharts, MUI X Charts; Python: Altair, Bokeh, lets-plot, Matplotlib, Plotly, plotnine, Pygal, Seaborn; R: ggplot2; Julia: Makie.jl. Compare all 15 side by side: Cumulative Explained Variance for PCA Component Selection in Python, R, Julia and JavaScript.
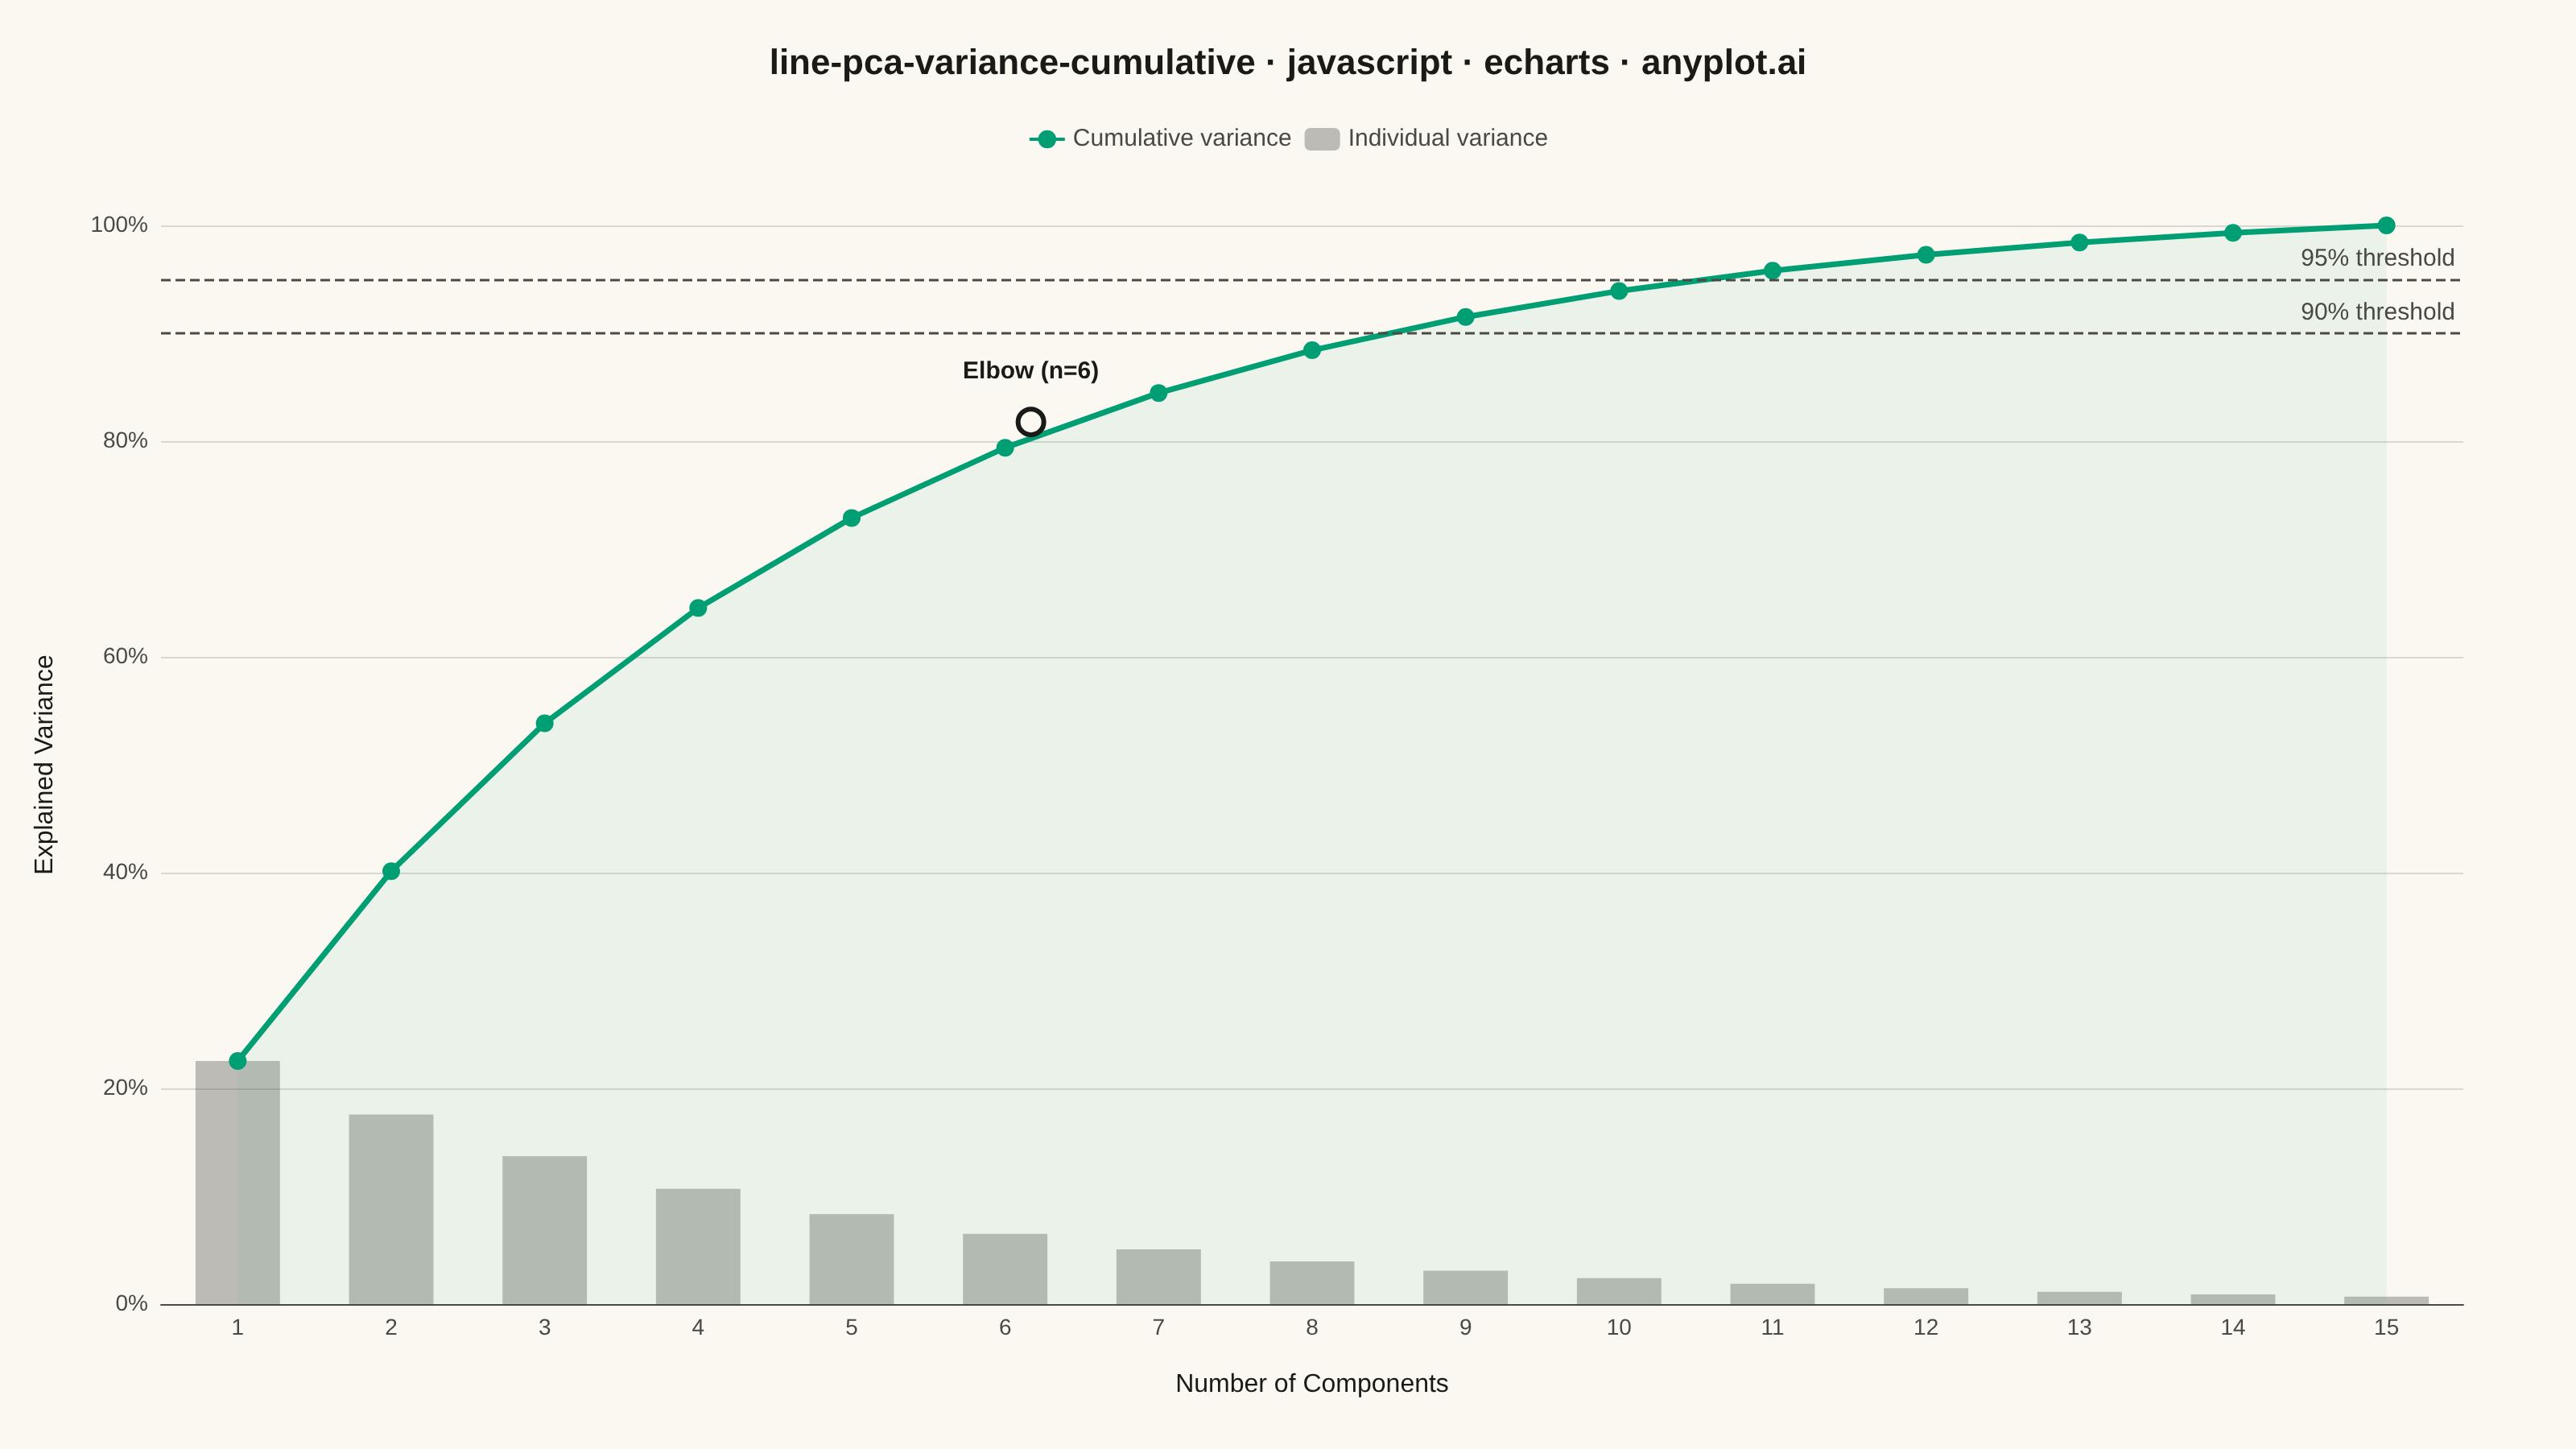
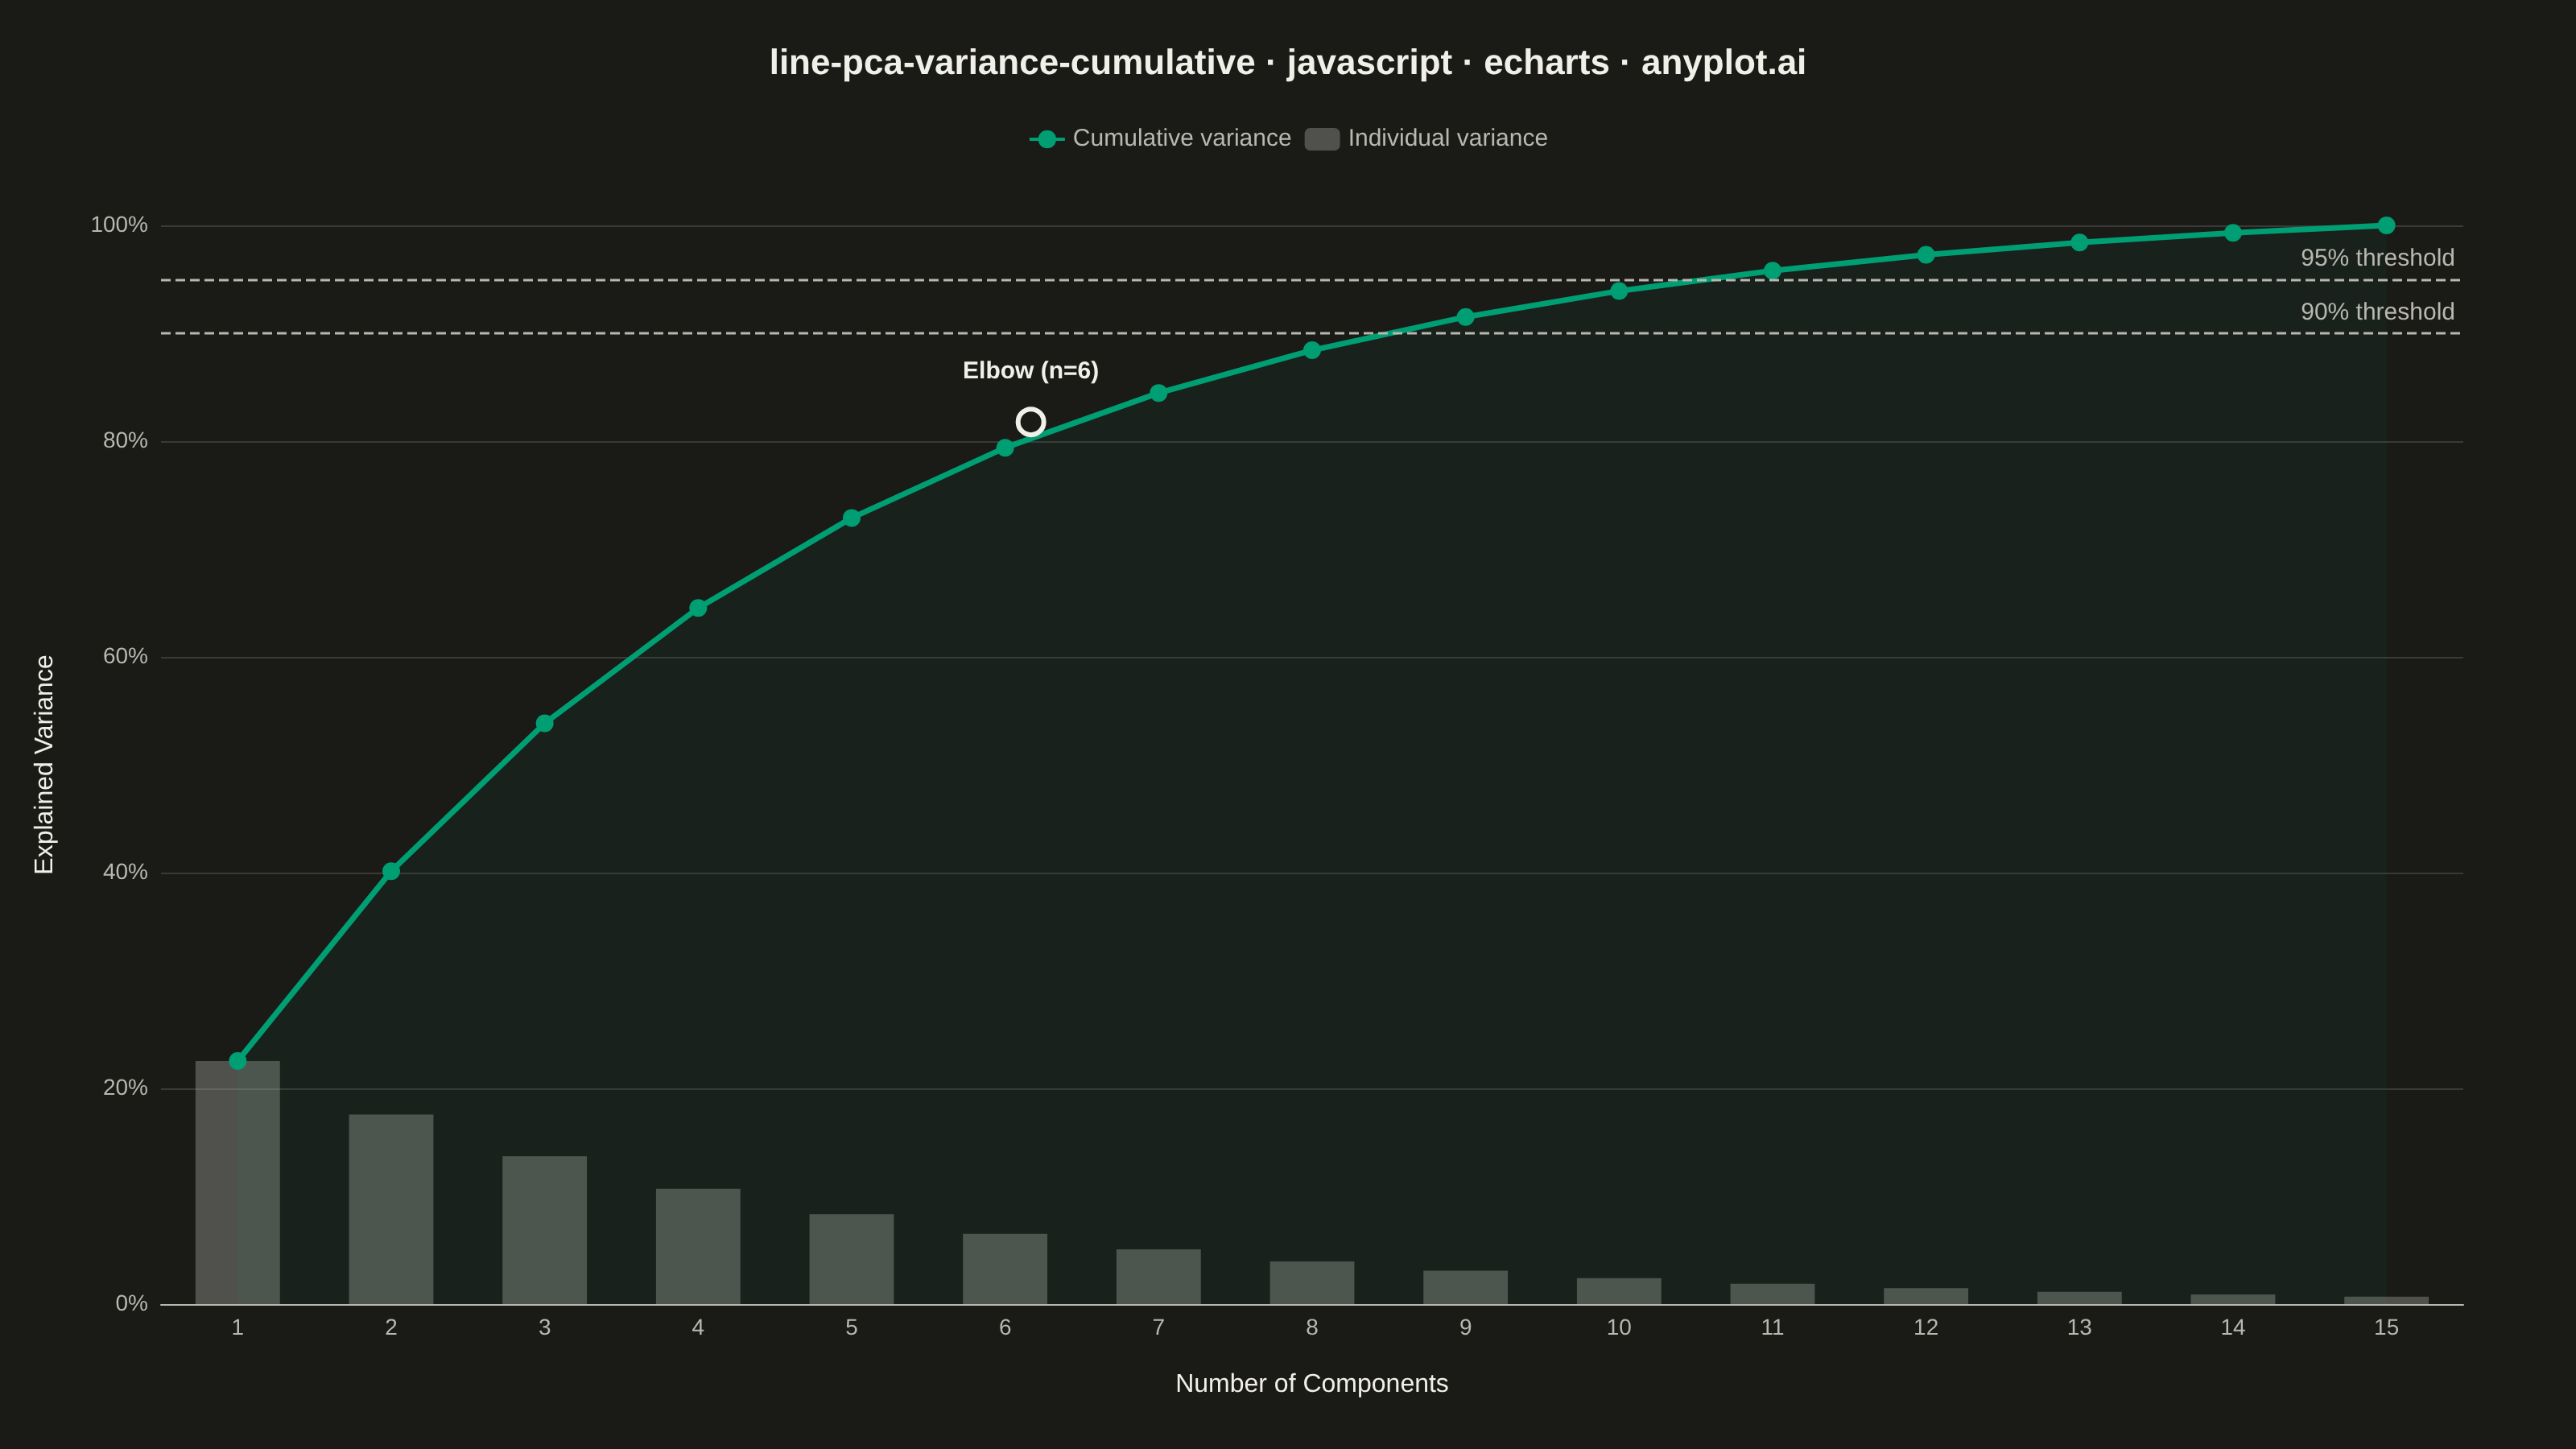
A line plot showing the cumulative proportion of explained variance as a function of the number of Principal Component Analysis (PCA) components. This visualization helps determine the optimal number of components to retain by displaying the trade-off between dimensionality reduction and information preservation. The cumulative curve typically exhibits an elbow pattern where additional components yield diminishing returns, and horizontal threshold lines (e.g., 90%, 95%) guide component selection decisions.
// anyplot.ai
// line-pca-variance-cumulative: Cumulative Explained Variance for PCA Component Selection
// Library: echarts 6.1.0 | JavaScript 22.23.2
// Quality: 91/100 | Created: 2026-08-26

const t = window.ANYPLOT_TOKENS;

// --- Data (in-memory, deterministic) ----------------------------------------
// Synthetic PCA spectrum for a 15-sensor industrial monitoring array: a
// geometrically decaying eigenvalue sequence, normalized so the individual
// ratios sum to 1 (mirrors sklearn's PCA.explained_variance_ratio_).
const N_COMPONENTS = 15;
const DECAY = 0.78;
const rawEigenvalues = Array.from({ length: N_COMPONENTS }, (_, i) => 45 * Math.pow(DECAY, i));
const eigenSum = rawEigenvalues.reduce((a, b) => a + b, 0);
const individualPct = rawEigenvalues.map((v) => (v / eigenSum) * 100);
const cumulativePct = individualPct.reduce((acc, v, i) => {
  acc.push((i === 0 ? 0 : acc[i - 1]) + v);
  return acc;
}, []);
const components = Array.from({ length: N_COMPONENTS }, (_, i) => String(i + 1));

// Elbow point: index of maximum perpendicular distance from the chord joining
// the first and last cumulative points (kneedle heuristic for a concave curve).
function findElbowIndex(values) {
  const n = values.length;
  const x1 = 1, y1 = values[0];
  const x2 = n, y2 = values[n - 1];
  const denom = Math.sqrt((y2 - y1) ** 2 + (x2 - x1) ** 2);
  let bestIdx = 0, bestDist = -1;
  values.forEach((y0, i) => {
    const x0 = i + 1;
    const dist = Math.abs((y2 - y1) * x0 - (x2 - x1) * y0 + x2 * y1 - y2 * x1) / denom;
    if (dist > bestDist) { bestDist = dist; bestIdx = i; }
  });
  return bestIdx;
}
const elbowIdx = findElbowIndex(cumulativePct);

// --- Init --------------------------------------------------------------------
const chart = echarts.init(document.getElementById("container"));

// --- Option -------------------------------------------------------------------
chart.setOption({
  animation: false,
  color: [t.palette[0]],
  backgroundColor: "transparent",
  title: {
    text: "line-pca-variance-cumulative · javascript · echarts · anyplot.ai",
    left: "center",
    top: 24,
    textStyle: { color: t.ink, fontSize: 22, fontWeight: "bold" },
  },
  legend: {
    data: ["Cumulative variance", "Individual variance"],
    top: 74,
    left: "center",
    textStyle: { color: t.inkSoft, fontSize: 15 },
    itemWidth: 22,
    itemHeight: 14,
  },
  grid: { left: 100, right: 70, top: 140, bottom: 90 },
  xAxis: {
    type: "category",
    data: components,
    name: "Number of Components",
    nameLocation: "middle",
    nameGap: 42,
    nameTextStyle: { color: t.ink, fontSize: 16 },
    axisLabel: { color: t.inkSoft, fontSize: 14 },
    axisLine: { lineStyle: { color: t.inkSoft } },
    axisTick: { show: false },
    splitLine: { show: false },
  },
  yAxis: {
    type: "value",
    name: "Explained Variance",
    nameLocation: "middle",
    nameGap: 64,
    nameTextStyle: { color: t.ink, fontSize: 16 },
    min: 0,
    max: 100,
    axisLabel: { color: t.inkSoft, fontSize: 14, formatter: "{value}%" },
    axisLine: { show: false },
    splitLine: { lineStyle: { color: t.grid } },
  },
  series: [
    {
      name: "Cumulative variance",
      type: "line",
      data: cumulativePct,
      symbol: "circle",
      symbolSize: 11,
      lineStyle: { width: 3.5, color: t.palette[0] },
      itemStyle: { color: t.palette[0] },
      areaStyle: { color: t.palette[0], opacity: 0.06 },
      z: 3,
      markLine: {
        symbol: "none",
        silent: true,
        lineStyle: { type: "dashed", color: t.inkSoft, width: 1.5 },
        label: { color: t.inkSoft, fontSize: 15, position: "insideEndTop", formatter: "{b}" },
        data: [
          { yAxis: 90, name: "90% threshold" },
          { yAxis: 95, name: "95% threshold" },
        ],
      },
      markPoint: {
        symbol: "circle",
        symbolSize: 16,
        symbolOffset: [16, -16],
        itemStyle: { color: t.pageBg, borderColor: t.ink, borderWidth: 3 },
        label: {
          show: true,
          position: "top",
          distance: 14,
          color: t.ink,
          fontSize: 15,
          fontWeight: "bold",
          formatter: `Elbow (n=${elbowIdx + 1})`,
        },
        data: [{ coord: [elbowIdx, cumulativePct[elbowIdx]] }],
      },
    },
    {
      name: "Individual variance",
      type: "bar",
      data: individualPct,
      barWidth: "55%",
      itemStyle: { color: t.inkSoft, opacity: 0.35 },
      z: 1,
    },
  ],
});
Runnable source as JSON, for any HTTP client: https://api.anyplot.ai/specs/line-pca-variance-cumulative/echarts/code. Any spec id and library id listed in llms-full.txt fit the same URL shape; every URL below is complete and callable.
{
  "spec_id": "line-pca-variance-cumulative",
  "language": "javascript",
  "library": "echarts",
  "page": "https://anyplot.ai/line-pca-variance-cumulative/javascript/echarts",
  "hub": "https://anyplot.ai/line-pca-variance-cumulative",
  "code_json": "https://api.anyplot.ai/specs/line-pca-variance-cumulative/echarts/code",
  "spec_json": "https://api.anyplot.ai/specs/line-pca-variance-cumulative",
  "render_light_png": "https://storage.googleapis.com/anyplot-images/plots/line-pca-variance-cumulative/javascript/echarts/plot-light.png",
  "render_dark_png": "https://storage.googleapis.com/anyplot-images/plots/line-pca-variance-cumulative/javascript/echarts/plot-dark.png",
  "interactive_light_html": "https://storage.googleapis.com/anyplot-images/plots/line-pca-variance-cumulative/javascript/echarts/plot-light.html",
  "interactive_dark_html": "https://storage.googleapis.com/anyplot-images/plots/line-pca-variance-cumulative/javascript/echarts/plot-dark.html",
  "quality_score": 91.0,
  "license": "MIT",
  "guide": "https://anyplot.ai/llms.txt"
}
Part of Cumulative Explained Variance for PCA Component Selection on anyplot.ai.