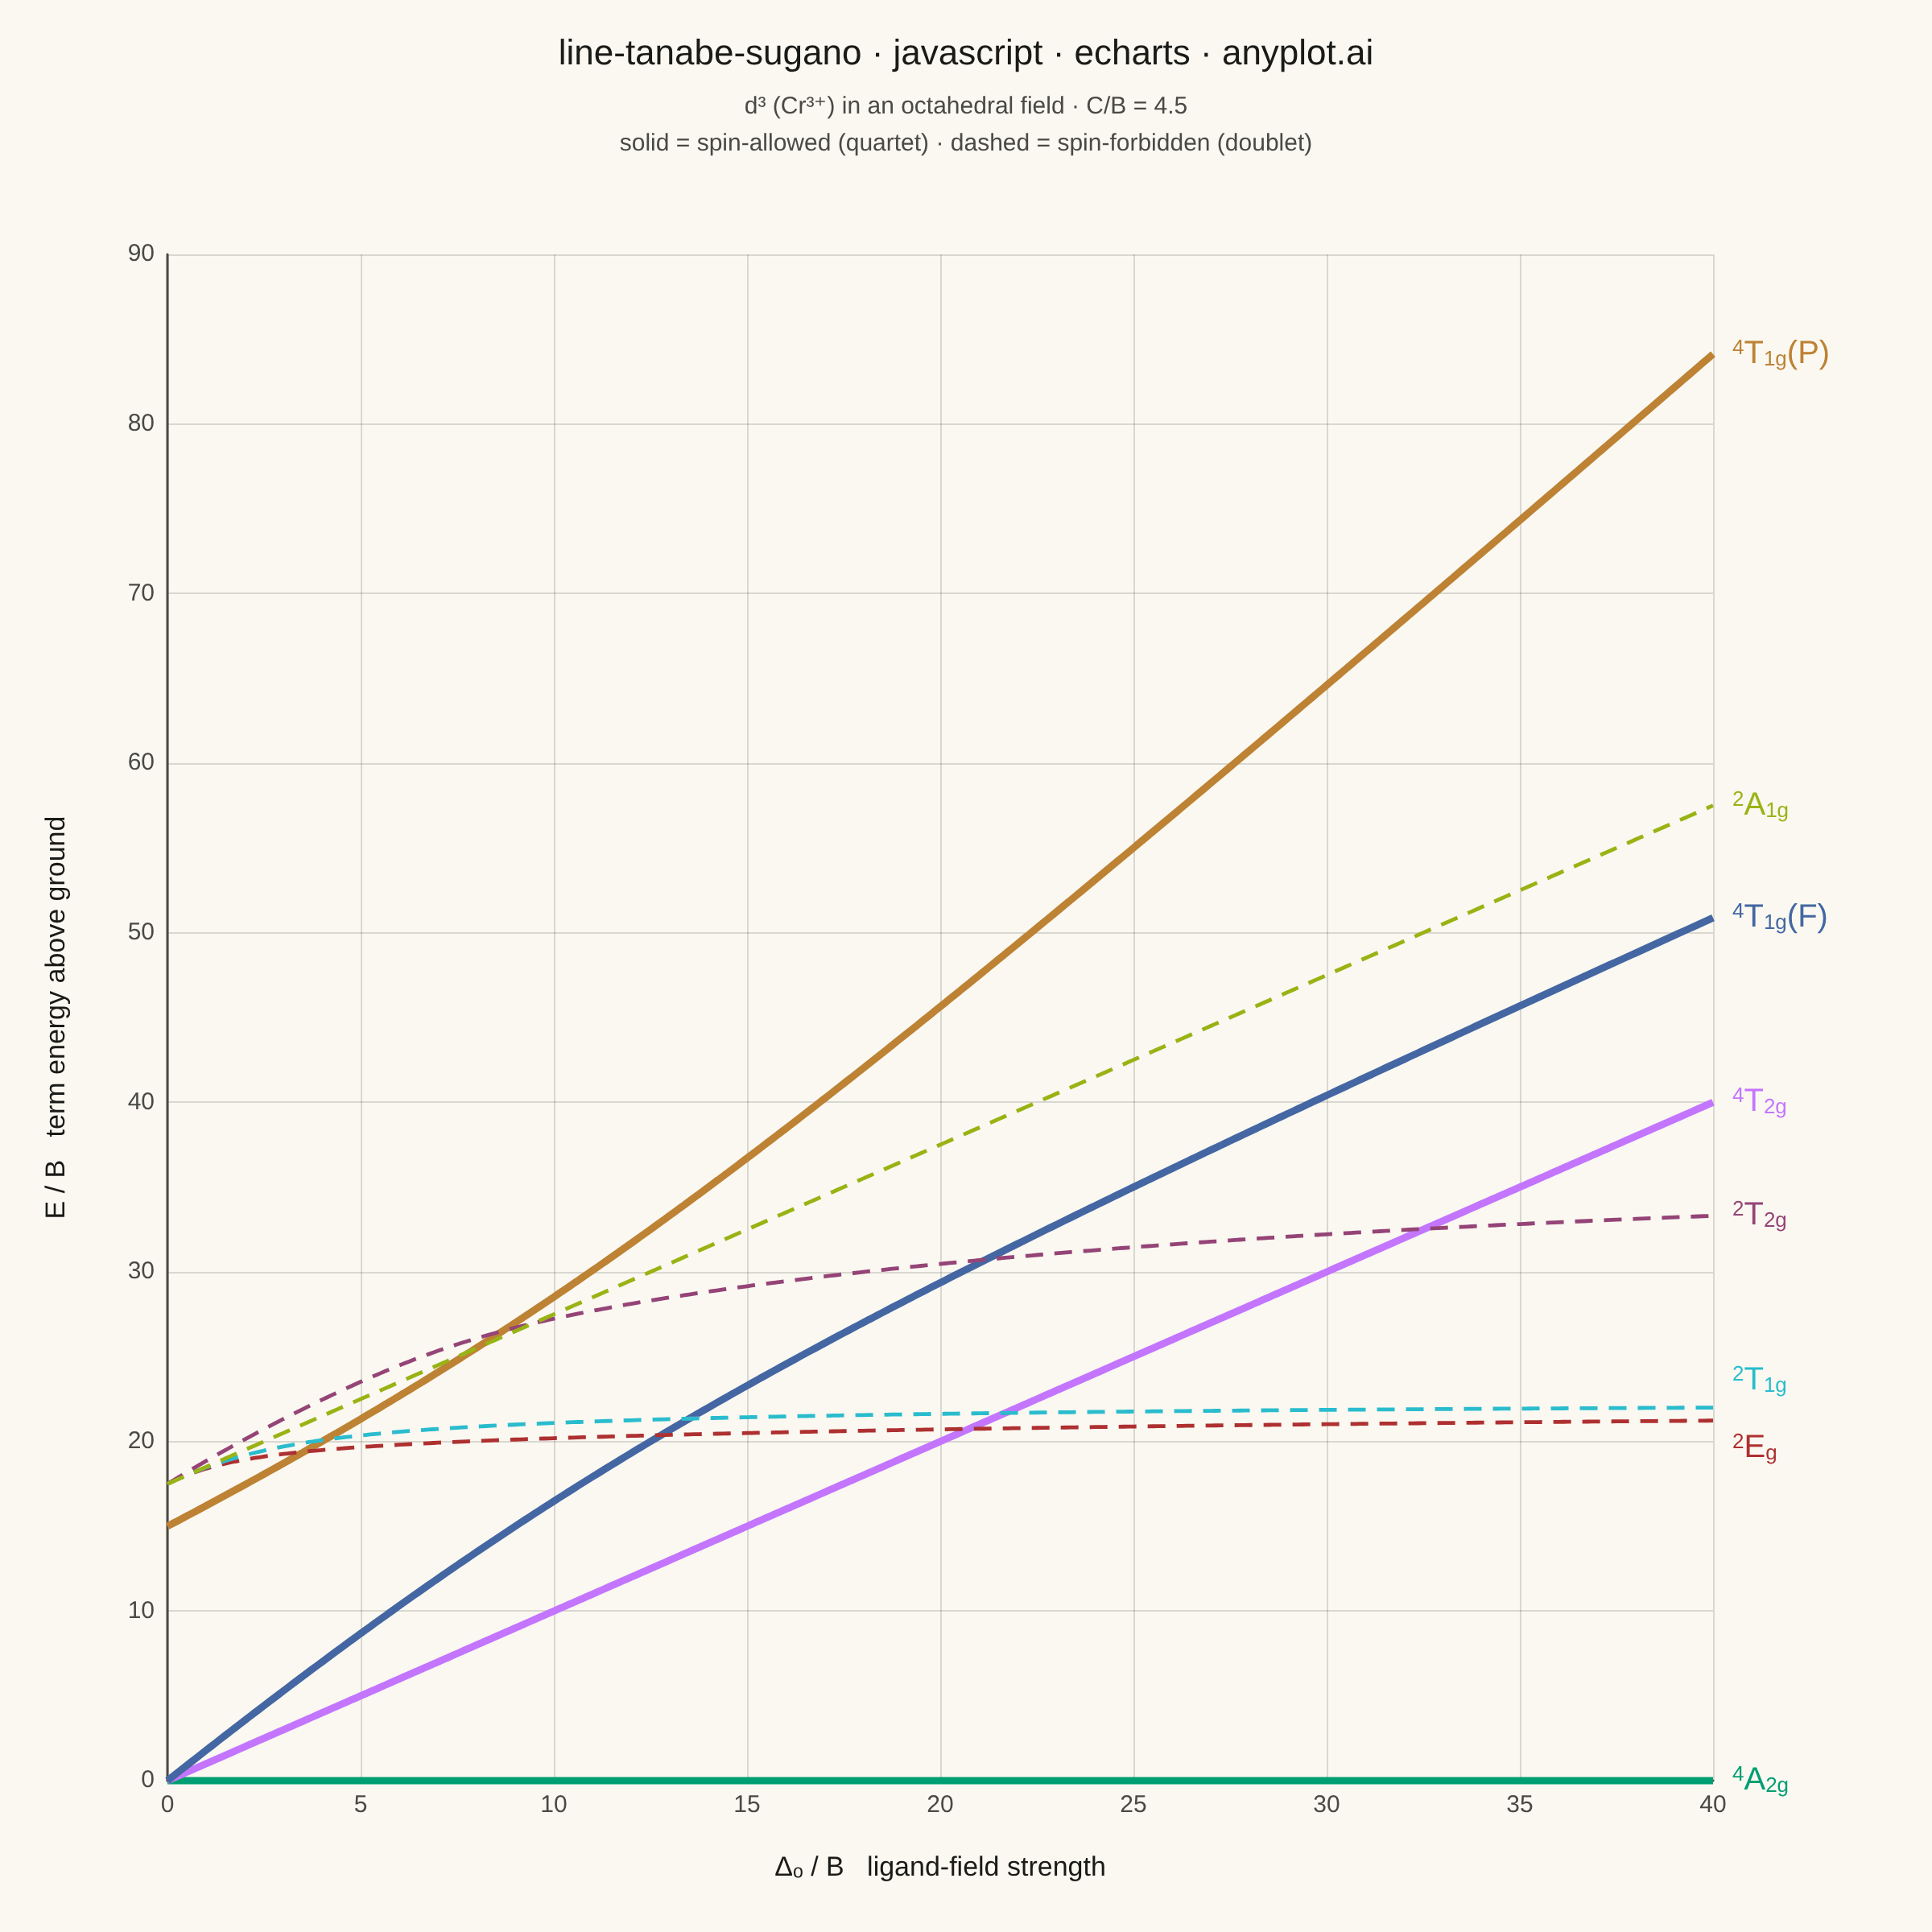
The same plot in 14 other libraries — JavaScript: Chart.js, D3.js, Highcharts, MUI X Charts; Python: Altair, Bokeh, lets-plot, Matplotlib, Plotly, plotnine, Pygal, Seaborn; R: ggplot2; Julia: Makie.jl. Compare all 15 side by side: Tanabe-Sugano Diagram for Crystal Field Theory in Python, R, Julia and JavaScript.
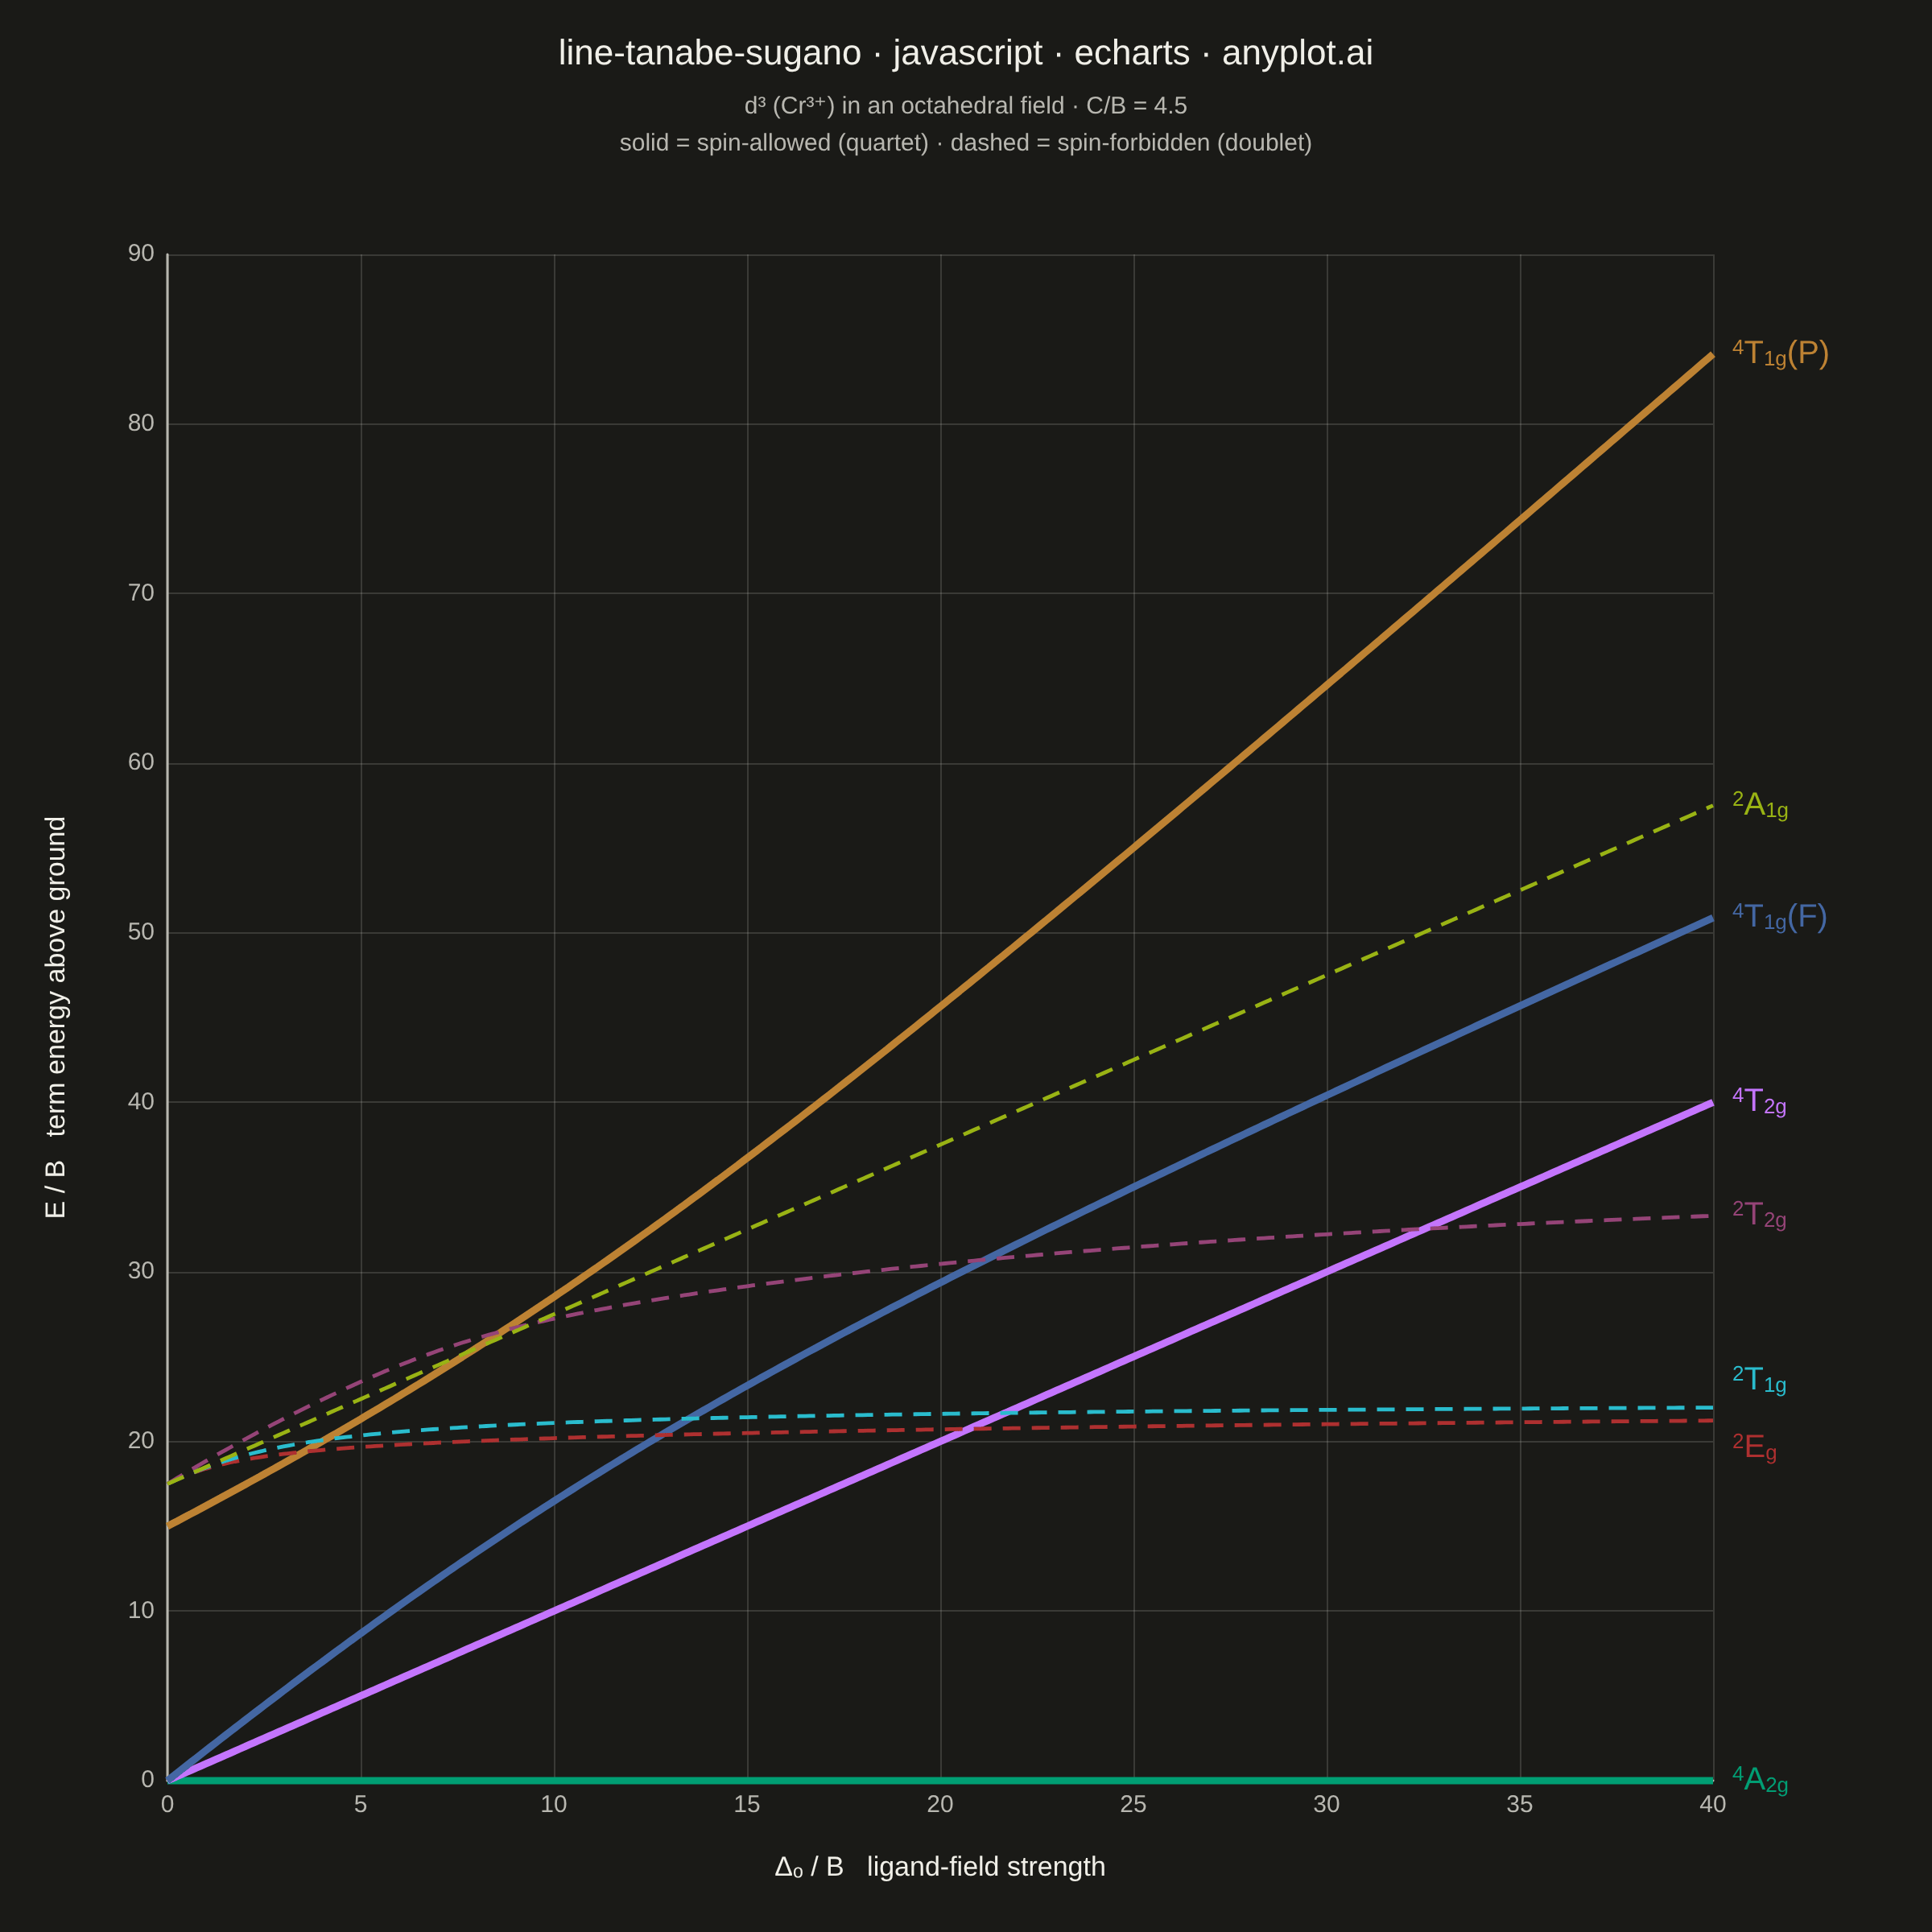
A Tanabe-Sugano diagram plots the energies of the electronic term states of a transition-metal ion in an octahedral ligand field as continuous functions of the field strength. The x-axis is the reduced ligand-field strength Δ_o/B (octahedral splitting divided by the Racah parameter B) and the y-axis is the reduced term energy E/B measured from the ground term, which therefore runs along the x-axis itself as a horizontal line at E/B = 0. Each term — labeled with its full symbol including spin multiplicity and Mulliken label — is one curve, and for d⁴–d⁷ a vertical line marks the high-spin/low-spin crossover where the ground term changes and every curve kinks. Chemists read the chart in reverse: matching ratios of observed UV-Vis band energies against the curves yields both Δ_o and B for a real complex.
// anyplot.ai
// line-tanabe-sugano: Tanabe-Sugano Diagram for Crystal Field Theory
// Library: echarts 6.1.0 | JavaScript 22.23.3
// Quality: 91/100 | Created: 2026-10-01
//# anyplot-orientation: square

const t = window.ANYPLOT_TOKENS;

// --- Data: d3 (Cr3+) term energies from the Tanabe-Sugano matrices ----------
// Energies are in units of the Racah parameter B, the field strength is
// Dq/B with the octahedral splitting delta_o = 10 Dq.

const B = 1;
const C = 4.5 * B; // C/B of the classic d3 diagram
const r2 = Math.SQRT2;
const r3 = Math.sqrt(3);

// Symmetric matrix from its diagonal plus the upper-triangle entries.
const symmetric = (diagonal, offDiagonal) => {
  const m = diagonal.map((d, i) => diagonal.map((_, j) => (i === j ? d : 0)));
  offDiagonal.forEach(([i, j, value]) => {
    m[i][j] = value;
    m[j][i] = value;
  });
  return m;
};

// Ascending eigenvalues by cyclic Jacobi rotation — the browser has no
// linear-algebra package, so the sweep is written out.
const eigenvalues = (matrix) => {
  const n = matrix.length;
  const a = matrix.map((row) => row.slice());
  for (let sweep = 0; sweep < 40; sweep += 1) {
    let offSquared = 0;
    for (let p = 0; p < n - 1; p += 1) {
      for (let q = p + 1; q < n; q += 1) offSquared += a[p][q] * a[p][q];
    }
    if (offSquared < 1e-20) break;
    for (let p = 0; p < n - 1; p += 1) {
      for (let q = p + 1; q < n; q += 1) {
        if (a[p][q] === 0) continue;
        const theta = (a[q][q] - a[p][p]) / (2 * a[p][q]);
        const tan =
          Math.sign(theta || 1) /
          (Math.abs(theta) + Math.sqrt(theta * theta + 1));
        const cos = 1 / Math.sqrt(tan * tan + 1);
        const sin = tan * cos;
        for (let k = 0; k < n; k += 1) {
          const kp = a[k][p];
          const kq = a[k][q];
          a[k][p] = cos * kp - sin * kq;
          a[k][q] = sin * kp + cos * kq;
        }
        for (let k = 0; k < n; k += 1) {
          const pk = a[p][k];
          const qk = a[q][k];
          a[p][k] = cos * pk - sin * qk;
          a[q][k] = sin * pk + cos * qk;
        }
      }
    }
  }
  return a.map((row, i) => row[i]).sort((x, y) => x - y);
};

// Term energies at one field strength, measured from the 4A2g ground term.
const termEnergies = (fieldStrength) => {
  const dq = fieldStrength / 10;
  const ground = -12 * dq - 15 * B; // t2g^3, 4A2g

  const quartetT1 = eigenvalues(
    symmetric([-2 * dq - 3 * B, 8 * dq - 12 * B], [[0, 1, 6 * B]]),
  );
  const doubletE = eigenvalues(
    symmetric(
      [
        -12 * dq - 6 * B + 3 * C,
        -2 * dq + 8 * B + 6 * C,
        -2 * dq - B + 3 * C,
        18 * dq - 8 * B + 4 * C,
      ],
      [
        [0, 1, -6 * r2 * B],
        [0, 2, -3 * r2 * B],
        [1, 2, 10 * B],
        [1, 3, r3 * (2 * B + C)],
        [2, 3, 2 * r3 * B],
      ],
    ),
  );
  const doubletT1 = eigenvalues(
    symmetric(
      [
        -12 * dq - 6 * B + 3 * C,
        -2 * dq + 3 * C,
        -2 * dq - 6 * B + 3 * C,
        8 * dq - 6 * B + 3 * C,
        8 * dq - 2 * B + 3 * C,
      ],
      [
        [0, 1, -3 * B],
        [0, 2, 3 * B],
        [0, 4, -2 * r3 * B],
        [1, 2, -3 * B],
        [1, 3, 3 * B],
        [1, 4, 3 * r3 * B],
        [2, 3, -3 * B],
        [2, 4, -r3 * B],
        [3, 4, 2 * r3 * B],
      ],
    ),
  );
  const doubletT2 = eigenvalues(
    symmetric(
      [
        -12 * dq + 5 * C,
        -2 * dq - 6 * B + 3 * C,
        -2 * dq + 4 * B + 3 * C,
        8 * dq + 6 * B + 5 * C,
        8 * dq - 2 * B + 3 * C,
      ],
      [
        [0, 1, -3 * r3 * B],
        [0, 2, -5 * r3 * B],
        [0, 3, 4 * B + 2 * C],
        [0, 4, 2 * B],
        [1, 2, 3 * B],
        [1, 3, -3 * r3 * B],
        [1, 4, -3 * r3 * B],
        [2, 3, -r3 * B],
        [2, 4, r3 * B],
        [3, 4, 10 * B],
      ],
    ),
  );

  return [
    0,
    -2 * dq - 15 * B - ground,
    quartetT1[0] - ground,
    quartetT1[1] - ground,
    doubletE[0] - ground,
    doubletT1[0] - ground,
    doubletT2[0] - ground,
    -2 * dq - 11 * B + 3 * C - ground,
  ];
};

// Spin-allowed terms share the quartet multiplicity of the 4A2g ground term.
const terms = [
  { sup: "4", core: "A", sub: "2g", tail: "", allowed: true, shift: 0 },
  { sup: "4", core: "T", sub: "2g", tail: "", allowed: true, shift: 0 },
  { sup: "4", core: "T", sub: "1g", tail: "(F)", allowed: true, shift: 0 },
  { sup: "4", core: "T", sub: "1g", tail: "(P)", allowed: true, shift: 0 },
  { sup: "2", core: "E", sub: "g", tail: "", allowed: false, shift: 17 },
  { sup: "2", core: "T", sub: "1g", tail: "", allowed: false, shift: -17 },
  { sup: "2", core: "T", sub: "2g", tail: "", allowed: false, shift: 0 },
  { sup: "2", core: "A", sub: "1g", tail: "", allowed: false, shift: 0 },
];

const samples = 321;
const curves = terms.map(() => []);
for (let i = 0; i < samples; i += 1) {
  const fieldStrength = (i * 40) / (samples - 1);
  termEnergies(fieldStrength).forEach((energy, k) =>
    curves[k].push([fieldStrength, energy]),
  );
}

// --- Plot -------------------------------------------------------------------
const chart = echarts.init(document.getElementById("container"));

const axis = {
  type: "value",
  nameLocation: "middle",
  nameTextStyle: { color: t.ink, fontSize: 17 },
  axisLabel: { color: t.inkSoft, fontSize: 15 },
  axisLine: { lineStyle: { color: t.inkSoft, width: 1.5 } },
  axisTick: { show: false },
  splitLine: { lineStyle: { color: t.grid, width: 1 } },
};

chart.setOption({
  animation: false,
  color: t.palette,
  backgroundColor: "transparent",
  title: {
    text: "line-tanabe-sugano · javascript · echarts · anyplot.ai",
    subtext:
      "d³ (Cr³⁺) in an octahedral field · C/B = 4.5\n" +
      "solid = spin-allowed (quartet) · dashed = spin-forbidden (doublet)",
    left: "center",
    top: 18,
    textStyle: { color: t.ink, fontSize: 22, fontWeight: 500 },
    subtextStyle: { color: t.inkSoft, fontSize: 15, lineHeight: 23 },
  },
  grid: { left: 104, right: 136, top: 158, bottom: 94 },
  xAxis: {
    ...axis,
    min: 0,
    max: 40,
    interval: 5,
    name: "Δₒ / B   ligand-field strength",
    nameGap: 46,
  },
  yAxis: {
    ...axis,
    min: 0,
    max: 90,
    interval: 10,
    name: "E / B   term energy above ground",
    nameGap: 60,
  },
  series: terms.map((term, i) => {
    const color = t.palette[i];
    return {
      type: "line",
      name: `${term.sup}${term.core}${term.sub}${term.tail}`,
      data: curves[i],
      showSymbol: false,
      clip: false,
      lineStyle: {
        color,
        width: term.allowed ? 4.5 : 2.4,
        type: term.allowed ? "solid" : [11, 7],
      },
      endLabel: {
        show: true,
        distance: 12,
        offset: [0, term.shift],
        color,
        fontSize: 20,
        formatter: `{s|${term.sup}}${term.core}{b|${term.sub}}${term.tail}`,
        rich: {
          s: { color, fontSize: 13, verticalAlign: "top" },
          b: { color, fontSize: 13, verticalAlign: "bottom" },
        },
      },
    };
  }),
});
Runnable source as JSON, for any HTTP client: https://api.anyplot.ai/specs/line-tanabe-sugano/echarts/code. Any spec id and library id listed in llms-full.txt fit the same URL shape; every URL below is complete and callable.
{
  "spec_id": "line-tanabe-sugano",
  "language": "javascript",
  "library": "echarts",
  "page": "https://anyplot.ai/line-tanabe-sugano/javascript/echarts",
  "hub": "https://anyplot.ai/line-tanabe-sugano",
  "code_json": "https://api.anyplot.ai/specs/line-tanabe-sugano/echarts/code",
  "spec_json": "https://api.anyplot.ai/specs/line-tanabe-sugano",
  "render_light_png": "https://storage.googleapis.com/anyplot-images/plots/line-tanabe-sugano/javascript/echarts/plot-light.png",
  "render_dark_png": "https://storage.googleapis.com/anyplot-images/plots/line-tanabe-sugano/javascript/echarts/plot-dark.png",
  "interactive_light_html": "https://storage.googleapis.com/anyplot-images/plots/line-tanabe-sugano/javascript/echarts/plot-light.html",
  "interactive_dark_html": "https://storage.googleapis.com/anyplot-images/plots/line-tanabe-sugano/javascript/echarts/plot-dark.html",
  "quality_score": 91.0,
  "license": "MIT",
  "guide": "https://anyplot.ai/llms.txt"
}
Part of Tanabe-Sugano Diagram for Crystal Field Theory on anyplot.ai.