The same plot in 14 other libraries — JavaScript: Chart.js, D3.js, Apache ECharts, MUI X Charts; Python: Altair, Bokeh, lets-plot, Matplotlib, Plotly, plotnine, Pygal, Seaborn; R: ggplot2; Julia: Makie.jl. Compare all 15 side by side: Tanabe-Sugano Diagram for Crystal Field Theory in Python, R, Julia and JavaScript.
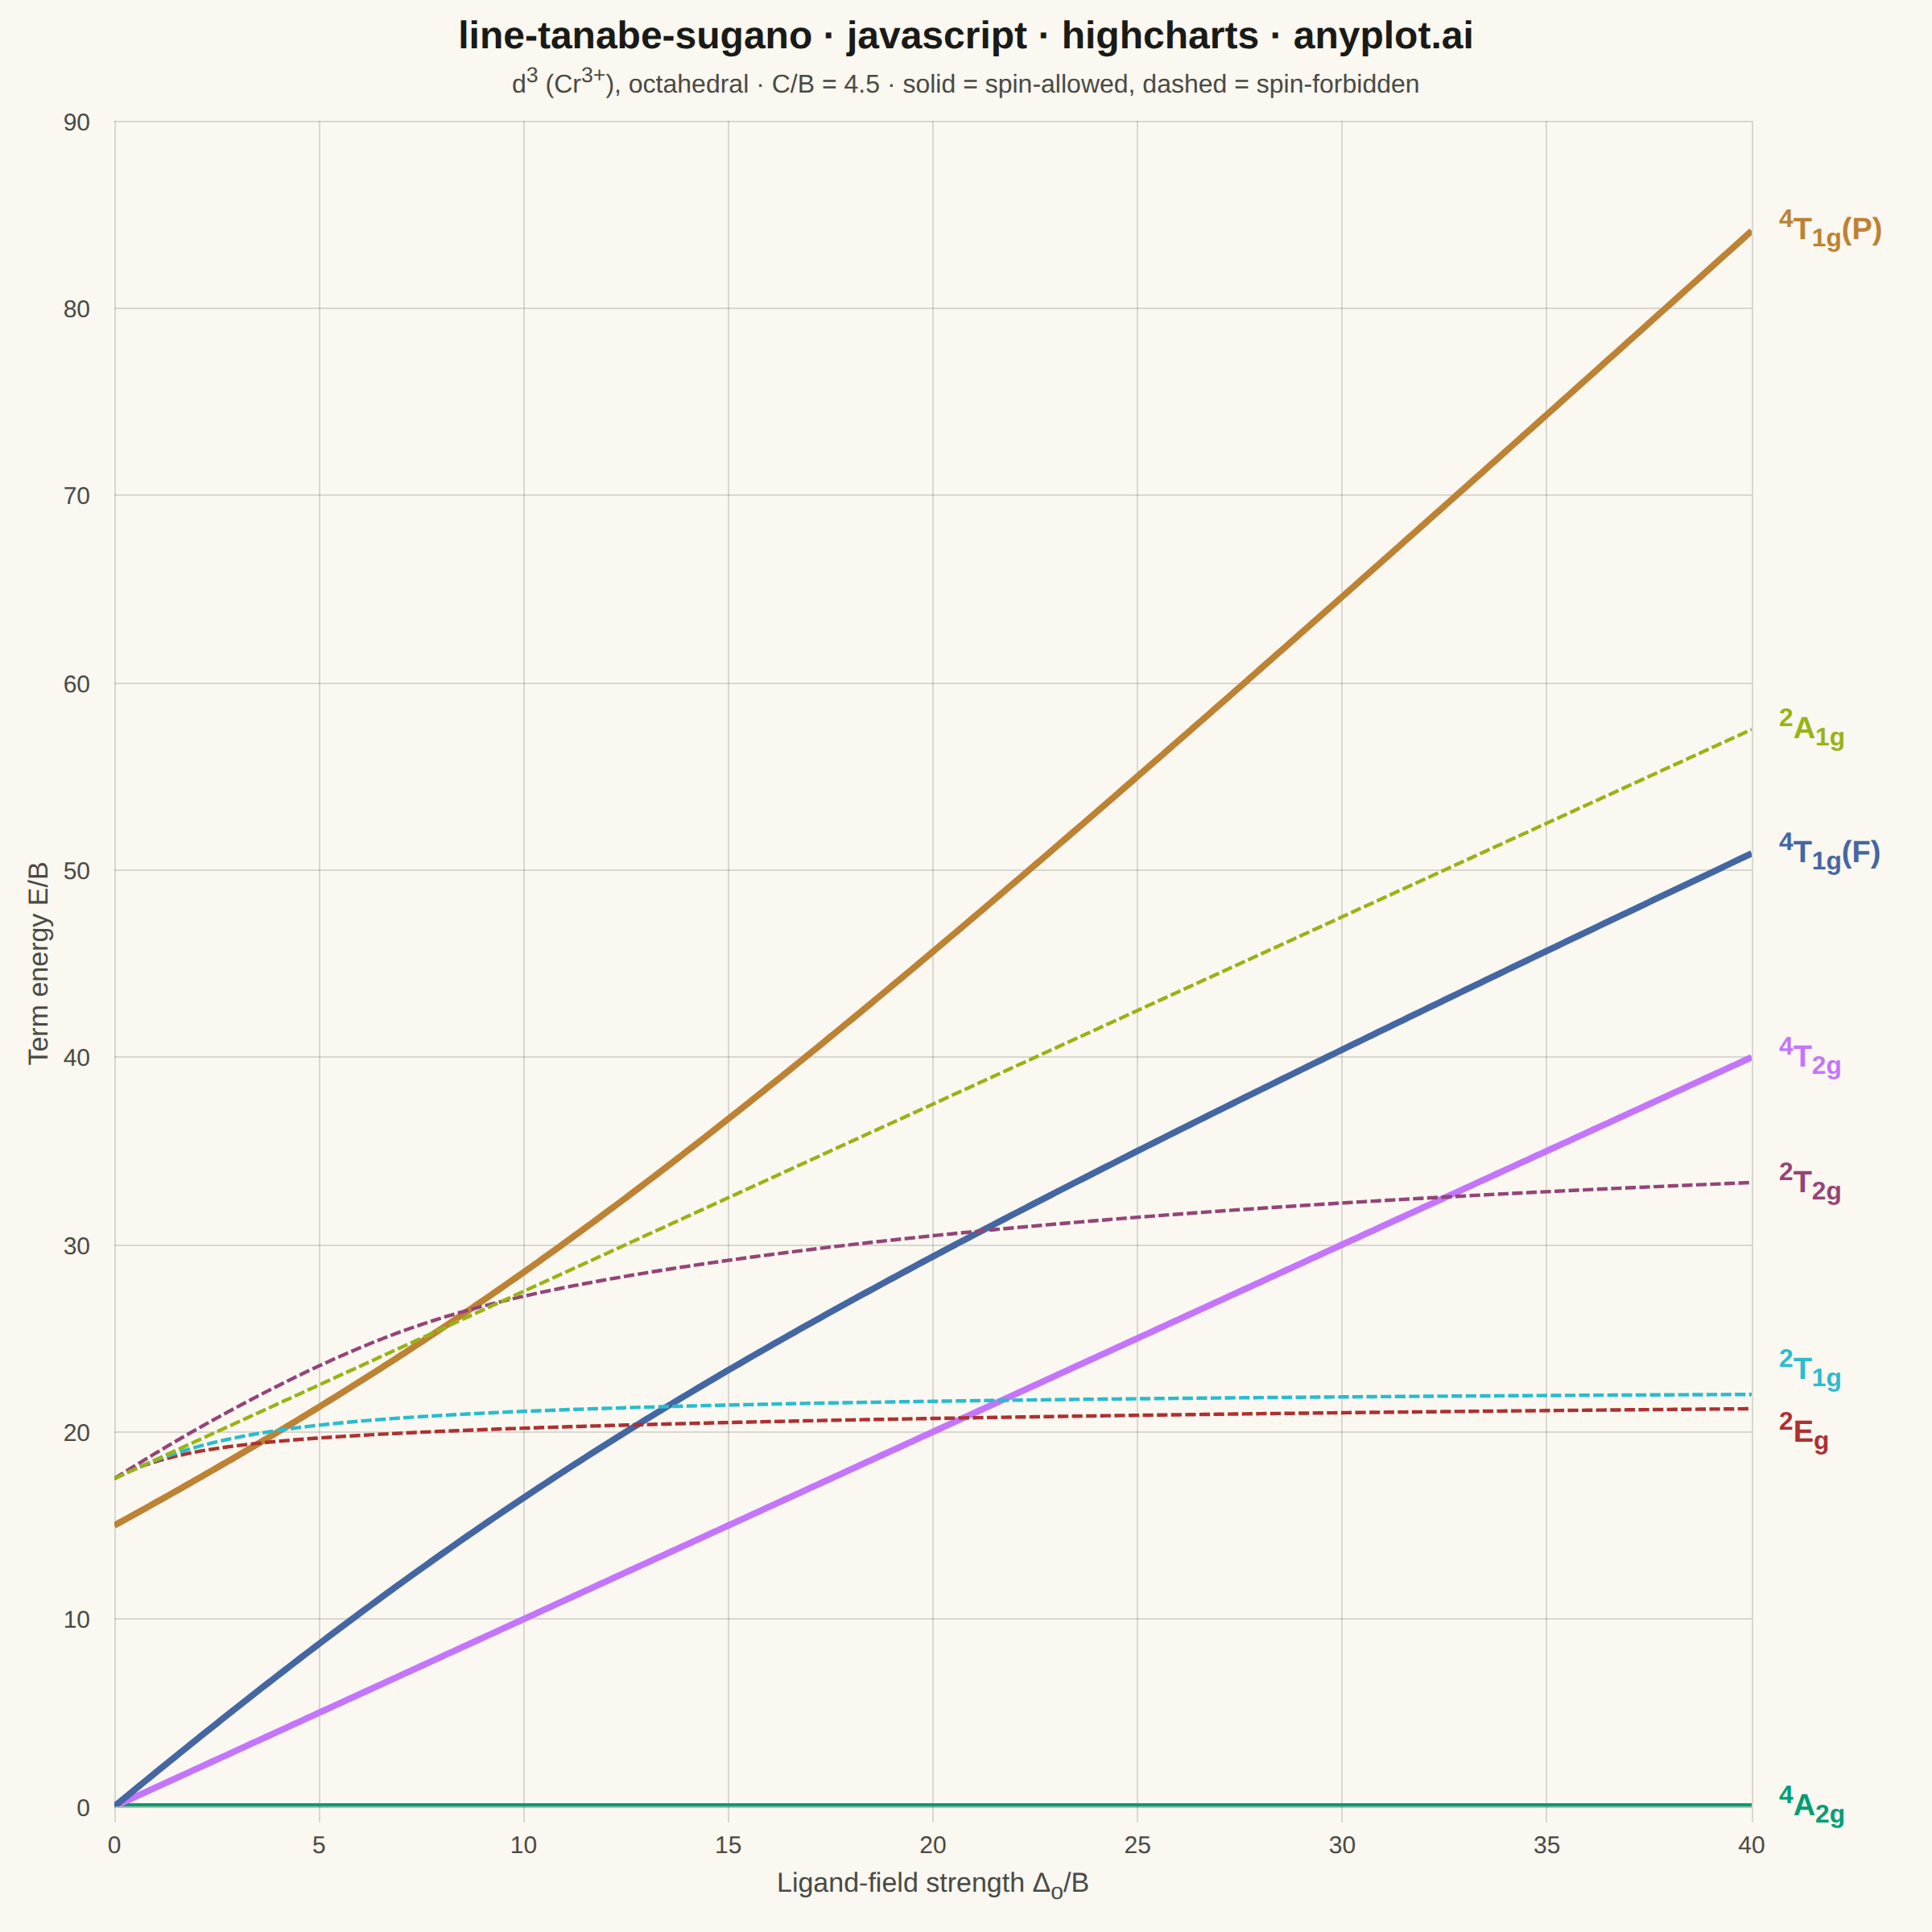
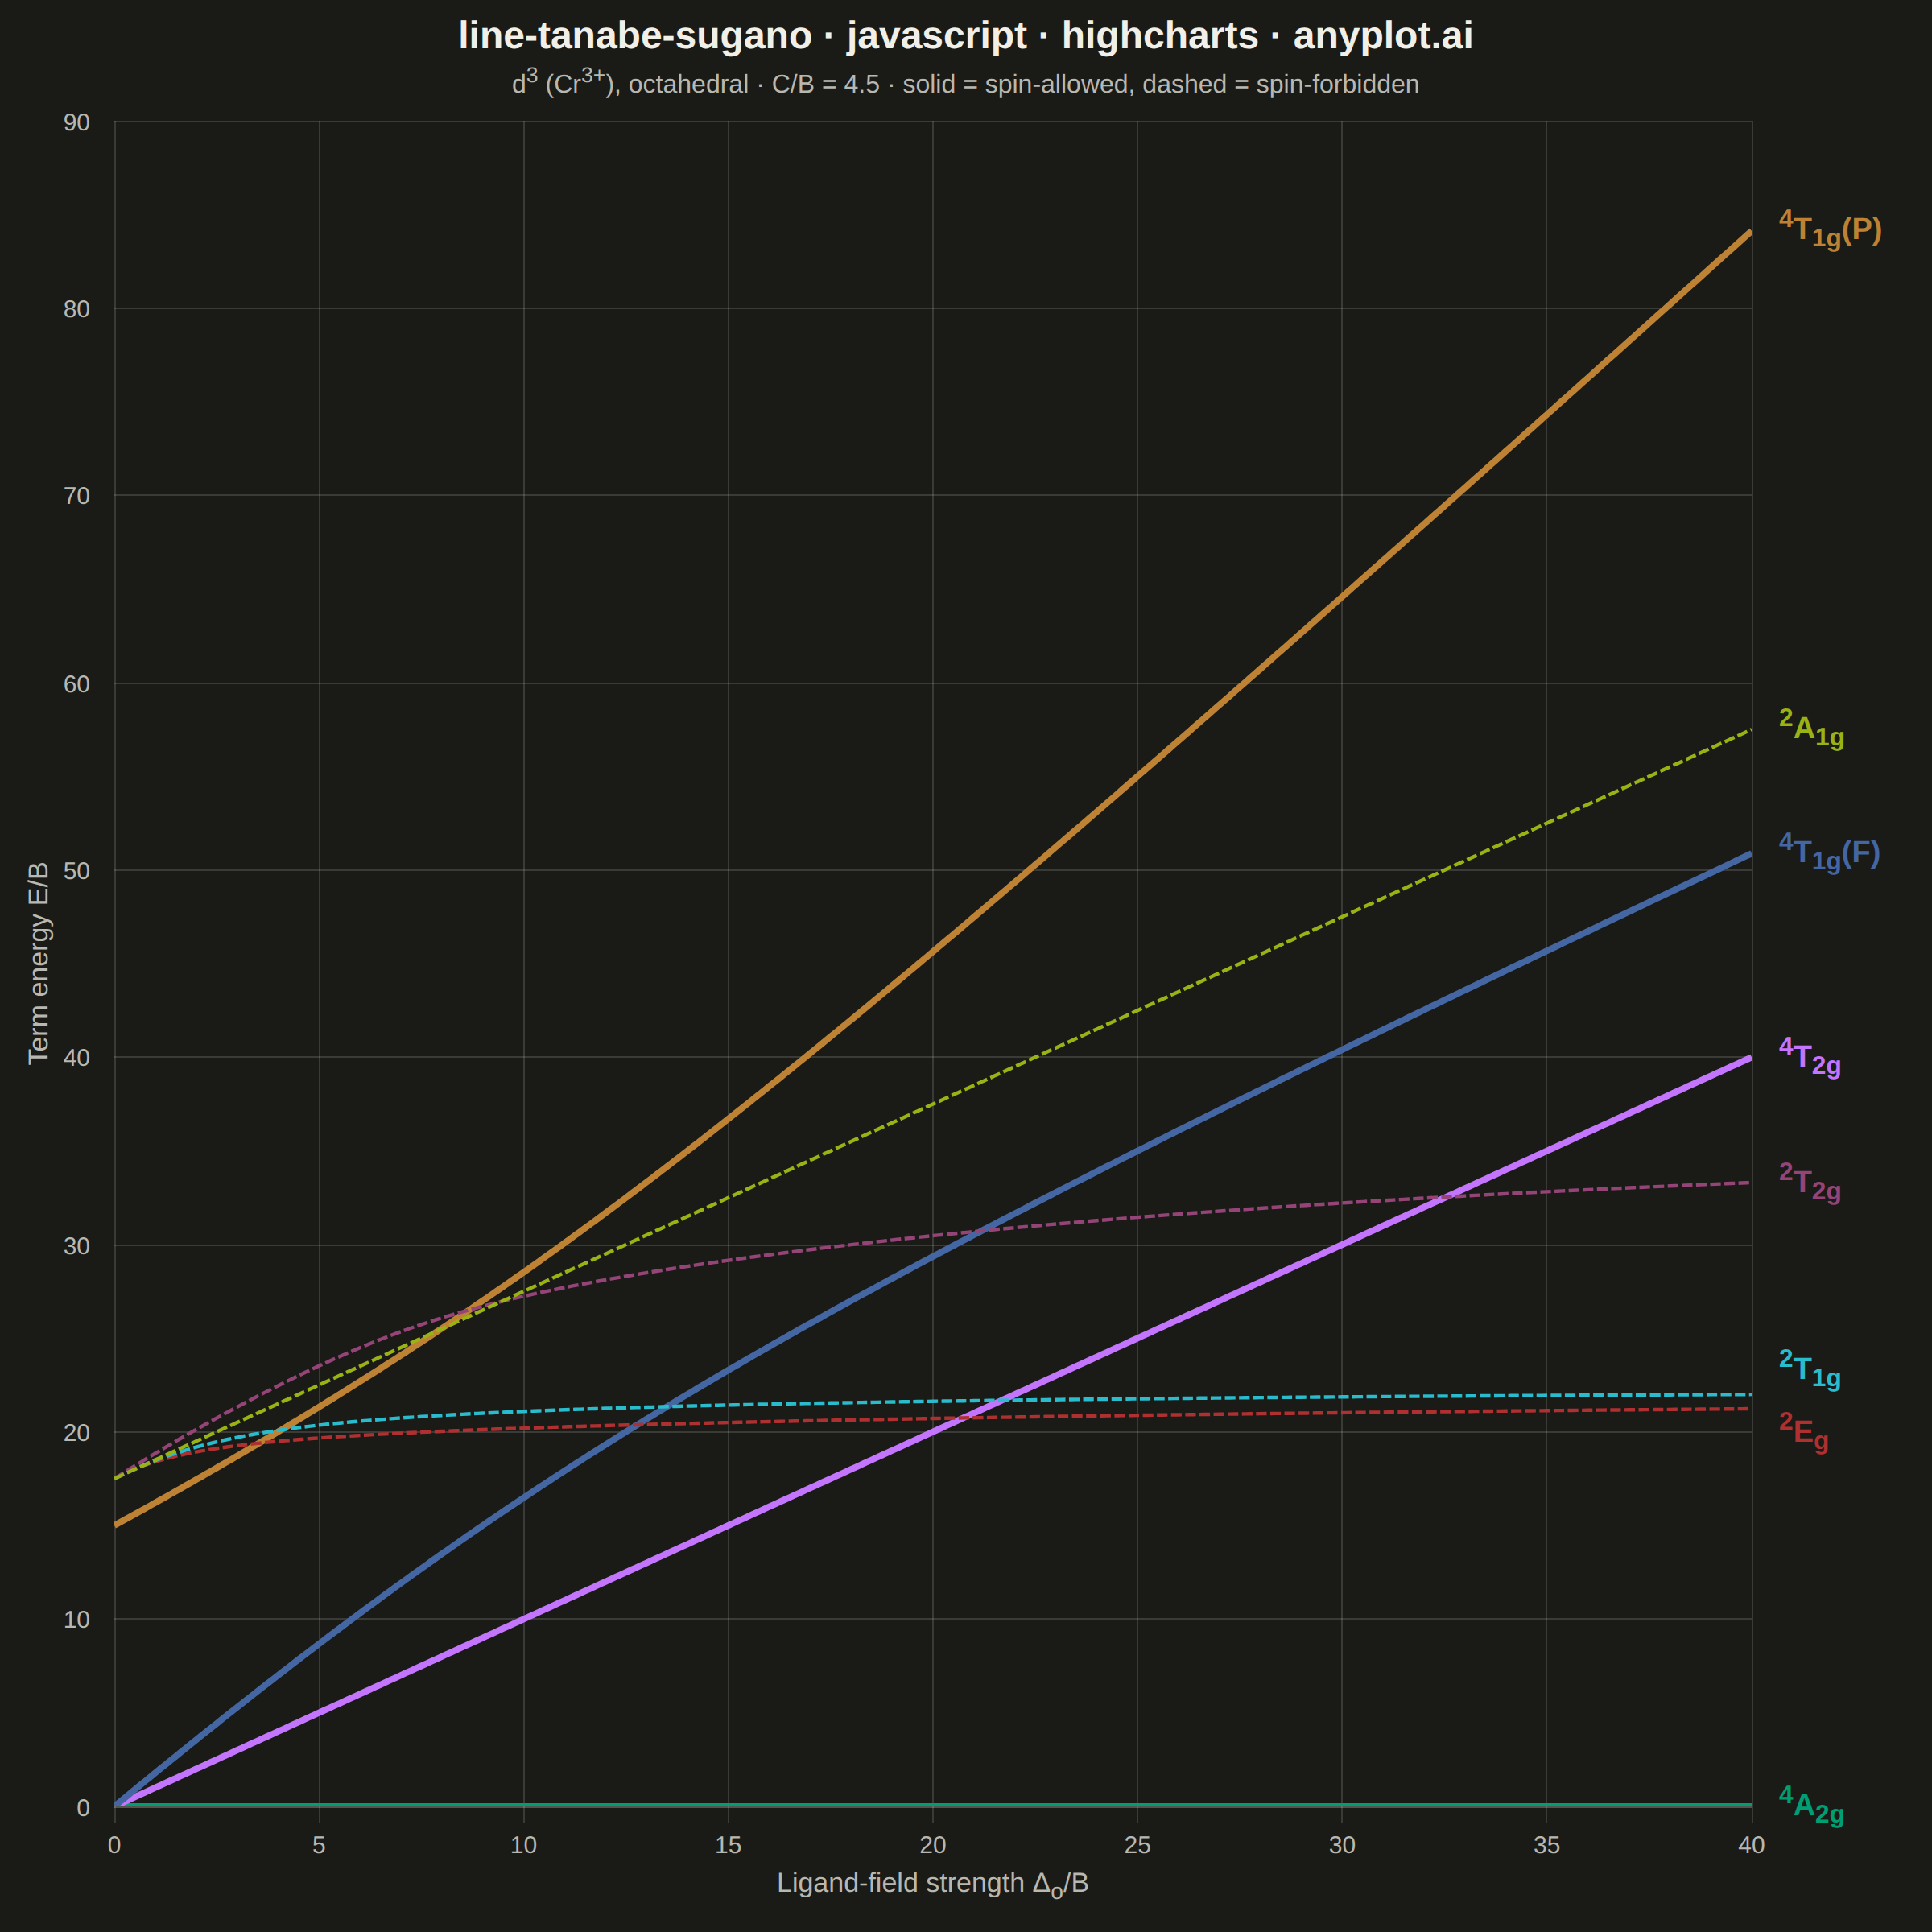
A Tanabe-Sugano diagram plots the energies of the electronic term states of a transition-metal ion in an octahedral ligand field as continuous functions of the field strength. The x-axis is the reduced ligand-field strength Δ_o/B (octahedral splitting divided by the Racah parameter B) and the y-axis is the reduced term energy E/B measured from the ground term, which therefore runs along the x-axis itself as a horizontal line at E/B = 0. Each term — labeled with its full symbol including spin multiplicity and Mulliken label — is one curve, and for d⁴–d⁷ a vertical line marks the high-spin/low-spin crossover where the ground term changes and every curve kinks. Chemists read the chart in reverse: matching ratios of observed UV-Vis band energies against the curves yields both Δ_o and B for a real complex.
// anyplot.ai
// line-tanabe-sugano: Tanabe-Sugano Diagram for Crystal Field Theory
// Library: highcharts 12.6.0 | JavaScript 22.23.3
// Quality: 92/100 | Created: 2026-10-01

//# anyplot-orientation: square

const t = window.ANYPLOT_TOKENS;

// --- Eigenvalues of a symmetric matrix (cyclic Jacobi rotations) ------------
// The core Highcharts bundle ships no linear algebra, and the term energies are
// the eigenvalues of the Tanabe-Sugano matrices, so a short solver is needed.
const eigenvalues = (matrix) => {
    const n = matrix.length;
    const a = matrix.map((row) => row.slice());

    for (let sweep = 0; sweep < 40; sweep++) {
        let offDiagonal = 0;
        for (let p = 0; p < n; p++) {
            for (let q = p + 1; q < n; q++) offDiagonal += a[p][q] * a[p][q];
        }
        if (offDiagonal < 1e-20) break;

        for (let p = 0; p < n; p++) {
            for (let q = p + 1; q < n; q++) {
                if (a[p][q] === 0) continue;
                const angle = 0.5 * Math.atan2(2 * a[p][q], a[q][q] - a[p][p]);
                const cos = Math.cos(angle);
                const sin = Math.sin(angle);
                for (let k = 0; k < n; k++) {
                    const kp = a[k][p];
                    const kq = a[k][q];
                    a[k][p] = cos * kp - sin * kq;
                    a[k][q] = sin * kp + cos * kq;
                }
                for (let k = 0; k < n; k++) {
                    const pk = a[p][k];
                    const qk = a[q][k];
                    a[p][k] = cos * pk - sin * qk;
                    a[q][k] = sin * pk + cos * qk;
                }
            }
        }
    }
    return a.map((row, i) => row[i]).sort((x, y) => x - y);
};

// --- Data: d³ (Cr³⁺) term energies from the Tanabe-Sugano matrices ----------
// Energies are in units of the Racah parameter B (so B = 1 and the Racah A,
// taken as constant, drops out); the Racah C/B ratio is the usual textbook 4.5.
// Each block is the strong-field matrix over the t₂³ / t₂²e / t₂e² / e³ basis
// states of that symmetry; diagonalizing it keeps same-symmetry terms as
// avoided crossings instead of letting them cross.
const C = 4.5;
const SQRT2 = Math.SQRT2;
const SQRT3 = Math.sqrt(3);

const termEnergies = (dq) => {
    const groundTerm = -12 * dq - 15; // ⁴A₂g(t₂³) — the energy zero of the chart

    const quartetT1 = eigenvalues([
        [-2 * dq - 3, 6],
        [6, 8 * dq - 12],
    ]);
    const doubletE = eigenvalues([
        [-12 * dq - 6 + 3 * C, -6 * SQRT2, -3 * SQRT2, 0],
        [-6 * SQRT2, -2 * dq + 8 + 6 * C, 10, SQRT3 * (2 + C)],
        [-3 * SQRT2, 10, -2 * dq - 1 + 3 * C, 2 * SQRT3],
        [0, SQRT3 * (2 + C), 2 * SQRT3, 18 * dq - 8 + 4 * C],
    ]);
    const doubletT1 = eigenvalues([
        [-12 * dq - 6 + 3 * C, -3, 3, 0, -2 * SQRT3],
        [-3, -2 * dq + 3 * C, -3, 3, 3 * SQRT3],
        [3, -3, -2 * dq - 6 + 3 * C, -3, -SQRT3],
        [0, 3, -3, 8 * dq - 6 + 3 * C, 2 * SQRT3],
        [-2 * SQRT3, 3 * SQRT3, -SQRT3, 2 * SQRT3, 8 * dq - 2 + 3 * C],
    ]);
    const doubletT2 = eigenvalues([
        [-12 * dq + 5 * C, -3 * SQRT3, -5 * SQRT3, 4 + 2 * C, 2],
        [-3 * SQRT3, -2 * dq - 6 + 3 * C, 3, -3 * SQRT3, -3 * SQRT3],
        [-5 * SQRT3, 3, -2 * dq + 4 + 3 * C, -SQRT3, SQRT3],
        [4 + 2 * C, -3 * SQRT3, -SQRT3, 8 * dq + 6 + 5 * C, 10],
        [2, -3 * SQRT3, SQRT3, 10, 8 * dq - 2 + 3 * C],
    ]);

    return {
        quartetA2: 0,
        quartetT2: -2 * dq - 15 - groundTerm,
        quartetT1F: quartetT1[0] - groundTerm,
        quartetT1P: quartetT1[1] - groundTerm,
        doubletE: doubletE[0] - groundTerm,
        doubletT1: doubletT1[0] - groundTerm,
        doubletT2: doubletT2[0] - groundTerm,
        doubletA1: -2 * dq - 11 + 3 * C - groundTerm,
    };
};

// Imprint palette order; spin-allowed = the ⁴A₂g ground term's multiplicity.
// labelShift nudges the two labels apart where ²Eg and ²T₁g nearly coincide.
const terms = [
    { key: "quartetA2", symbol: "<sup>4</sup>A<sub>2g</sub>", spinAllowed: true, labelShift: 0 },
    { key: "quartetT2", symbol: "<sup>4</sup>T<sub>2g</sub>", spinAllowed: true, labelShift: 0 },
    { key: "quartetT1F", symbol: "<sup>4</sup>T<sub>1g</sub>(F)", spinAllowed: true, labelShift: 0 },
    { key: "quartetT1P", symbol: "<sup>4</sup>T<sub>1g</sub>(P)", spinAllowed: true, labelShift: 0 },
    { key: "doubletE", symbol: "<sup>2</sup>E<sub>g</sub>", spinAllowed: false, labelShift: 15 },
    { key: "doubletT1", symbol: "<sup>2</sup>T<sub>1g</sub>", spinAllowed: false, labelShift: -15 },
    { key: "doubletT2", symbol: "<sup>2</sup>T<sub>2g</sub>", spinAllowed: false, labelShift: 0 },
    { key: "doubletA1", symbol: "<sup>2</sup>A<sub>1g</sub>", spinAllowed: false, labelShift: 0 },
];

const curves = new Map(terms.map((term) => [term.key, []]));
for (let fieldStrength = 0; fieldStrength <= 40; fieldStrength += 0.125) {
    const energies = termEnergies(fieldStrength / 10); // Δ_o/B = 10 Dq/B
    for (const term of terms) curves.get(term.key).push([fieldStrength, energies[term.key]]);
}

// --- Chart -----------------------------------------------------------------
Highcharts.chart("container", {
    chart: {
        type: "line",
        backgroundColor: "transparent",
        animation: false,
        marginRight: 112, // room for the term labels past the right edge
        spacingBottom: 18,
        style: { fontFamily: "inherit" },
    },
    credits: { enabled: false },
    colors: t.palette,
    title: {
        text: "line-tanabe-sugano · javascript · highcharts · anyplot.ai",
        style: { color: t.ink, fontSize: "24px", fontWeight: "600" },
    },
    subtitle: {
        useHTML: true,
        text:
            "d<sup>3</sup> (Cr<sup>3+</sup>), octahedral · C/B = 4.5 · " +
            "solid = spin-allowed, dashed = spin-forbidden",
        style: { color: t.inkSoft, fontSize: "16px" },
    },
    xAxis: {
        min: 0,
        max: 40,
        tickInterval: 5,
        lineColor: t.grid,
        tickColor: t.grid,
        gridLineWidth: 1,
        gridLineColor: t.grid,
        labels: { style: { color: t.inkSoft, fontSize: "15px" } },
        title: {
            useHTML: true,
            text: "Ligand-field strength Δ<sub>o</sub>/B",
            style: { color: t.inkSoft, fontSize: "17px" },
        },
    },
    yAxis: {
        min: 0,
        max: 90,
        tickInterval: 10,
        lineWidth: 0,
        gridLineColor: t.grid,
        labels: { style: { color: t.inkSoft, fontSize: "15px" } },
        title: {
            text: "Term energy E/B",
            style: { color: t.inkSoft, fontSize: "17px" },
        },
    },
    legend: { enabled: false },
    tooltip: {
        useHTML: true,
        headerFormat: "",
        pointFormat:
            "<b>{series.name}</b><br>Δ<sub>o</sub>/B {point.x:.1f} · E/B {point.y:.1f}",
        backgroundColor: t.elevatedBg,
        borderColor: t.grid,
        style: { color: t.ink, fontSize: "14px" },
    },
    plotOptions: {
        series: {
            animation: false,
            marker: { enabled: false },
            states: { inactive: { opacity: 1 } },
        },
    },
    series: terms.map((term, index) => {
        const curve = curves.get(term.key);
        const rightEdge = curve[curve.length - 1];
        return {
            name: term.symbol,
            lineWidth: term.spinAllowed ? 4 : 2.2,
            dashStyle: term.spinAllowed ? "Solid" : "ShortDash",
            data: [
                ...curve.slice(0, -1),
                {
                    x: rightEdge[0],
                    y: rightEdge[1],
                    dataLabels: {
                        enabled: true,
                        useHTML: true,
                        format: "{series.name}",
                        align: "left",
                        verticalAlign: "middle",
                        x: 12,
                        y: term.labelShift,
                        crop: false,
                        overflow: "allow",
                        style: {
                            color: t.palette[index],
                            fontSize: "19px",
                            fontWeight: "600",
                            textOutline: "none",
                        },
                    },
                },
            ],
        };
    }),
});
Runnable source as JSON, for any HTTP client: https://api.anyplot.ai/specs/line-tanabe-sugano/highcharts/code. Any spec id and library id listed in llms-full.txt fit the same URL shape; every URL below is complete and callable.
{
  "spec_id": "line-tanabe-sugano",
  "language": "javascript",
  "library": "highcharts",
  "page": "https://anyplot.ai/line-tanabe-sugano/javascript/highcharts",
  "hub": "https://anyplot.ai/line-tanabe-sugano",
  "code_json": "https://api.anyplot.ai/specs/line-tanabe-sugano/highcharts/code",
  "spec_json": "https://api.anyplot.ai/specs/line-tanabe-sugano",
  "render_light_png": "https://storage.googleapis.com/anyplot-images/plots/line-tanabe-sugano/javascript/highcharts/plot-light.png",
  "render_dark_png": "https://storage.googleapis.com/anyplot-images/plots/line-tanabe-sugano/javascript/highcharts/plot-dark.png",
  "interactive_light_html": "https://storage.googleapis.com/anyplot-images/plots/line-tanabe-sugano/javascript/highcharts/plot-light.html",
  "interactive_dark_html": "https://storage.googleapis.com/anyplot-images/plots/line-tanabe-sugano/javascript/highcharts/plot-dark.html",
  "quality_score": 92.0,
  "license": "MIT",
  "guide": "https://anyplot.ai/llms.txt"
}
Part of Tanabe-Sugano Diagram for Crystal Field Theory on anyplot.ai.