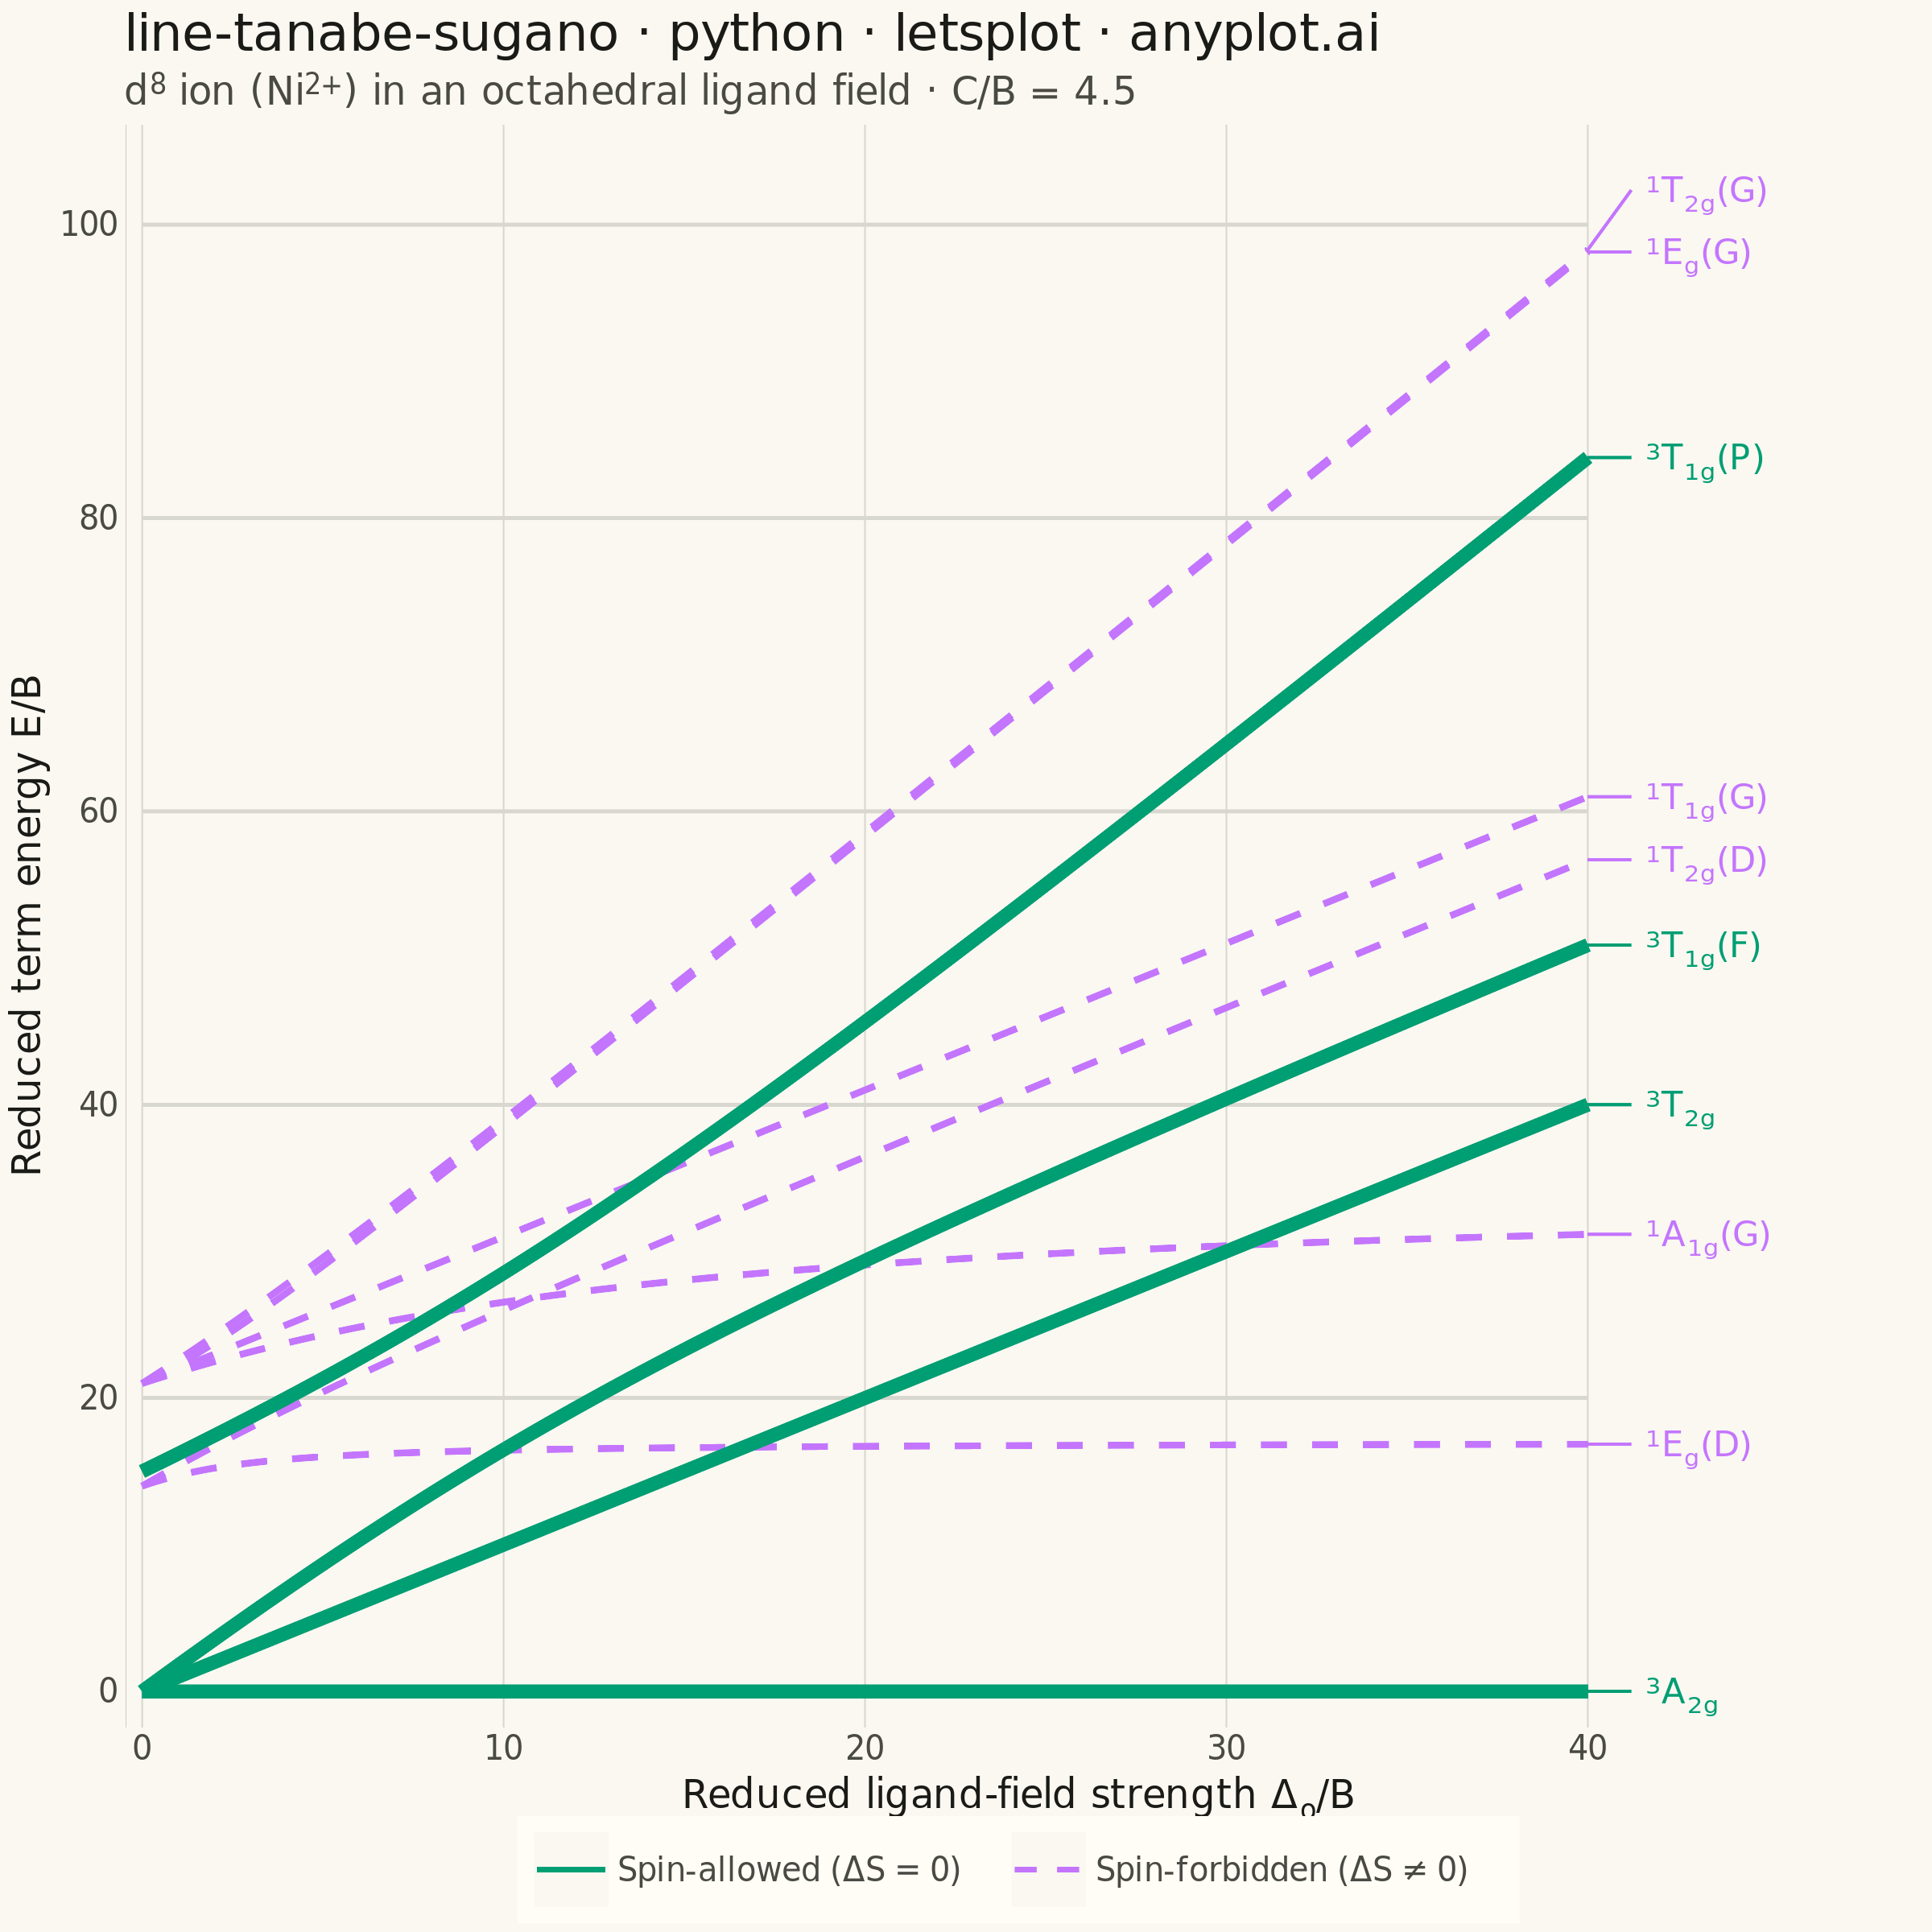
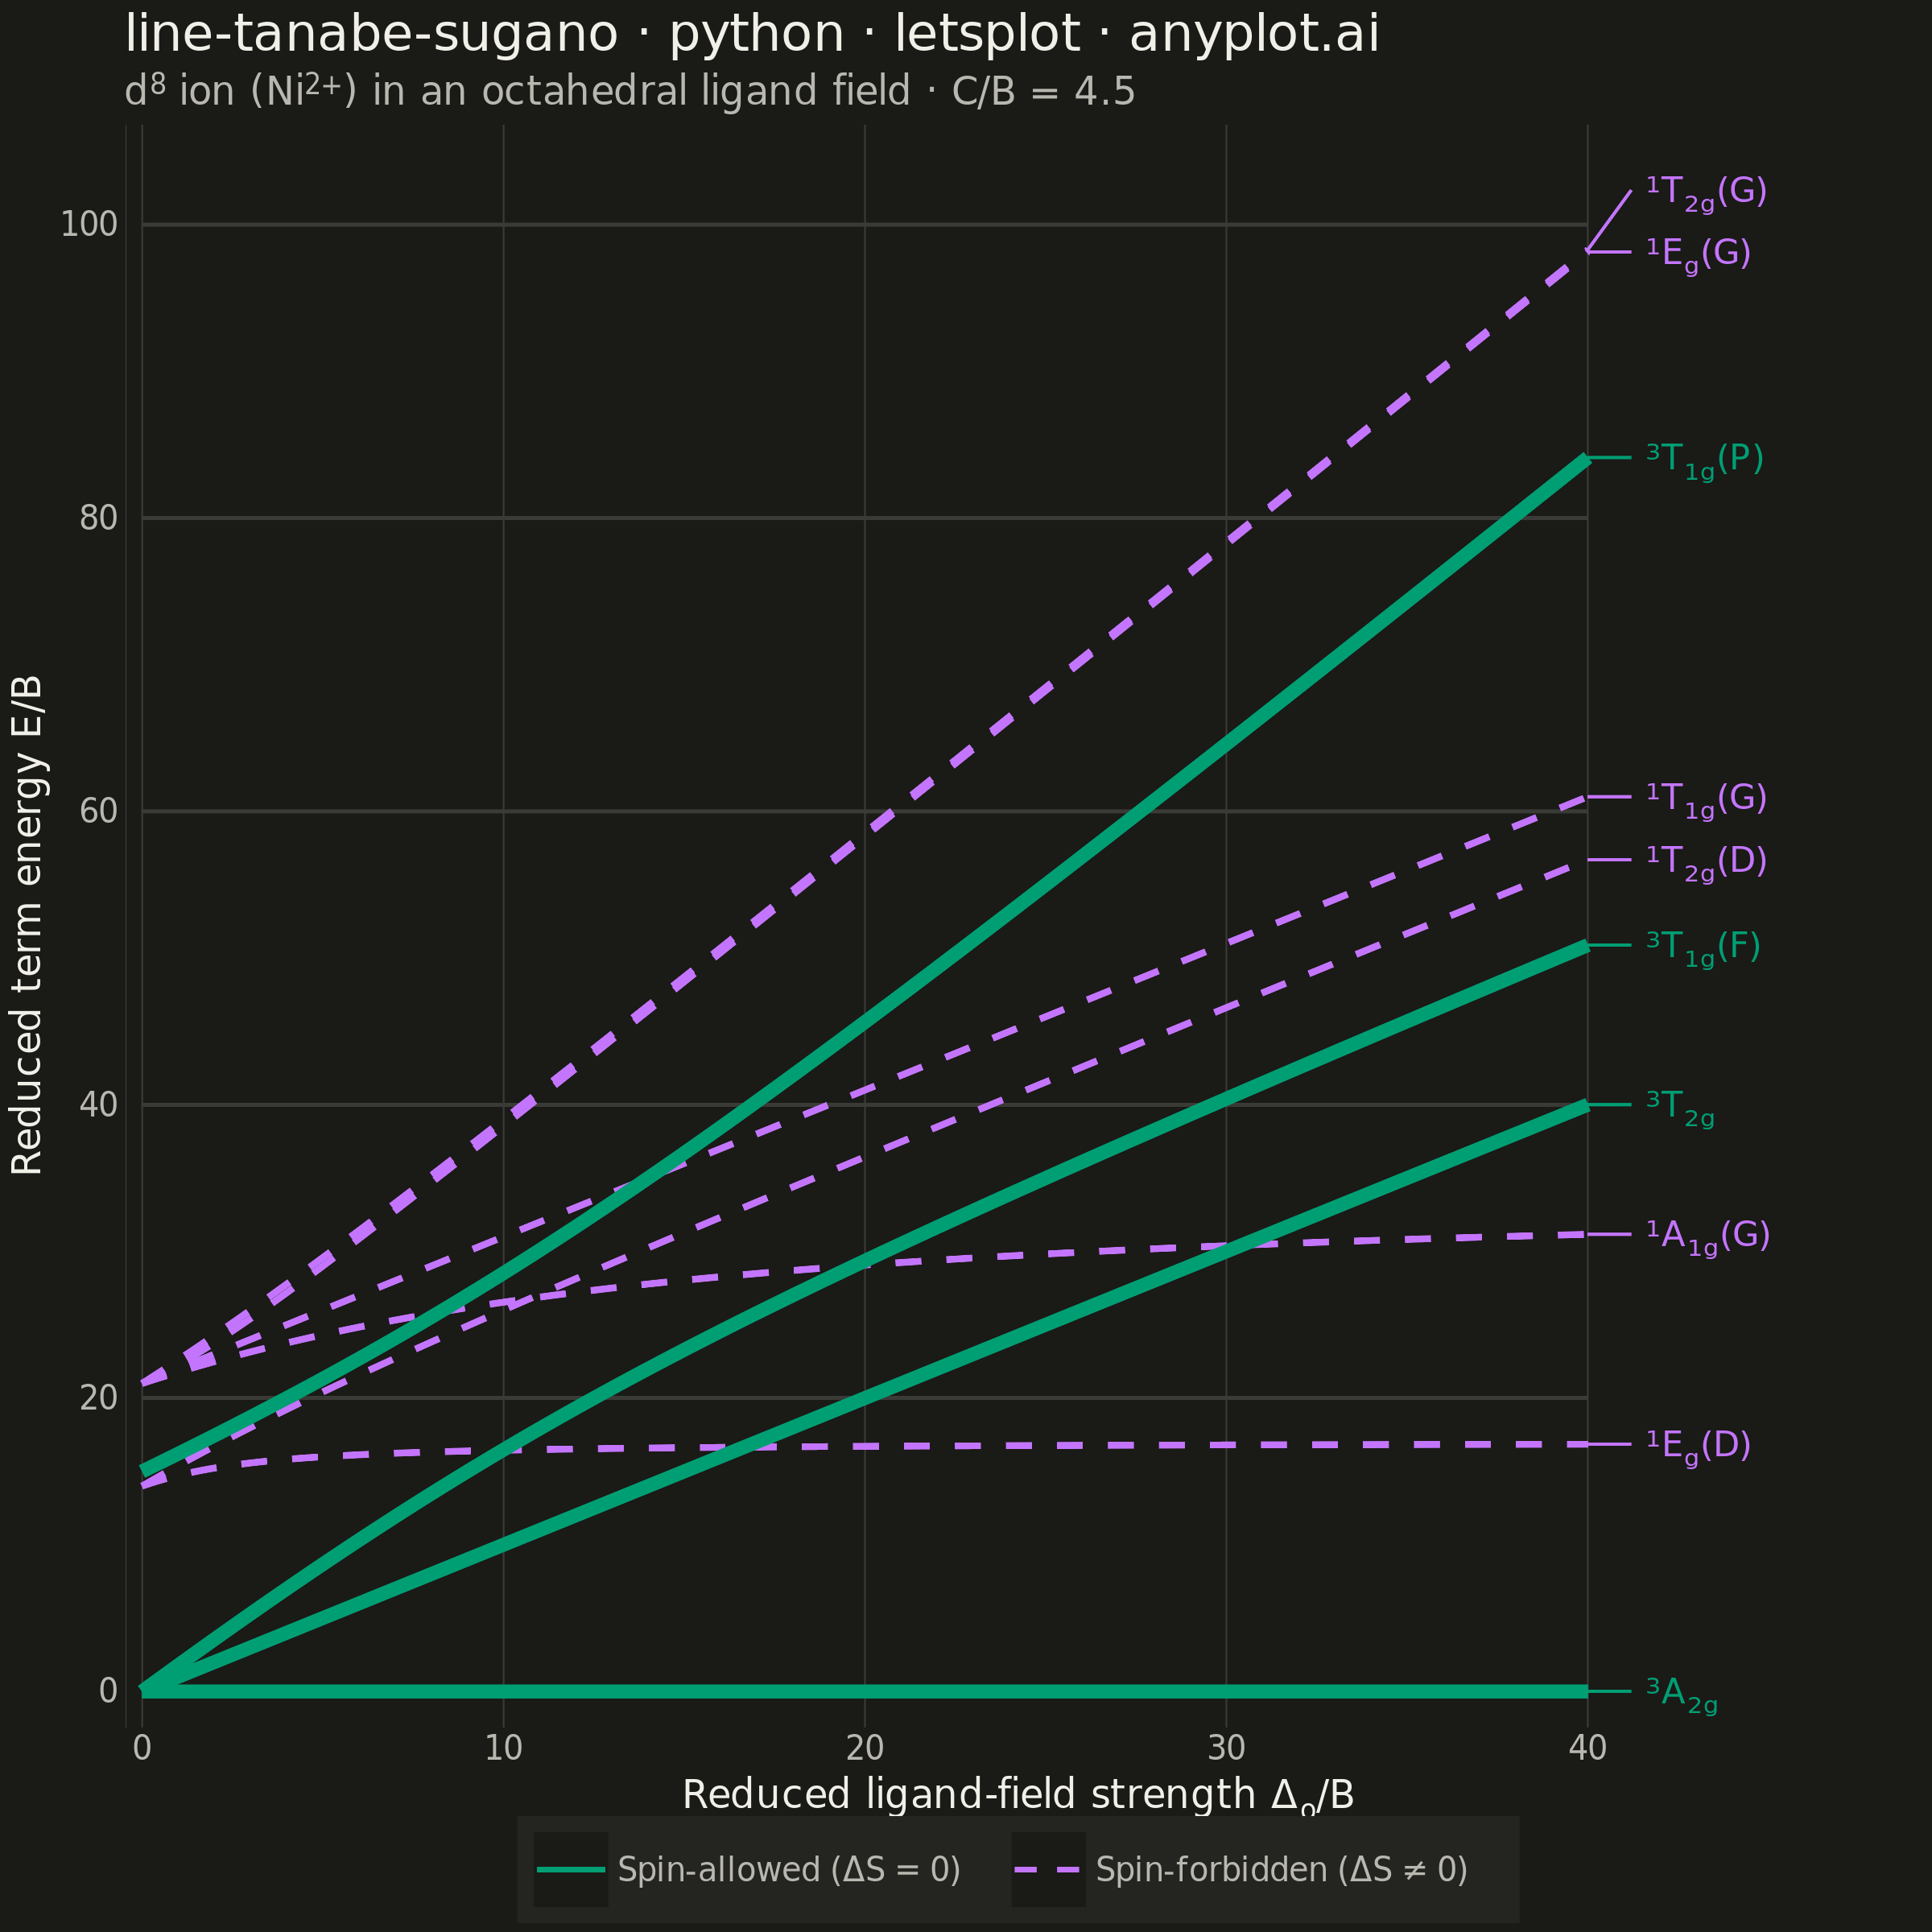
The same plot in 14 other libraries — Python: Altair, Bokeh, Matplotlib, Plotly, plotnine, Pygal, Seaborn; R: ggplot2; Julia: Makie.jl; JavaScript: Chart.js, D3.js, Apache ECharts, Highcharts, MUI X Charts. Compare all 15 side by side: Tanabe-Sugano Diagram for Crystal Field Theory in Python, R, Julia and JavaScript.
A Tanabe-Sugano diagram plots the energies of the electronic term states of a transition-metal ion in an octahedral ligand field as continuous functions of the field strength. The x-axis is the reduced ligand-field strength Δ_o/B (octahedral splitting divided by the Racah parameter B) and the y-axis is the reduced term energy E/B measured from the ground term, which therefore runs along the x-axis itself as a horizontal line at E/B = 0. Each term — labeled with its full symbol including spin multiplicity and Mulliken label — is one curve, and for d⁴–d⁷ a vertical line marks the high-spin/low-spin crossover where the ground term changes and every curve kinks. Chemists read the chart in reverse: matching ratios of observed UV-Vis band energies against the curves yields both Δ_o and B for a real complex.
""" anyplot.ai
line-tanabe-sugano: Tanabe-Sugano Diagram for Crystal Field Theory
Library: letsplot 4.11.0 | Python 3.13.15
Quality: 90/100 | Created: 2026-10-01
"""

import os

import numpy as np
import pandas as pd
from lets_plot import (
    LetsPlot,
    aes,
    element_blank,
    element_line,
    element_rect,
    element_text,
    geom_line,
    geom_segment,
    geom_text,
    ggplot,
    ggsave,
    ggsize,
    labs,
    scale_color_manual,
    scale_linetype_manual,
    scale_x_continuous,
    scale_y_continuous,
    theme,
    theme_classic,
)


LetsPlot.setup_html()

# Theme tokens (see prompts/default-style-guide.md "Theme-adaptive Chrome")
THEME = os.getenv("ANYPLOT_THEME", "light")
PAGE_BG = "#FAF8F1" if THEME == "light" else "#1A1A17"
ELEVATED_BG = "#FFFDF6" if THEME == "light" else "#242420"
INK = "#1A1A17" if THEME == "light" else "#F0EFE8"
INK_SOFT = "#4A4A44" if THEME == "light" else "#B8B7B0"
GRID = "#D8D7D0" if THEME == "light" else "#3A3A36"  # 15% ink blended into the page background
SPIN_ALLOWED = "#009E73"  # Imprint palette position 1 — always the first series
SPIN_FORBIDDEN = "#C475FD"  # Imprint palette position 2

# Data — Tanabe-Sugano energy matrices for an octahedral d8 ion (Ni2+), in units of the
# Racah parameter B with C = 4.5 B and the Racah A dropped. Each octahedral symmetry label
# gets one matrix over the free-ion terms that produce it; d8 reuses the d2 matrices with
# the sign of Dq reversed, the electron-hole relation between the two configurations.
C_OVER_B = 4.5
DELTA_MAX = 40.0
ENERGY_MAX = 100.0  # drops the runaway 1A1g(S) term, which leaves the frame above E/B = 120
LABEL_GAP = 4.2  # minimum vertical spacing between two term labels in the gutter

delta_over_b = np.linspace(0.0, DELTA_MAX, 301)
dq = -delta_over_b / 10.0
ones = np.ones_like(dq)

free_3f = -8.0 * ones  # ground term of the free d8 ion
free_3p = 7.0 * ones
free_1d = (-3.0 + 2 * C_OVER_B) * ones
free_1g = (4.0 + 2 * C_OVER_B) * ones
free_1s = (14.0 + 7 * C_OVER_B) * ones
root3 = np.sqrt(3.0)
root6 = np.sqrt(6.0)

blocks = [
    (["3A2g"], [[free_3f + 12 * dq]]),
    (["3T2g"], [[free_3f + 2 * dq]]),
    (["3T1g(F)", "3T1g(P)"], [[free_3f - 6 * dq, 4 * dq], [4 * dq, free_3p]]),
    (["1T1g(G)"], [[free_1g + 2 * dq]]),
    (["1A1g(G)", "1A1g(S)"], [[free_1g + 4 * dq, 4 * root6 * dq], [4 * root6 * dq, free_1s]]),
    (["1Eg(D)", "1Eg(G)"], [[free_1d + 24 / 7 * dq, 40 * root3 / 7 * dq], [40 * root3 / 7 * dq, free_1g + 4 / 7 * dq]]),
    (
        ["1T2g(D)", "1T2g(G)"],
        [[free_1d - 16 / 7 * dq, 20 * root3 / 7 * dq], [20 * root3 / 7 * dq, free_1g - 26 / 7 * dq]],
    ),
]

# Diagonalizing each block in ascending order keeps terms of the same symmetry and
# multiplicity from swapping identity, so their avoided crossings stay near-touches
levels = {}
for terms, block in blocks:
    eigenvalues = np.linalg.eigvalsh(np.moveaxis(np.array(block), -1, 0))
    for position, term in enumerate(terms):
        levels[term] = eigenvalues[:, position]

# Energies are measured from the ground term, which therefore runs flat along E/B = 0
ground = np.min(np.stack(list(levels.values())), axis=0)
curves = pd.concat(
    [
        pd.DataFrame(
            {
                "delta_over_b": delta_over_b,
                "energy_over_b": energy - ground,
                "term": term,
                "multiplicity": "Spin-allowed (ΔS = 0)" if term.startswith("3") else "Spin-forbidden (ΔS ≠ 0)",
            }
        )
        for term, energy in levels.items()
        if (energy - ground).max() <= ENERGY_MAX
    ],
    ignore_index=True,
)
spin_allowed = curves[curves["term"].str.startswith("3")]
spin_forbidden = curves[curves["term"].str.startswith("1")]

# Term labels sit in a gutter at the right edge, nudged apart where two curves converge
tips = curves[curves["delta_over_b"] == DELTA_MAX].sort_values("energy_over_b").reset_index(drop=True)
label_y = tips["energy_over_b"].to_numpy(copy=True)
for position in range(1, len(label_y)):
    label_y[position] = max(label_y[position], label_y[position - 1] + LABEL_GAP)
tips["label_y"] = label_y
tips["label_x"] = DELTA_MAX + 1.2
tips["symbol"] = tips["term"].str.replace(r"^(\d)([A-Z])(\d?)g", r"\\(^{\1}\2_{\3g}\\)", regex=True)
classes = ["Spin-allowed (ΔS = 0)", "Spin-forbidden (ΔS ≠ 0)"]

# Horizontal grid drawn as segments that stop at the last sample, so no rule reaches into
# the label gutter; the vertical grid and the y axis line stay with the theme
y_breaks = [0, 20, 40, 60, 80, 100]
grid_y = pd.DataFrame({"y": y_breaks, "x": 0.0, "xend": DELTA_MAX})
panel_top = label_y[-1] + 2.0

# Plot
plot = (
    ggplot(mapping=aes("delta_over_b", "energy_over_b"))
    + geom_segment(aes(x="x", y="y", xend="xend", yend="y"), data=grid_y, color=GRID, size=0.5)
    + geom_line(aes(color="multiplicity", linetype="multiplicity", group="term"), data=spin_forbidden, size=0.9)
    + geom_line(aes(color="multiplicity", linetype="multiplicity", group="term"), data=spin_allowed, size=1.9)
    + geom_segment(aes(xend="label_x", yend="label_y", color="multiplicity"), data=tips, size=0.4, show_legend=False)
    + geom_text(
        aes("label_x", "label_y", label="symbol", color="multiplicity"),
        data=tips,
        size=5.4,
        hjust=0,
        nudge_x=0.4,
        show_legend=False,
    )
    + scale_color_manual(values=[SPIN_ALLOWED, SPIN_FORBIDDEN], breaks=classes)
    + scale_linetype_manual(values=["solid", "dashed"], breaks=classes)
    + scale_x_continuous(limits=(0.0, 48.5), breaks=[0, 10, 20, 30, 40], expand=[0, 0.5])
    + scale_y_continuous(limits=(0.0, panel_top), breaks=y_breaks, expand=[0, 2.6])
    + labs(
        title="line-tanabe-sugano · python · letsplot · anyplot.ai",
        subtitle=r"\(d^{8}\) ion (\(Ni^{2+}\)) in an octahedral ligand field · \(C/B\) = 4.5",
        x=r"Reduced ligand-field strength \(\Delta_{o}/B\)",
        y=r"Reduced term energy \(E/B\)",
    )
    + ggsize(600, 600)
    + theme_classic()
    + theme(
        plot_background=element_rect(fill=PAGE_BG, color=PAGE_BG),
        panel_background=element_rect(fill=PAGE_BG, color=PAGE_BG),
        panel_grid_major_x=element_line(color=GRID, size=0.5),
        panel_grid_major_y=element_blank(),
        panel_grid_minor=element_blank(),
        axis_line_x=element_blank(),
        axis_line_y=element_line(color=INK_SOFT, size=1.0),
        axis_ticks=element_blank(),
        axis_title=element_text(size=12, color=INK),
        axis_text=element_text(size=10, color=INK_SOFT),
        plot_title=element_text(size=16, color=INK),
        plot_subtitle=element_text(size=12, color=INK_SOFT),
        legend_background=element_rect(fill=ELEVATED_BG, color=GRID),
        legend_text=element_text(size=10, color=INK_SOFT),
        legend_title=element_blank(),
        legend_position="bottom",
    )
)

# Save
ggsave(plot, f"plot-{THEME}.png", scale=4, path=".")
ggsave(plot, f"plot-{THEME}.html", path=".")
Runnable source as JSON, for any HTTP client: https://api.anyplot.ai/specs/line-tanabe-sugano/letsplot/code. Any spec id and library id listed in llms-full.txt fit the same URL shape; every URL below is complete and callable.
{
  "spec_id": "line-tanabe-sugano",
  "language": "python",
  "library": "letsplot",
  "page": "https://anyplot.ai/line-tanabe-sugano/python/letsplot",
  "hub": "https://anyplot.ai/line-tanabe-sugano",
  "code_json": "https://api.anyplot.ai/specs/line-tanabe-sugano/letsplot/code",
  "spec_json": "https://api.anyplot.ai/specs/line-tanabe-sugano",
  "render_light_png": "https://storage.googleapis.com/anyplot-images/plots/line-tanabe-sugano/python/letsplot/plot-light.png",
  "render_dark_png": "https://storage.googleapis.com/anyplot-images/plots/line-tanabe-sugano/python/letsplot/plot-dark.png",
  "interactive_light_html": "https://storage.googleapis.com/anyplot-images/plots/line-tanabe-sugano/python/letsplot/plot-light.html",
  "interactive_dark_html": "https://storage.googleapis.com/anyplot-images/plots/line-tanabe-sugano/python/letsplot/plot-dark.html",
  "quality_score": 90.0,
  "license": "MIT",
  "guide": "https://anyplot.ai/llms.txt"
}
Part of Tanabe-Sugano Diagram for Crystal Field Theory on anyplot.ai.