The same plot in 14 other libraries — Python: Bokeh, lets-plot, Matplotlib, Plotly, plotnine, Pygal, Seaborn; R: ggplot2; Julia: Makie.jl; JavaScript: Chart.js, D3.js, Apache ECharts, Highcharts, MUI X Charts. Compare all 15 side by side: Tanabe-Sugano Diagram for Crystal Field Theory in Python, R, Julia and JavaScript.
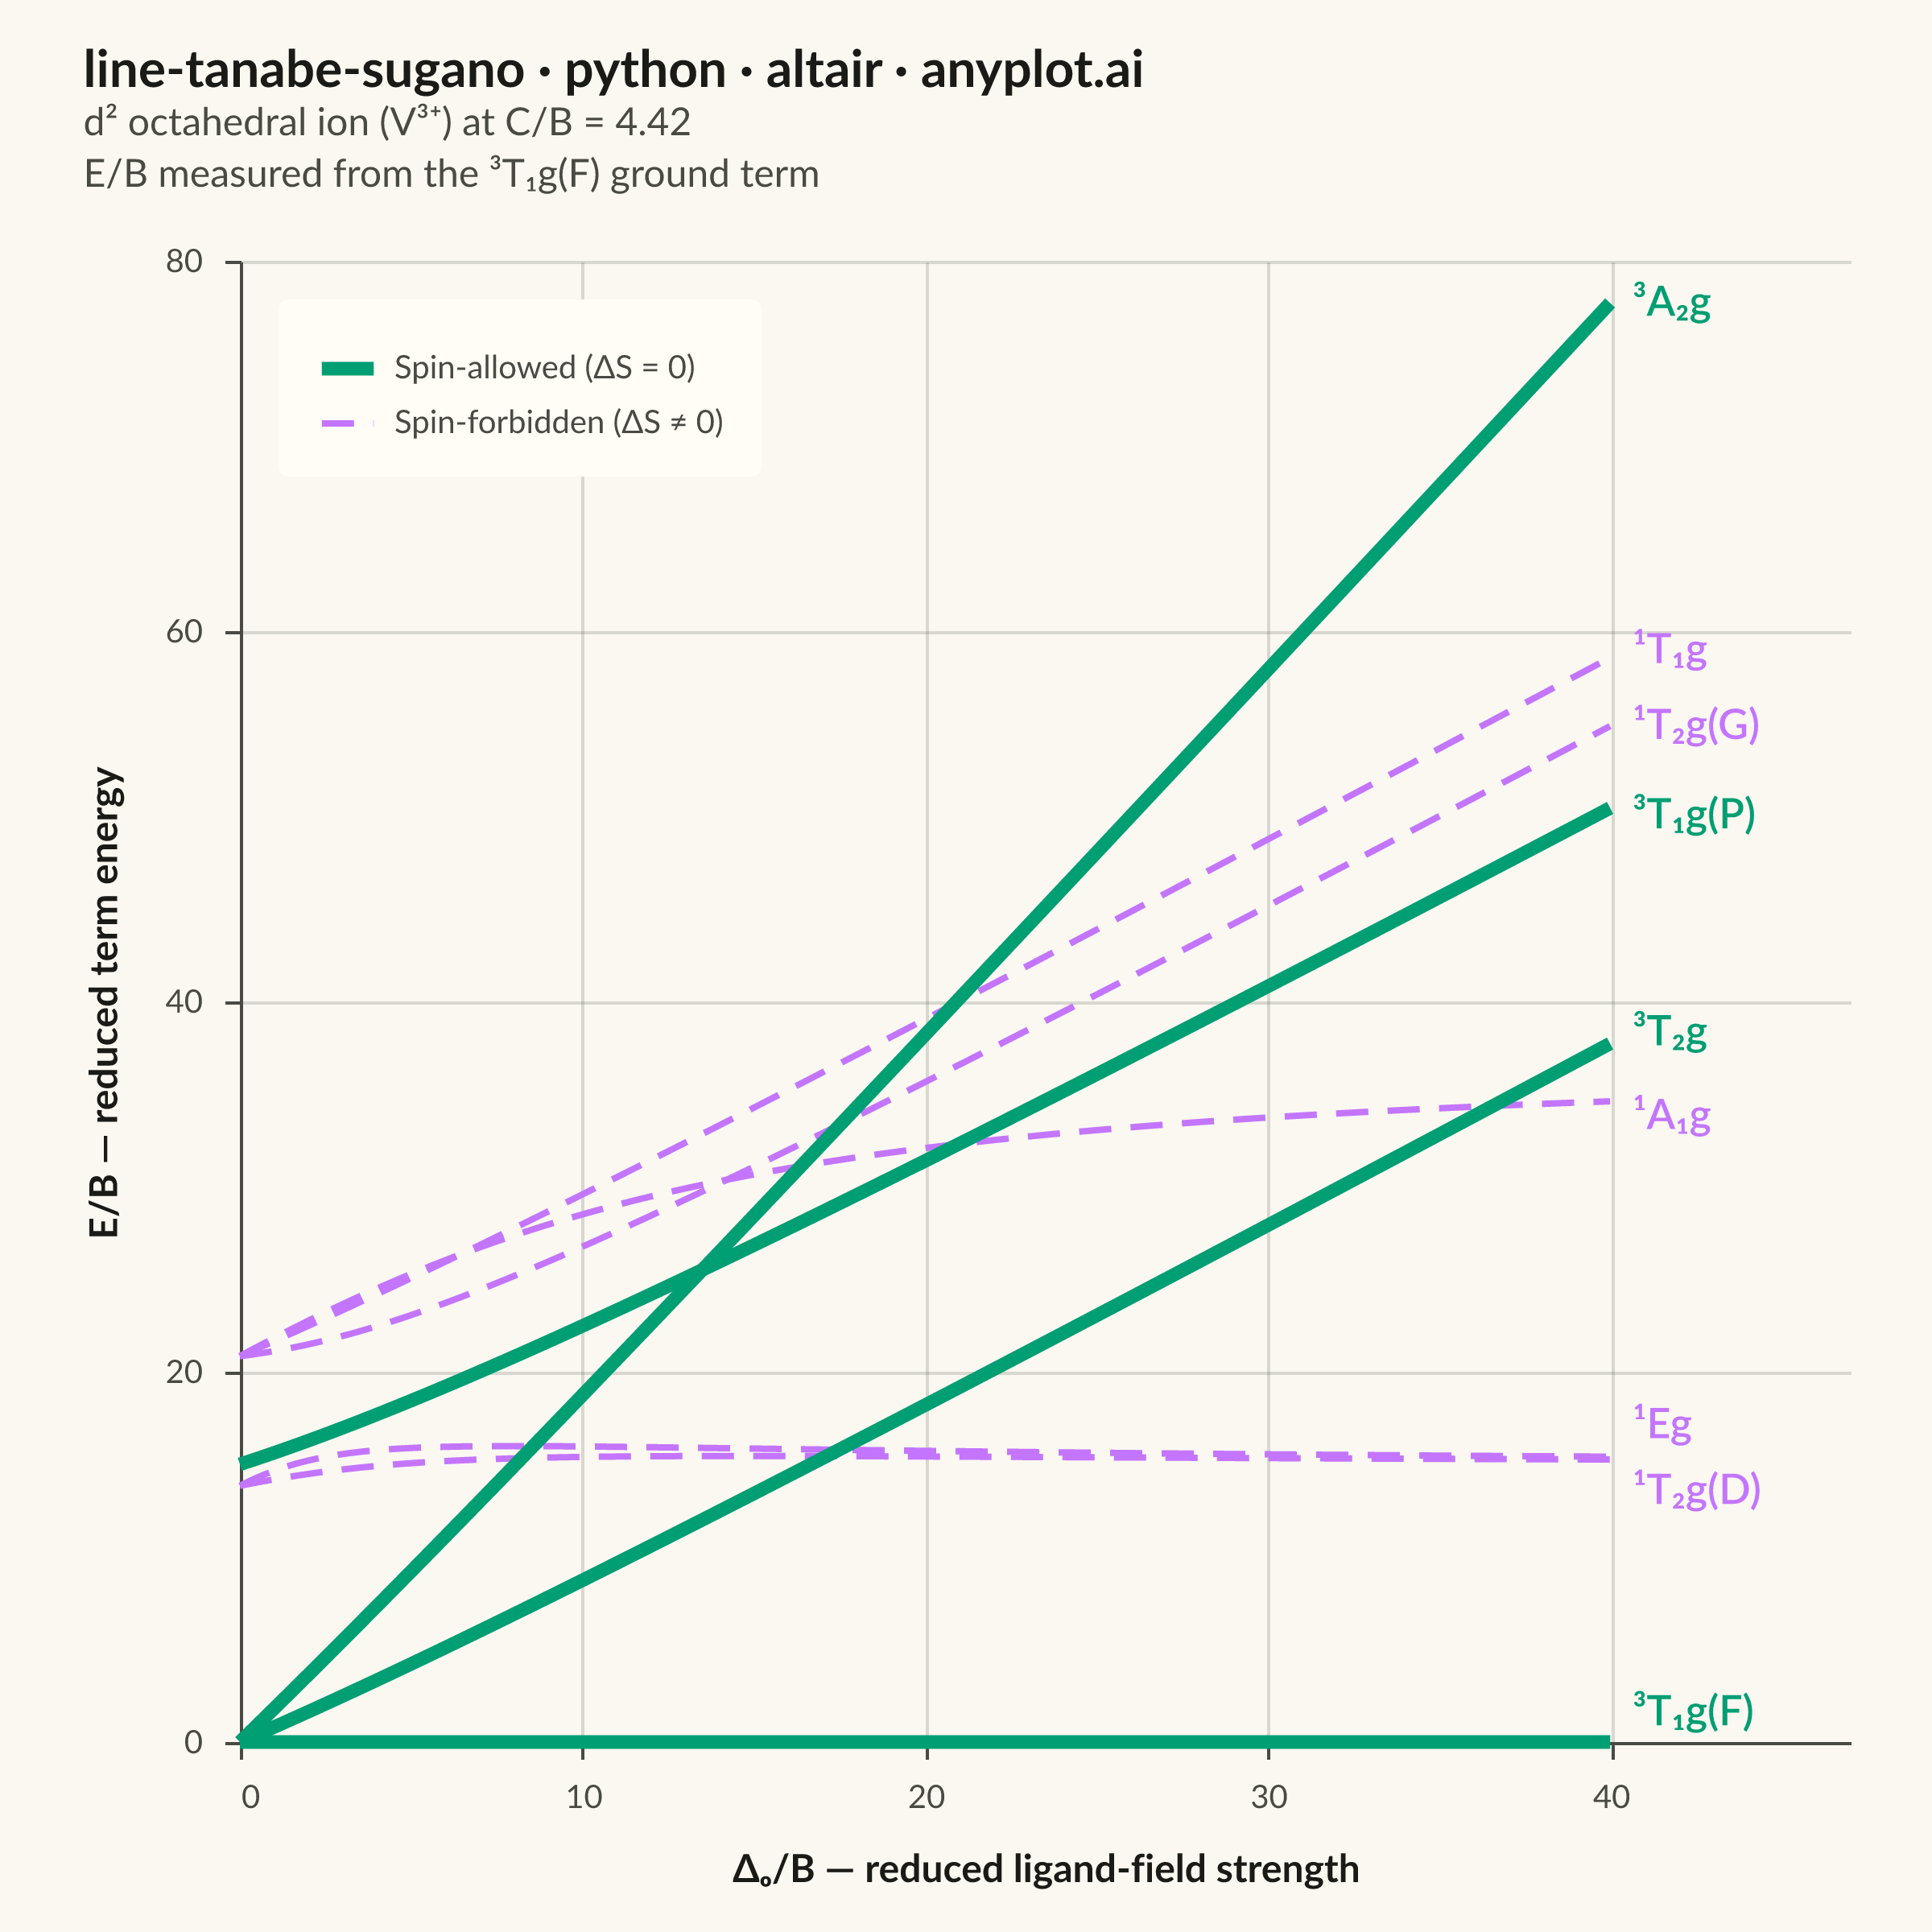
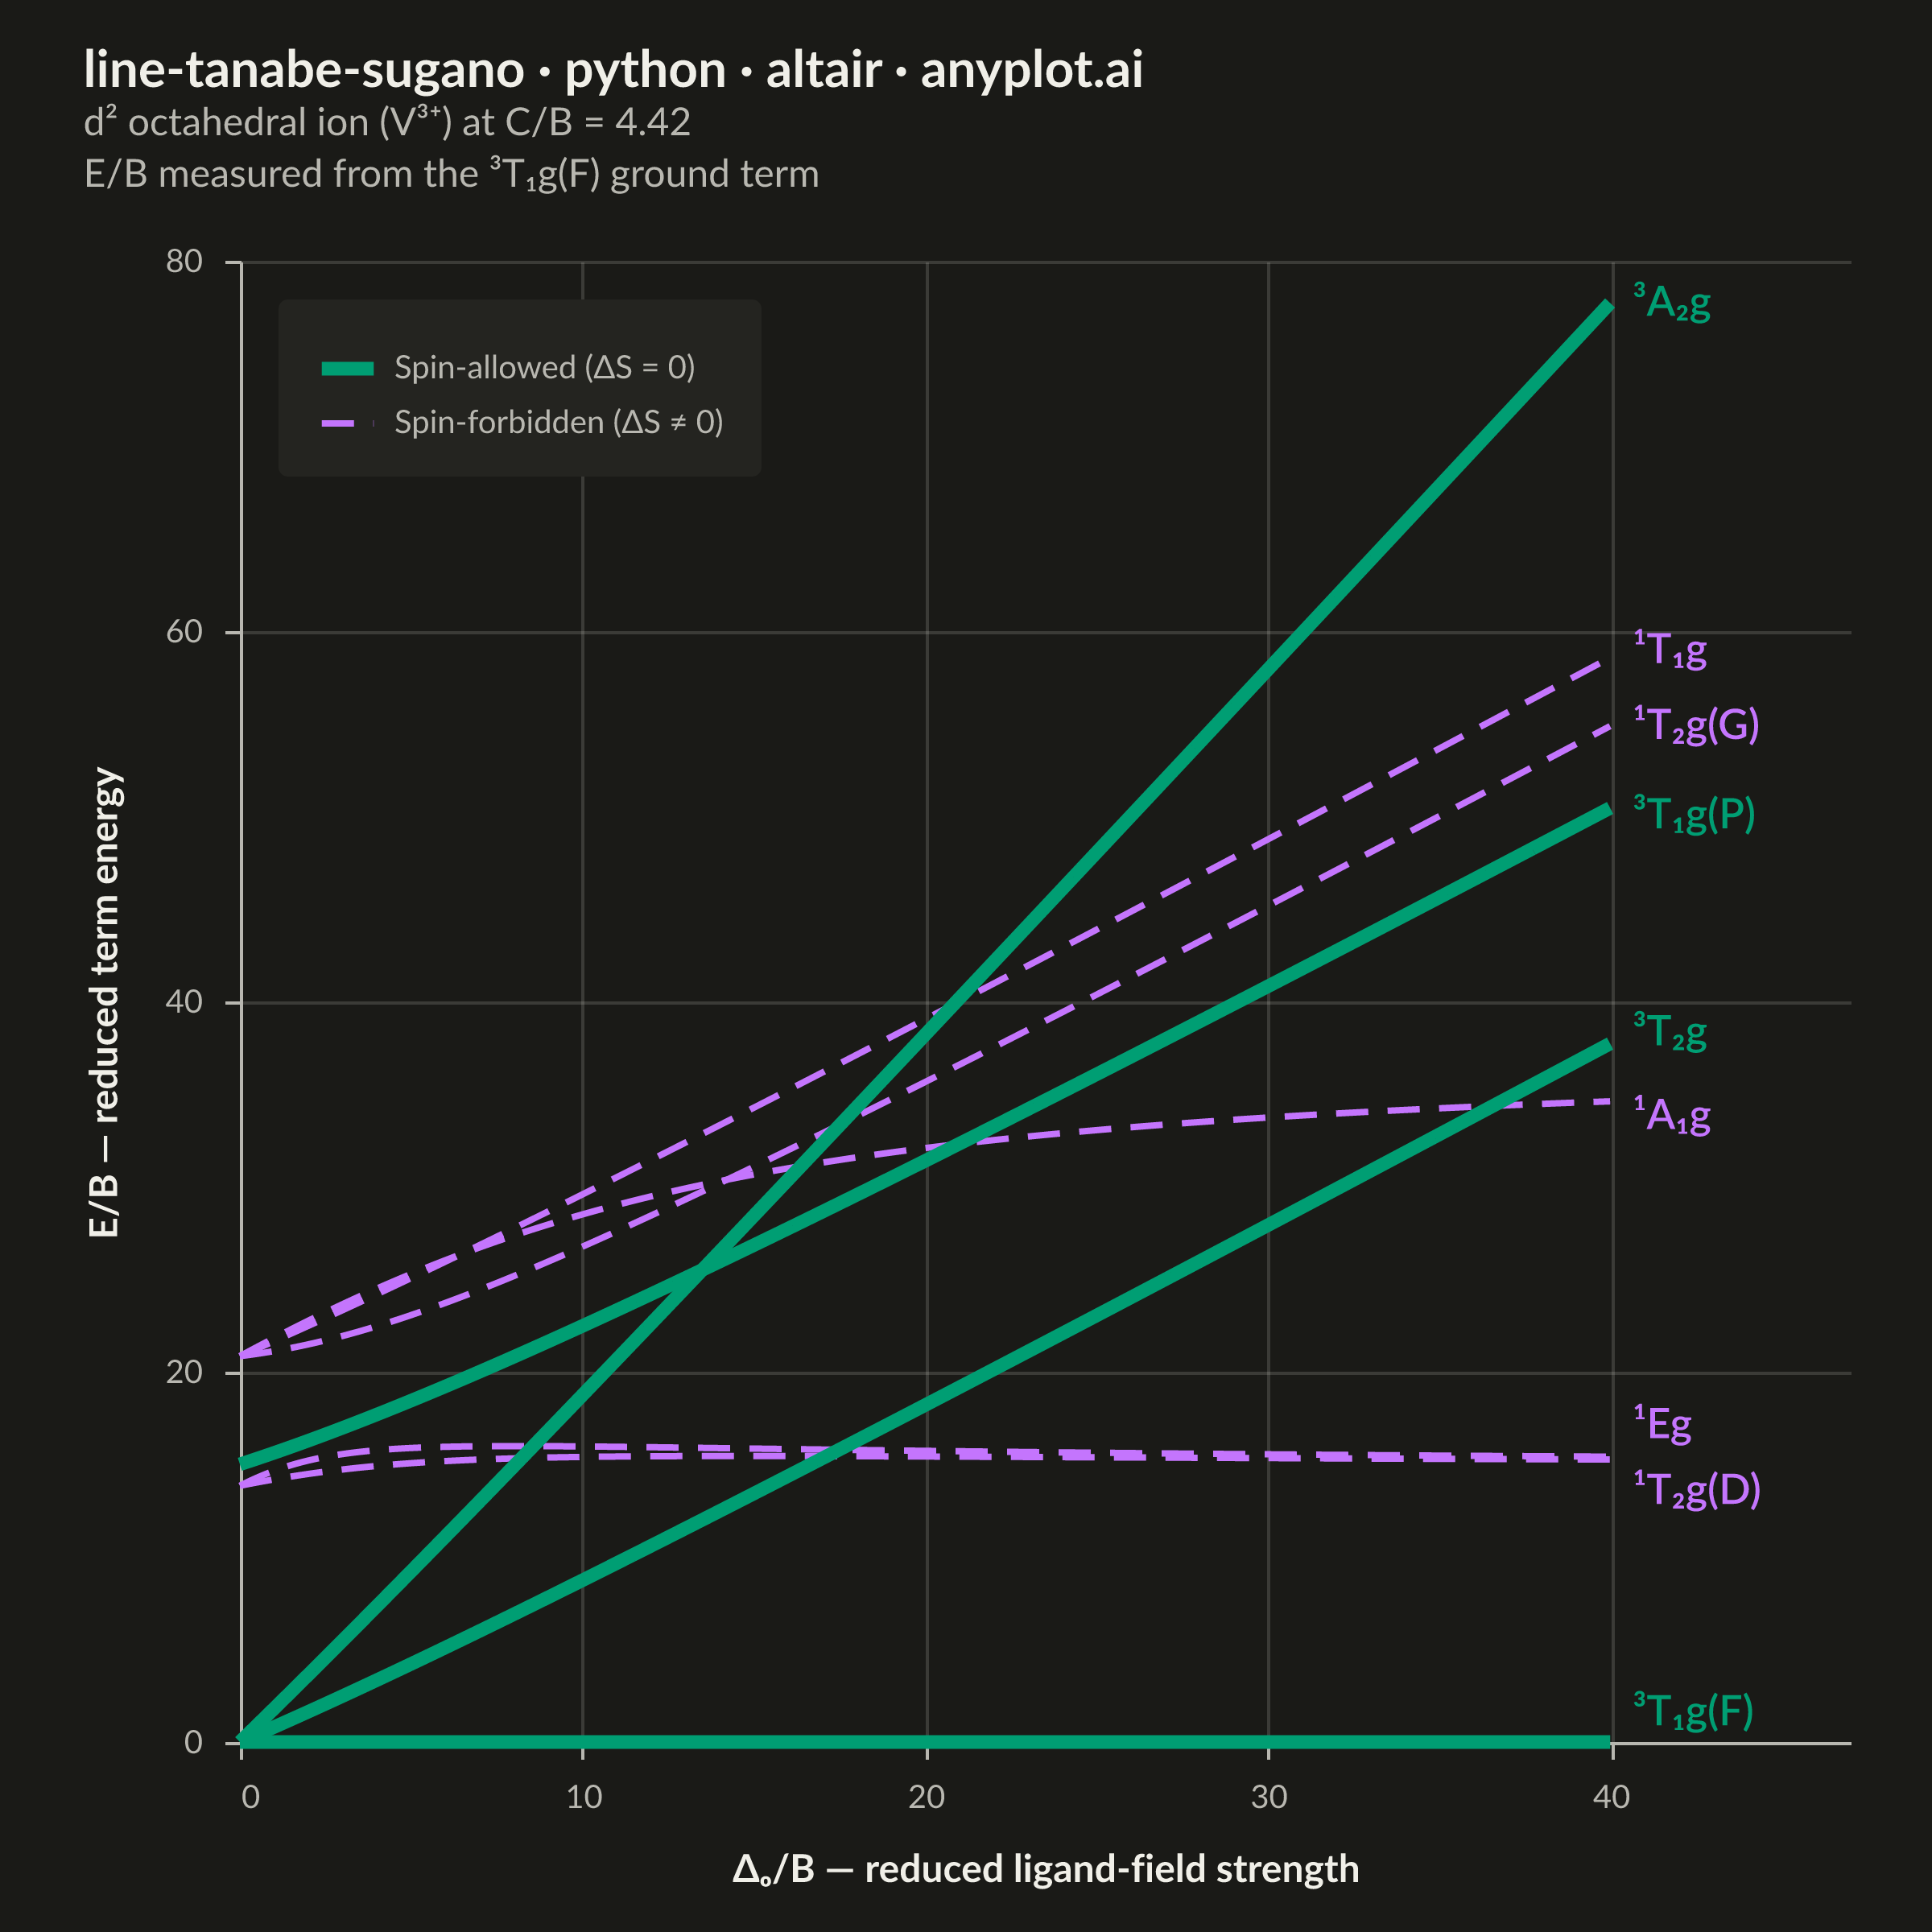
A Tanabe-Sugano diagram plots the energies of the electronic term states of a transition-metal ion in an octahedral ligand field as continuous functions of the field strength. The x-axis is the reduced ligand-field strength Δ_o/B (octahedral splitting divided by the Racah parameter B) and the y-axis is the reduced term energy E/B measured from the ground term, which therefore runs along the x-axis itself as a horizontal line at E/B = 0. Each term — labeled with its full symbol including spin multiplicity and Mulliken label — is one curve, and for d⁴–d⁷ a vertical line marks the high-spin/low-spin crossover where the ground term changes and every curve kinks. Chemists read the chart in reverse: matching ratios of observed UV-Vis band energies against the curves yields both Δ_o and B for a real complex.
""" anyplot.ai
line-tanabe-sugano: Tanabe-Sugano Diagram for Crystal Field Theory
Library: altair 6.3.0 | Python 3.13.15
Quality: 88/100 | Created: 2026-10-01
"""

import os

import altair as alt
import numpy as np
import pandas as pd
from PIL import Image


# Theme tokens (see prompts/default-style-guide.md "Theme-adaptive Chrome")
THEME = os.getenv("ANYPLOT_THEME", "light")
PAGE_BG = "#FAF8F1" if THEME == "light" else "#1A1A17"
ELEVATED_BG = "#FFFDF6" if THEME == "light" else "#242420"
INK = "#1A1A17" if THEME == "light" else "#F0EFE8"
INK_SOFT = "#4A4A44" if THEME == "light" else "#B8B7B0"
SPIN_ALLOWED_COLOR = "#009E73"  # Imprint palette position 1 — spin-allowed terms
SPIN_FORBIDDEN_COLOR = "#C475FD"  # Imprint palette position 2 — spin-forbidden terms

# Data — Tanabe-Sugano matrices for the d² octahedral ion V³⁺ at C/B = 4.42,
# in units of B with the Racah A dropped. Each symmetry block is diagonalized at
# every field strength; the strong-field basis states carry 10Dq/B = Δ_o/B per
# electron promoted from t₂g to e_g, so the diagonals grow by Δ_o/B or 2·Δ_o/B.
racah_c_over_b = 4.42
delta_over_b = np.linspace(0.0, 40.0, 301)
flat = np.zeros_like(delta_over_b)

triplet_t1 = np.linalg.eigvalsh(
    np.moveaxis(np.array([[-5.0 + flat, 6.0 + flat], [6.0 + flat, 4.0 + delta_over_b]]), -1, 0)
)
singlet_e = np.linalg.eigvalsh(
    np.moveaxis(
        np.array(
            [
                [1.0 + 2 * racah_c_over_b + flat, -2 * np.sqrt(3.0) + flat],
                [-2 * np.sqrt(3.0) + flat, 2 * racah_c_over_b + 2 * delta_over_b],
            ]
        ),
        -1,
        0,
    )
)
singlet_t2 = np.linalg.eigvalsh(
    np.moveaxis(
        np.array(
            [
                [1.0 + 2 * racah_c_over_b + flat, 2 * np.sqrt(3.0) + flat],
                [2 * np.sqrt(3.0) + flat, 2 * racah_c_over_b + delta_over_b],
            ]
        ),
        -1,
        0,
    )
)
singlet_a1 = np.linalg.eigvalsh(
    np.moveaxis(
        np.array(
            [
                [10.0 + 5 * racah_c_over_b + flat, np.sqrt(6.0) * (2.0 + racah_c_over_b) + flat],
                [np.sqrt(6.0) * (2.0 + racah_c_over_b) + flat, 8.0 + 4 * racah_c_over_b + 2 * delta_over_b],
            ]
        ),
        -1,
        0,
    )
)

# Term energies measured from the ³T₁g(F) ground term, inside an E/B ≤ 80 window
ground_term = triplet_t1[:, 0]
term_energies = {
    "³T₁g(F)": triplet_t1[:, 0],
    "¹T₂g(D)": singlet_t2[:, 0],
    "¹Eg": singlet_e[:, 0],
    "¹A₁g": singlet_a1[:, 0],
    "³T₂g": -8.0 + delta_over_b,
    "³T₁g(P)": triplet_t1[:, 1],
    "¹T₂g(G)": singlet_t2[:, 1],
    "¹T₁g": 4.0 + 2 * racah_c_over_b + delta_over_b,
    "³A₂g": -8.0 + 2 * delta_over_b,
}
spin_allowed_terms = {"³T₁g(F)", "³T₂g", "³T₁g(P)", "³A₂g"}

curves = pd.DataFrame(
    {
        "delta_over_b": np.tile(delta_over_b, len(term_energies)),
        "term": np.repeat(list(term_energies), delta_over_b.size),
        "energy_over_b": np.concatenate([e - ground_term for e in term_energies.values()]),
    }
)
curves["spin_class"] = np.where(
    curves["term"].isin(spin_allowed_terms), "Spin-allowed (ΔS = 0)", "Spin-forbidden (ΔS ≠ 0)"
)

# Right-edge term labels; the offsets only separate labels where curves converge
label_offsets = {"³T₁g(F)": 1.6, "¹T₂g(D)": -1.7, "¹Eg": 1.7, "¹A₁g": -0.8, "³T₂g": 0.6, "³T₁g(P)": -0.4, "¹T₁g": 0.4}
labels = curves[curves["delta_over_b"] == delta_over_b[-1]].copy()
labels["label_y"] = labels["energy_over_b"] + labels["term"].map(label_offsets).fillna(0.0)

# Plot — near-square view, both axes starting at 0, right gutter for the labels
field_strength = alt.X(
    "delta_over_b:Q",
    scale=alt.Scale(domain=[0, 47], nice=False),
    axis=alt.Axis(values=[0, 10, 20, 30, 40], title="Δₒ/B — reduced ligand-field strength"),
)
spin_color = alt.Color(
    "spin_class:N",
    scale=alt.Scale(
        domain=["Spin-allowed (ΔS = 0)", "Spin-forbidden (ΔS ≠ 0)"], range=[SPIN_ALLOWED_COLOR, SPIN_FORBIDDEN_COLOR]
    ),
    legend=alt.Legend(title=None, orient="top-left", offset=12),
)

term_lines = (
    alt.Chart(curves)
    .mark_line()
    .encode(
        x=field_strength,
        y=alt.Y(
            "energy_over_b:Q",
            scale=alt.Scale(domain=[0, 80], nice=False),
            axis=alt.Axis(values=[0, 20, 40, 60, 80], title="E/B — reduced term energy"),
        ),
        detail="term:N",
        color=spin_color,
        strokeDash=alt.StrokeDash(
            "spin_class:N",
            scale=alt.Scale(domain=["Spin-allowed (ΔS = 0)", "Spin-forbidden (ΔS ≠ 0)"], range=[[1, 0], [10, 6]]),
            legend=alt.Legend(title=None, orient="top-left", offset=12),
        ),
        strokeWidth=alt.StrokeWidth(
            "spin_class:N",
            scale=alt.Scale(domain=["Spin-allowed (ΔS = 0)", "Spin-forbidden (ΔS ≠ 0)"], range=[4.2, 2.0]),
            legend=None,
        ),
        tooltip=[
            alt.Tooltip("term:N", title="Term"),
            alt.Tooltip("delta_over_b:Q", title="Δₒ/B", format=".1f"),
            alt.Tooltip("energy_over_b:Q", title="E/B", format=".2f"),
        ],
    )
)

term_labels = (
    alt.Chart(labels)
    .mark_text(align="left", baseline="middle", fontSize=13, fontWeight=600, dx=7)
    .encode(
        x=field_strength,
        y=alt.Y("label_y:Q", scale=alt.Scale(domain=[0, 80], nice=False)),
        text="term:N",
        color=alt.Color("spin_class:N", legend=None),
    )
)

chart = (
    alt.layer(term_lines, term_labels)
    .properties(
        width=500,
        height=460,
        background=PAGE_BG,
        padding={"left": 4, "right": 4, "top": 4, "bottom": 4},
        title=alt.Title(
            "line-tanabe-sugano · python · altair · anyplot.ai",
            subtitle=["d² octahedral ion (V³⁺) at C/B = 4.42", "E/B measured from the ³T₁g(F) ground term"],
            fontSize=16,
            subtitleFontSize=12,
            anchor="start",
            offset=16,
        ),
    )
    .configure(font="Lato")
    .configure_view(fill=PAGE_BG, stroke=None)
    .configure_axis(
        domainColor=INK_SOFT,
        tickColor=INK_SOFT,
        gridColor=INK,
        gridOpacity=0.15,
        labelColor=INK_SOFT,
        titleColor=INK,
        labelFontSize=10,
        titleFontSize=12,
        labelPadding=7,
        titlePadding=12,
    )
    .configure_title(color=INK, subtitleColor=INK_SOFT, subtitleLineHeight=16)
    .configure_legend(
        fillColor=ELEVATED_BG,
        labelColor=INK_SOFT,
        labelFontSize=10,
        symbolStrokeWidth=3,
        symbolSize=260,
        padding=11,
        cornerRadius=3,
    )
)

# Save
chart.save(f"plot-{THEME}.png", scale_factor=4.0)

TW, TH = 2400, 2400
_img = Image.open(f"plot-{THEME}.png").convert("RGB")
_w, _h = _img.size
if _w > TW or _h > TH:
    raise SystemExit(
        f"altair vl-convert produced {_w}×{_h}, exceeds target {TW}×{TH}. "
        f"Shrink chart .properties(width=, height=) values and re-render."
    )
if _w < TW or _h < TH:
    _canvas = Image.new("RGB", (TW, TH), PAGE_BG)
    _canvas.paste(_img, ((TW - _w) // 2, (TH - _h) // 2))
    _canvas.save(f"plot-{THEME}.png")

chart.save(f"plot-{THEME}.html")
Runnable source as JSON, for any HTTP client: https://api.anyplot.ai/specs/line-tanabe-sugano/altair/code. Any spec id and library id listed in llms-full.txt fit the same URL shape; every URL below is complete and callable.
{
  "spec_id": "line-tanabe-sugano",
  "language": "python",
  "library": "altair",
  "page": "https://anyplot.ai/line-tanabe-sugano/python/altair",
  "hub": "https://anyplot.ai/line-tanabe-sugano",
  "code_json": "https://api.anyplot.ai/specs/line-tanabe-sugano/altair/code",
  "spec_json": "https://api.anyplot.ai/specs/line-tanabe-sugano",
  "render_light_png": "https://storage.googleapis.com/anyplot-images/plots/line-tanabe-sugano/python/altair/plot-light.png",
  "render_dark_png": "https://storage.googleapis.com/anyplot-images/plots/line-tanabe-sugano/python/altair/plot-dark.png",
  "interactive_light_html": "https://storage.googleapis.com/anyplot-images/plots/line-tanabe-sugano/python/altair/plot-light.html",
  "interactive_dark_html": "https://storage.googleapis.com/anyplot-images/plots/line-tanabe-sugano/python/altair/plot-dark.html",
  "quality_score": 88.0,
  "license": "MIT",
  "guide": "https://anyplot.ai/llms.txt"
}
Part of Tanabe-Sugano Diagram for Crystal Field Theory on anyplot.ai.