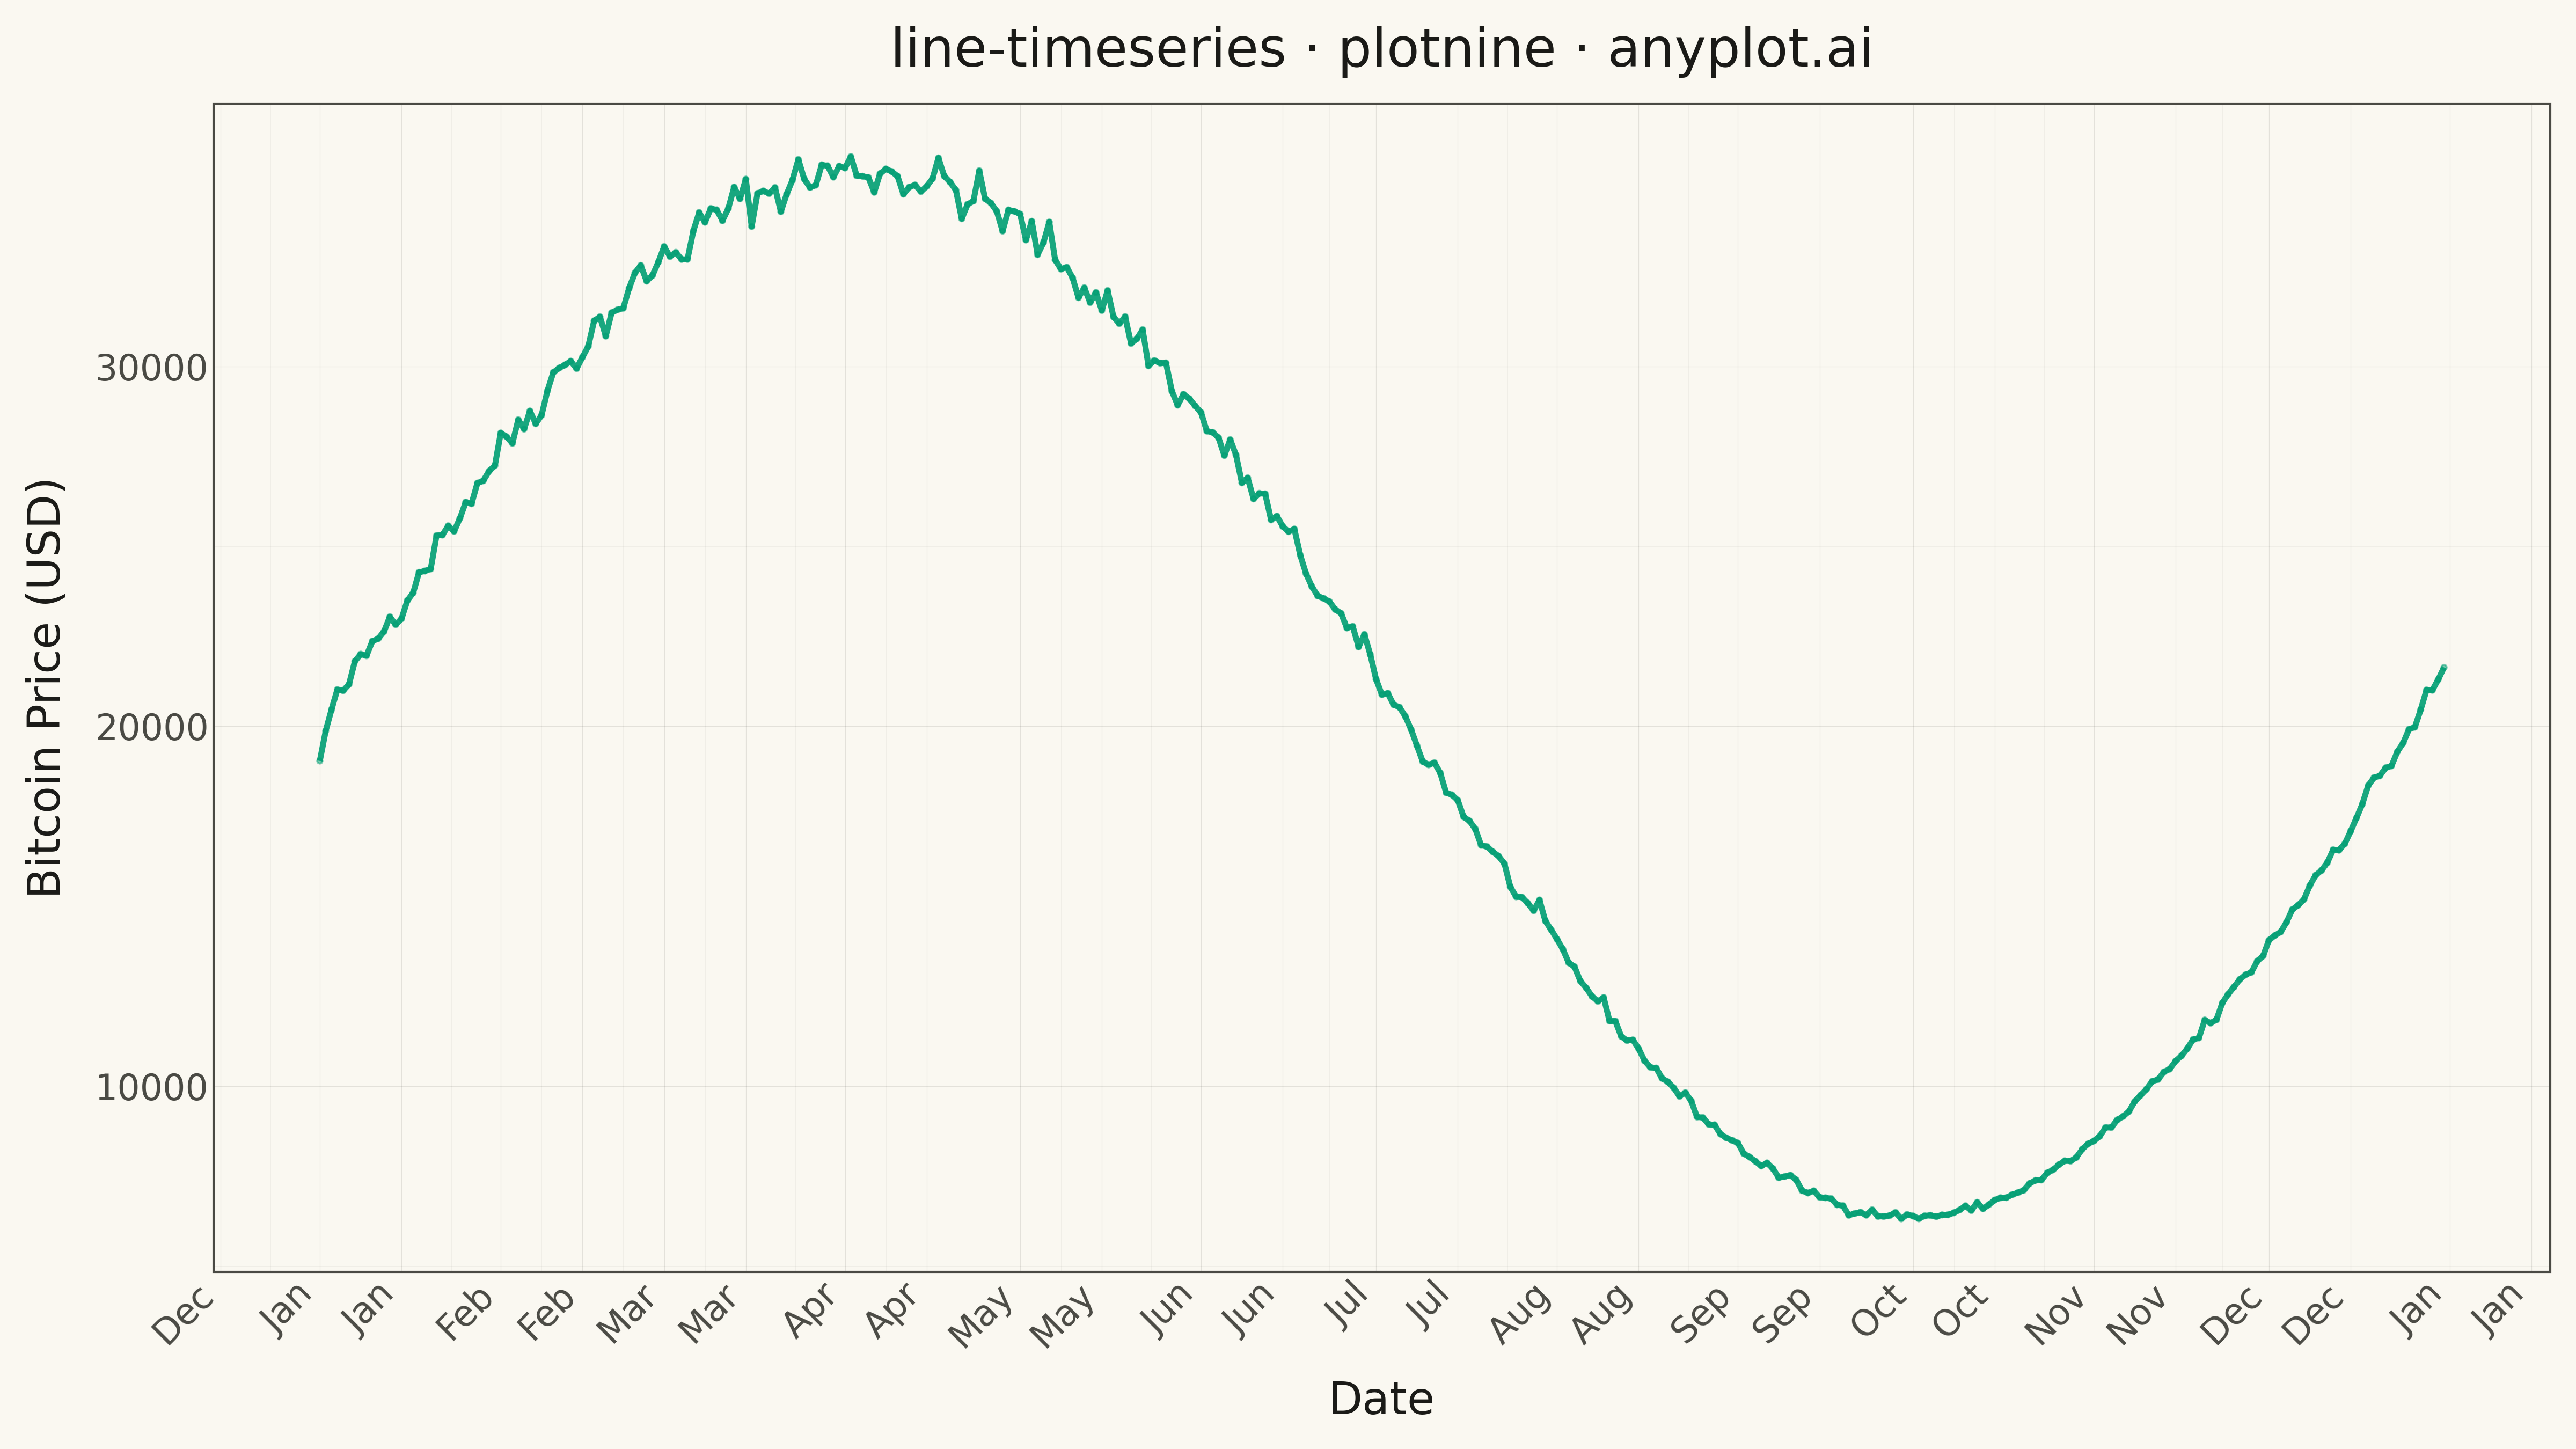
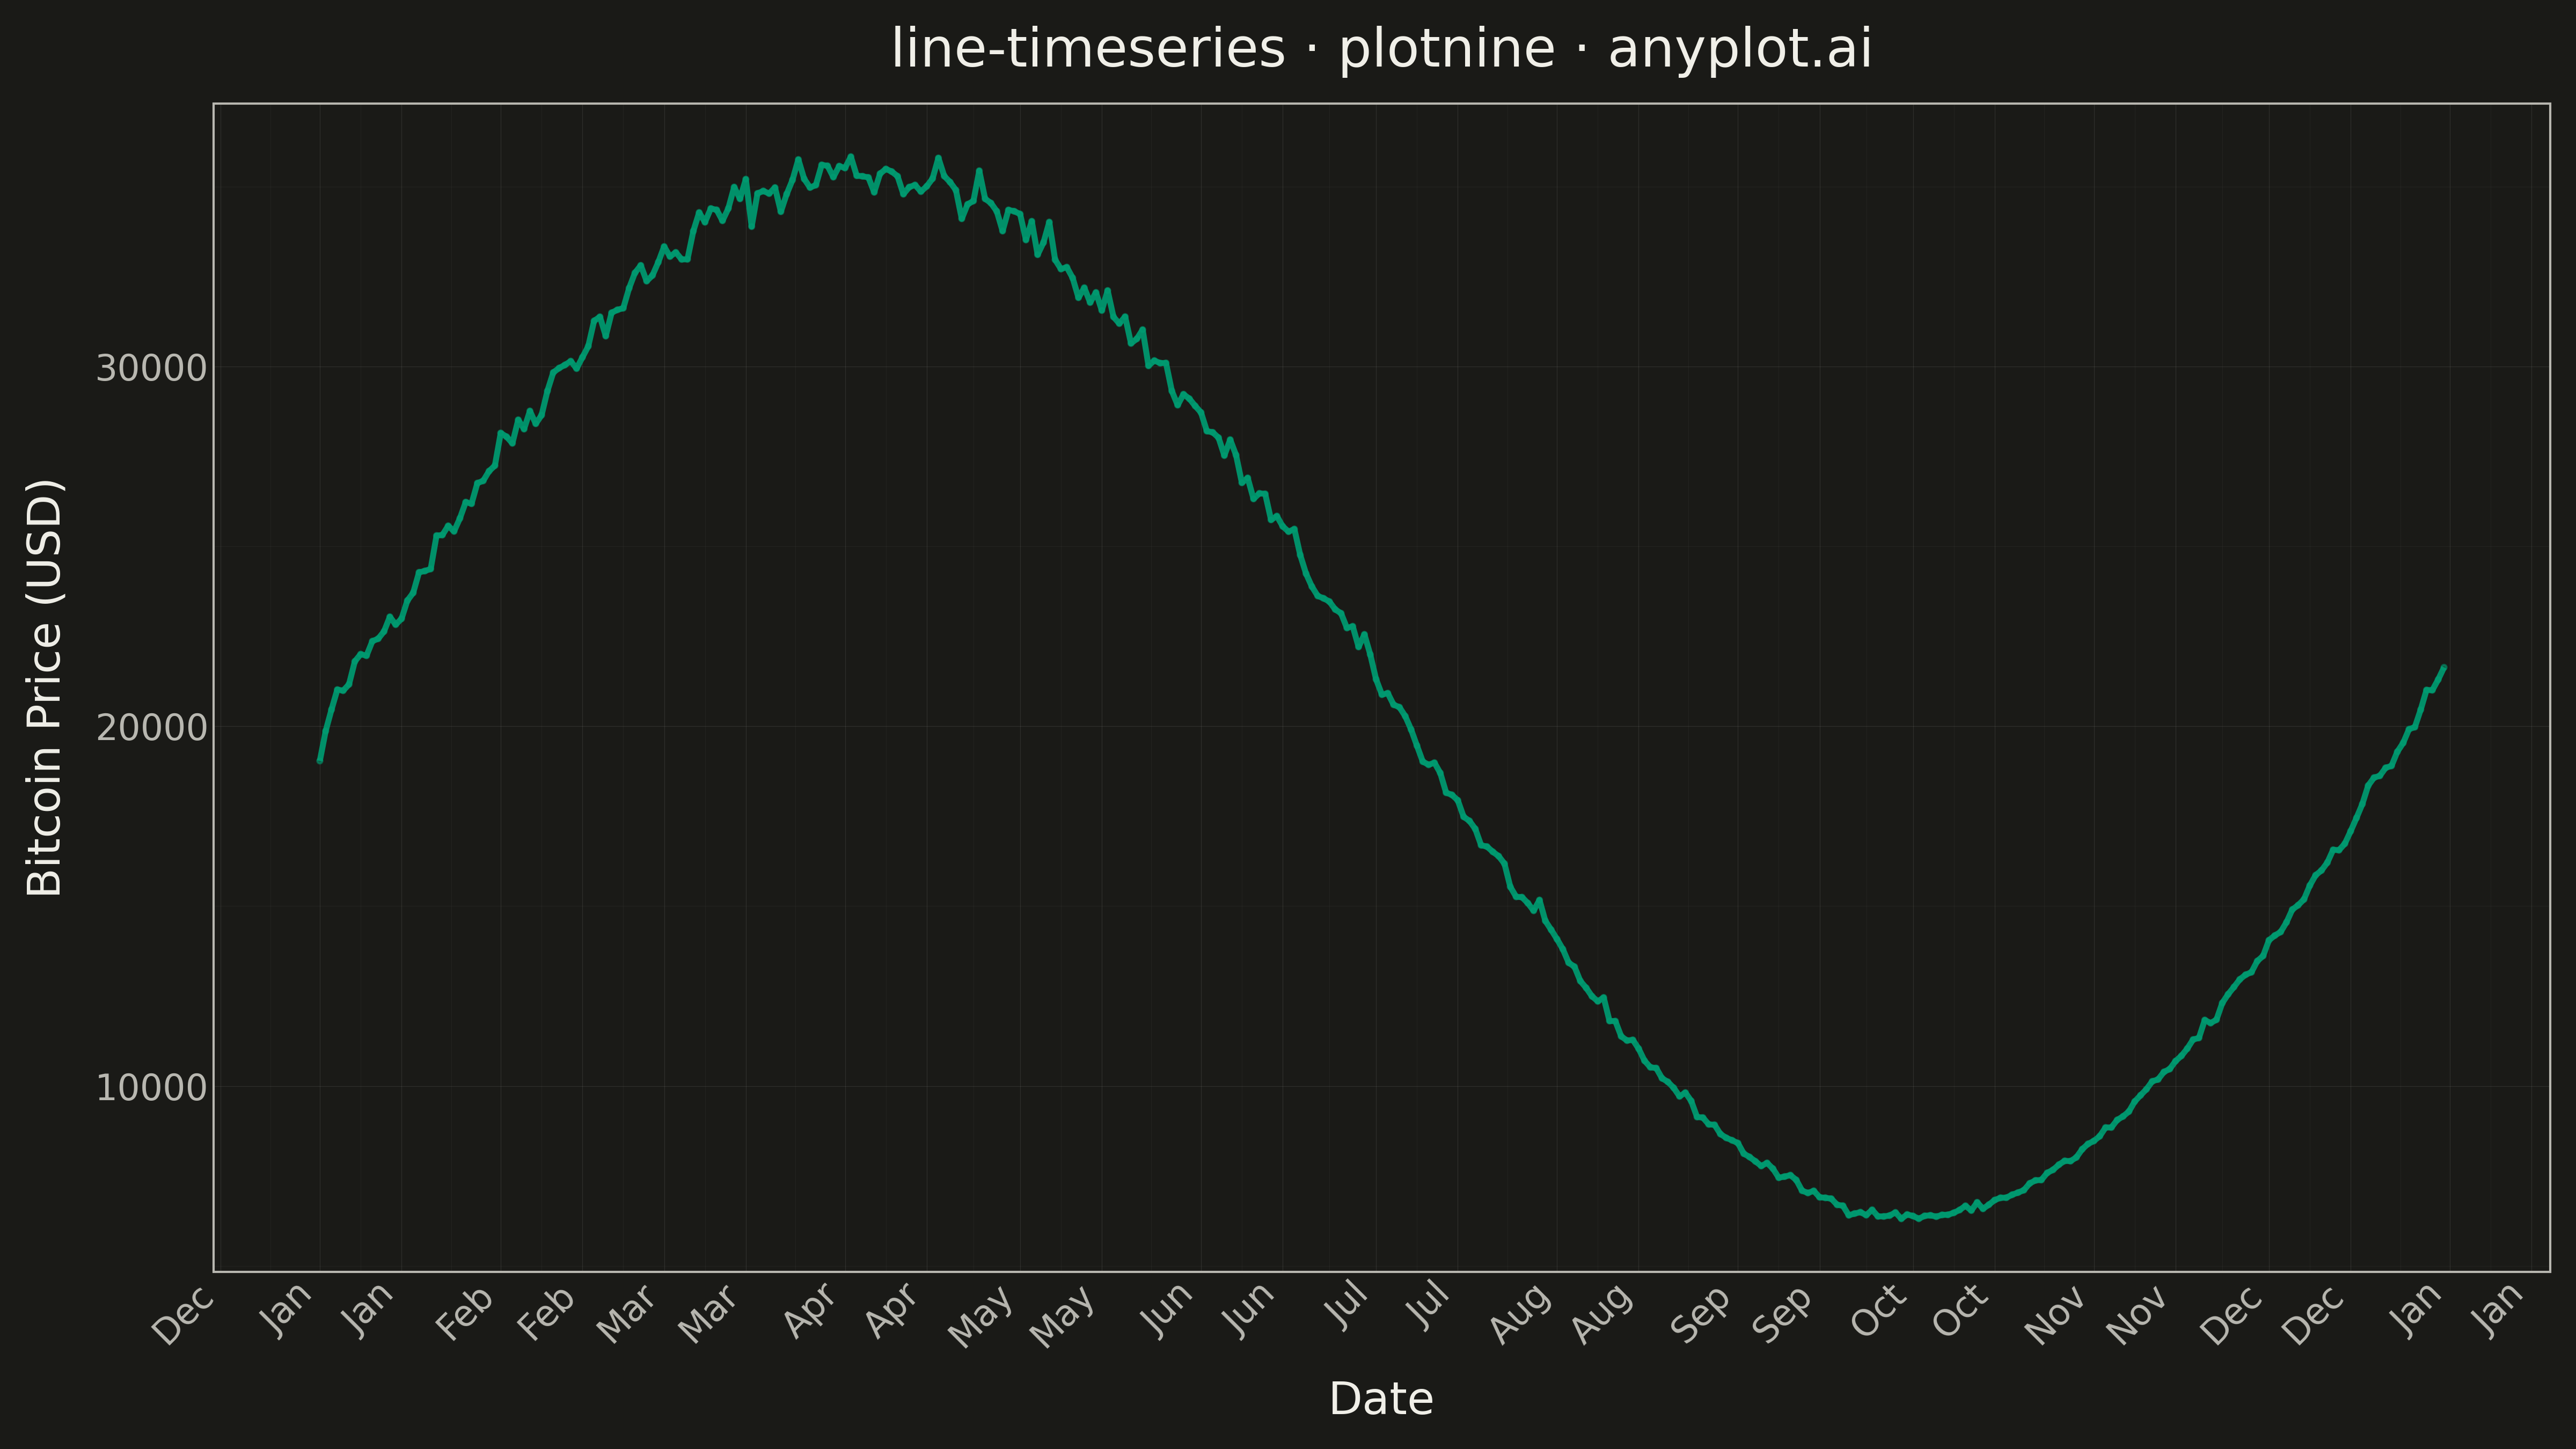
A time series line plot displays data points connected by lines over a datetime x-axis, with smart date formatting that automatically adjusts tick labels based on the time scale (days, months, years). This plot type is essential for temporal data analysis where proper date formatting and readability are critical. Unlike basic line plots, time series plots handle datetime parsing, timezone awareness, and intelligent tick label formatting.
Preview render from the plotnine implementation.