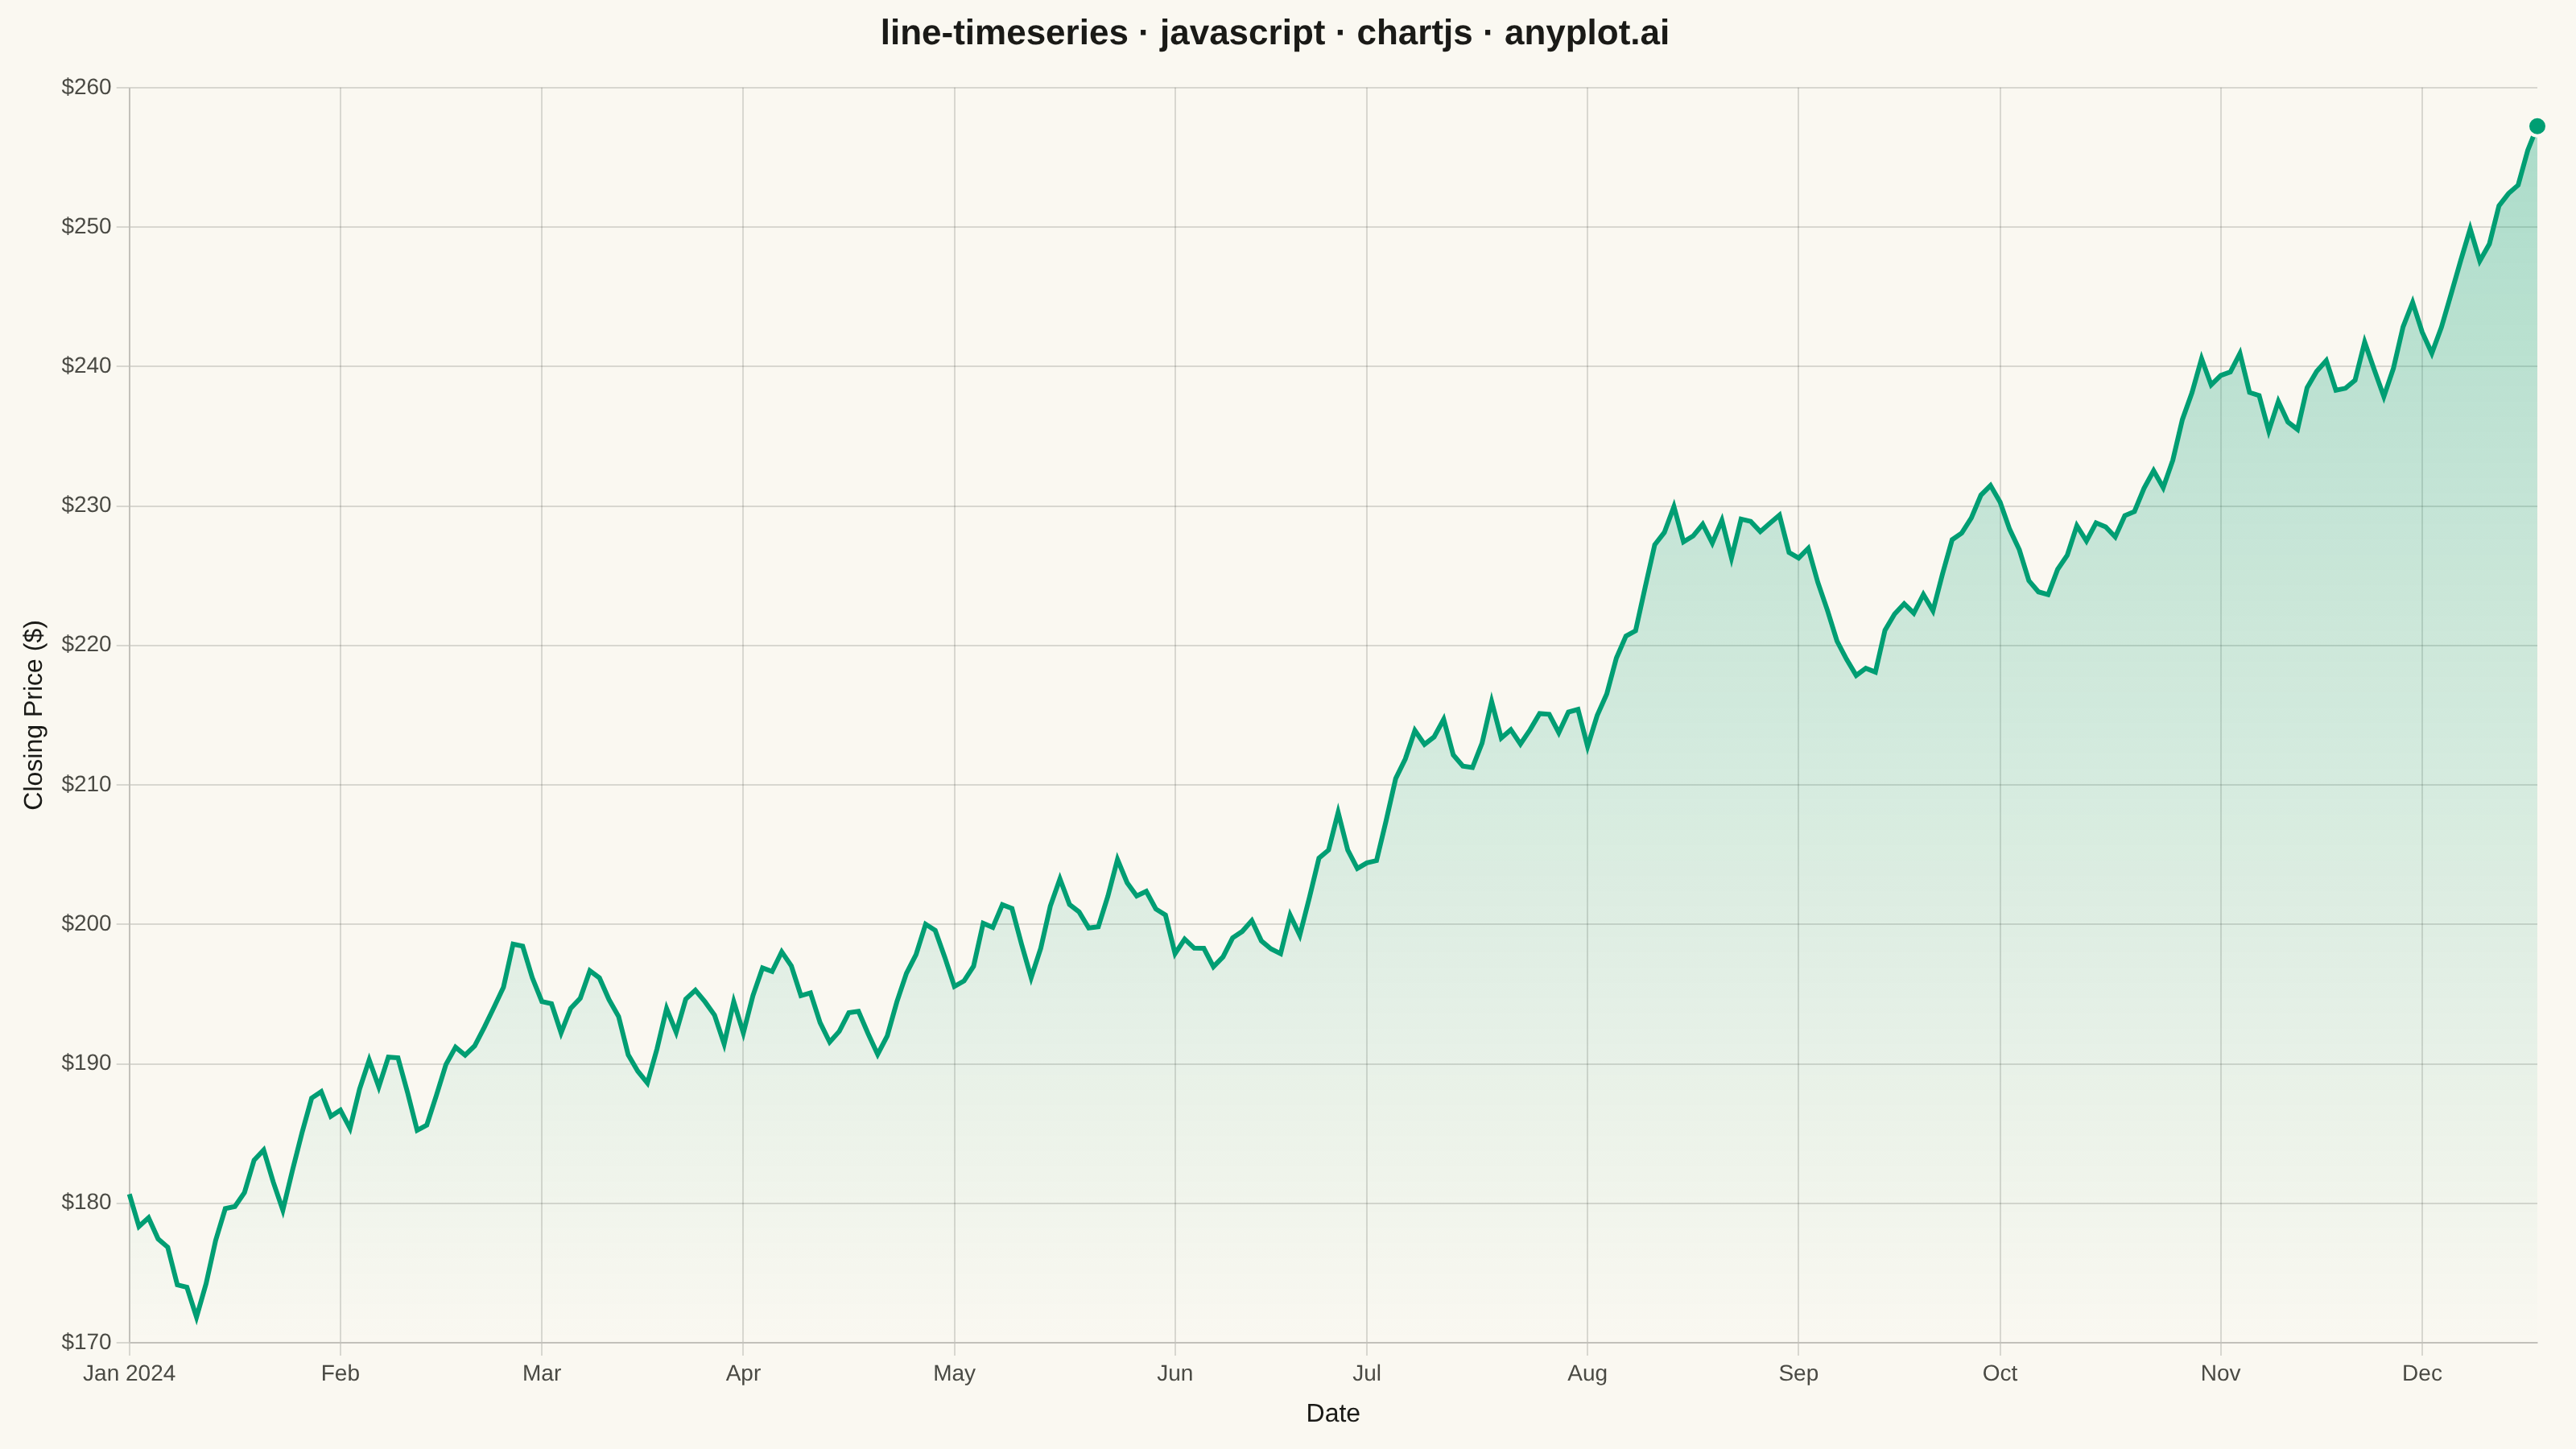
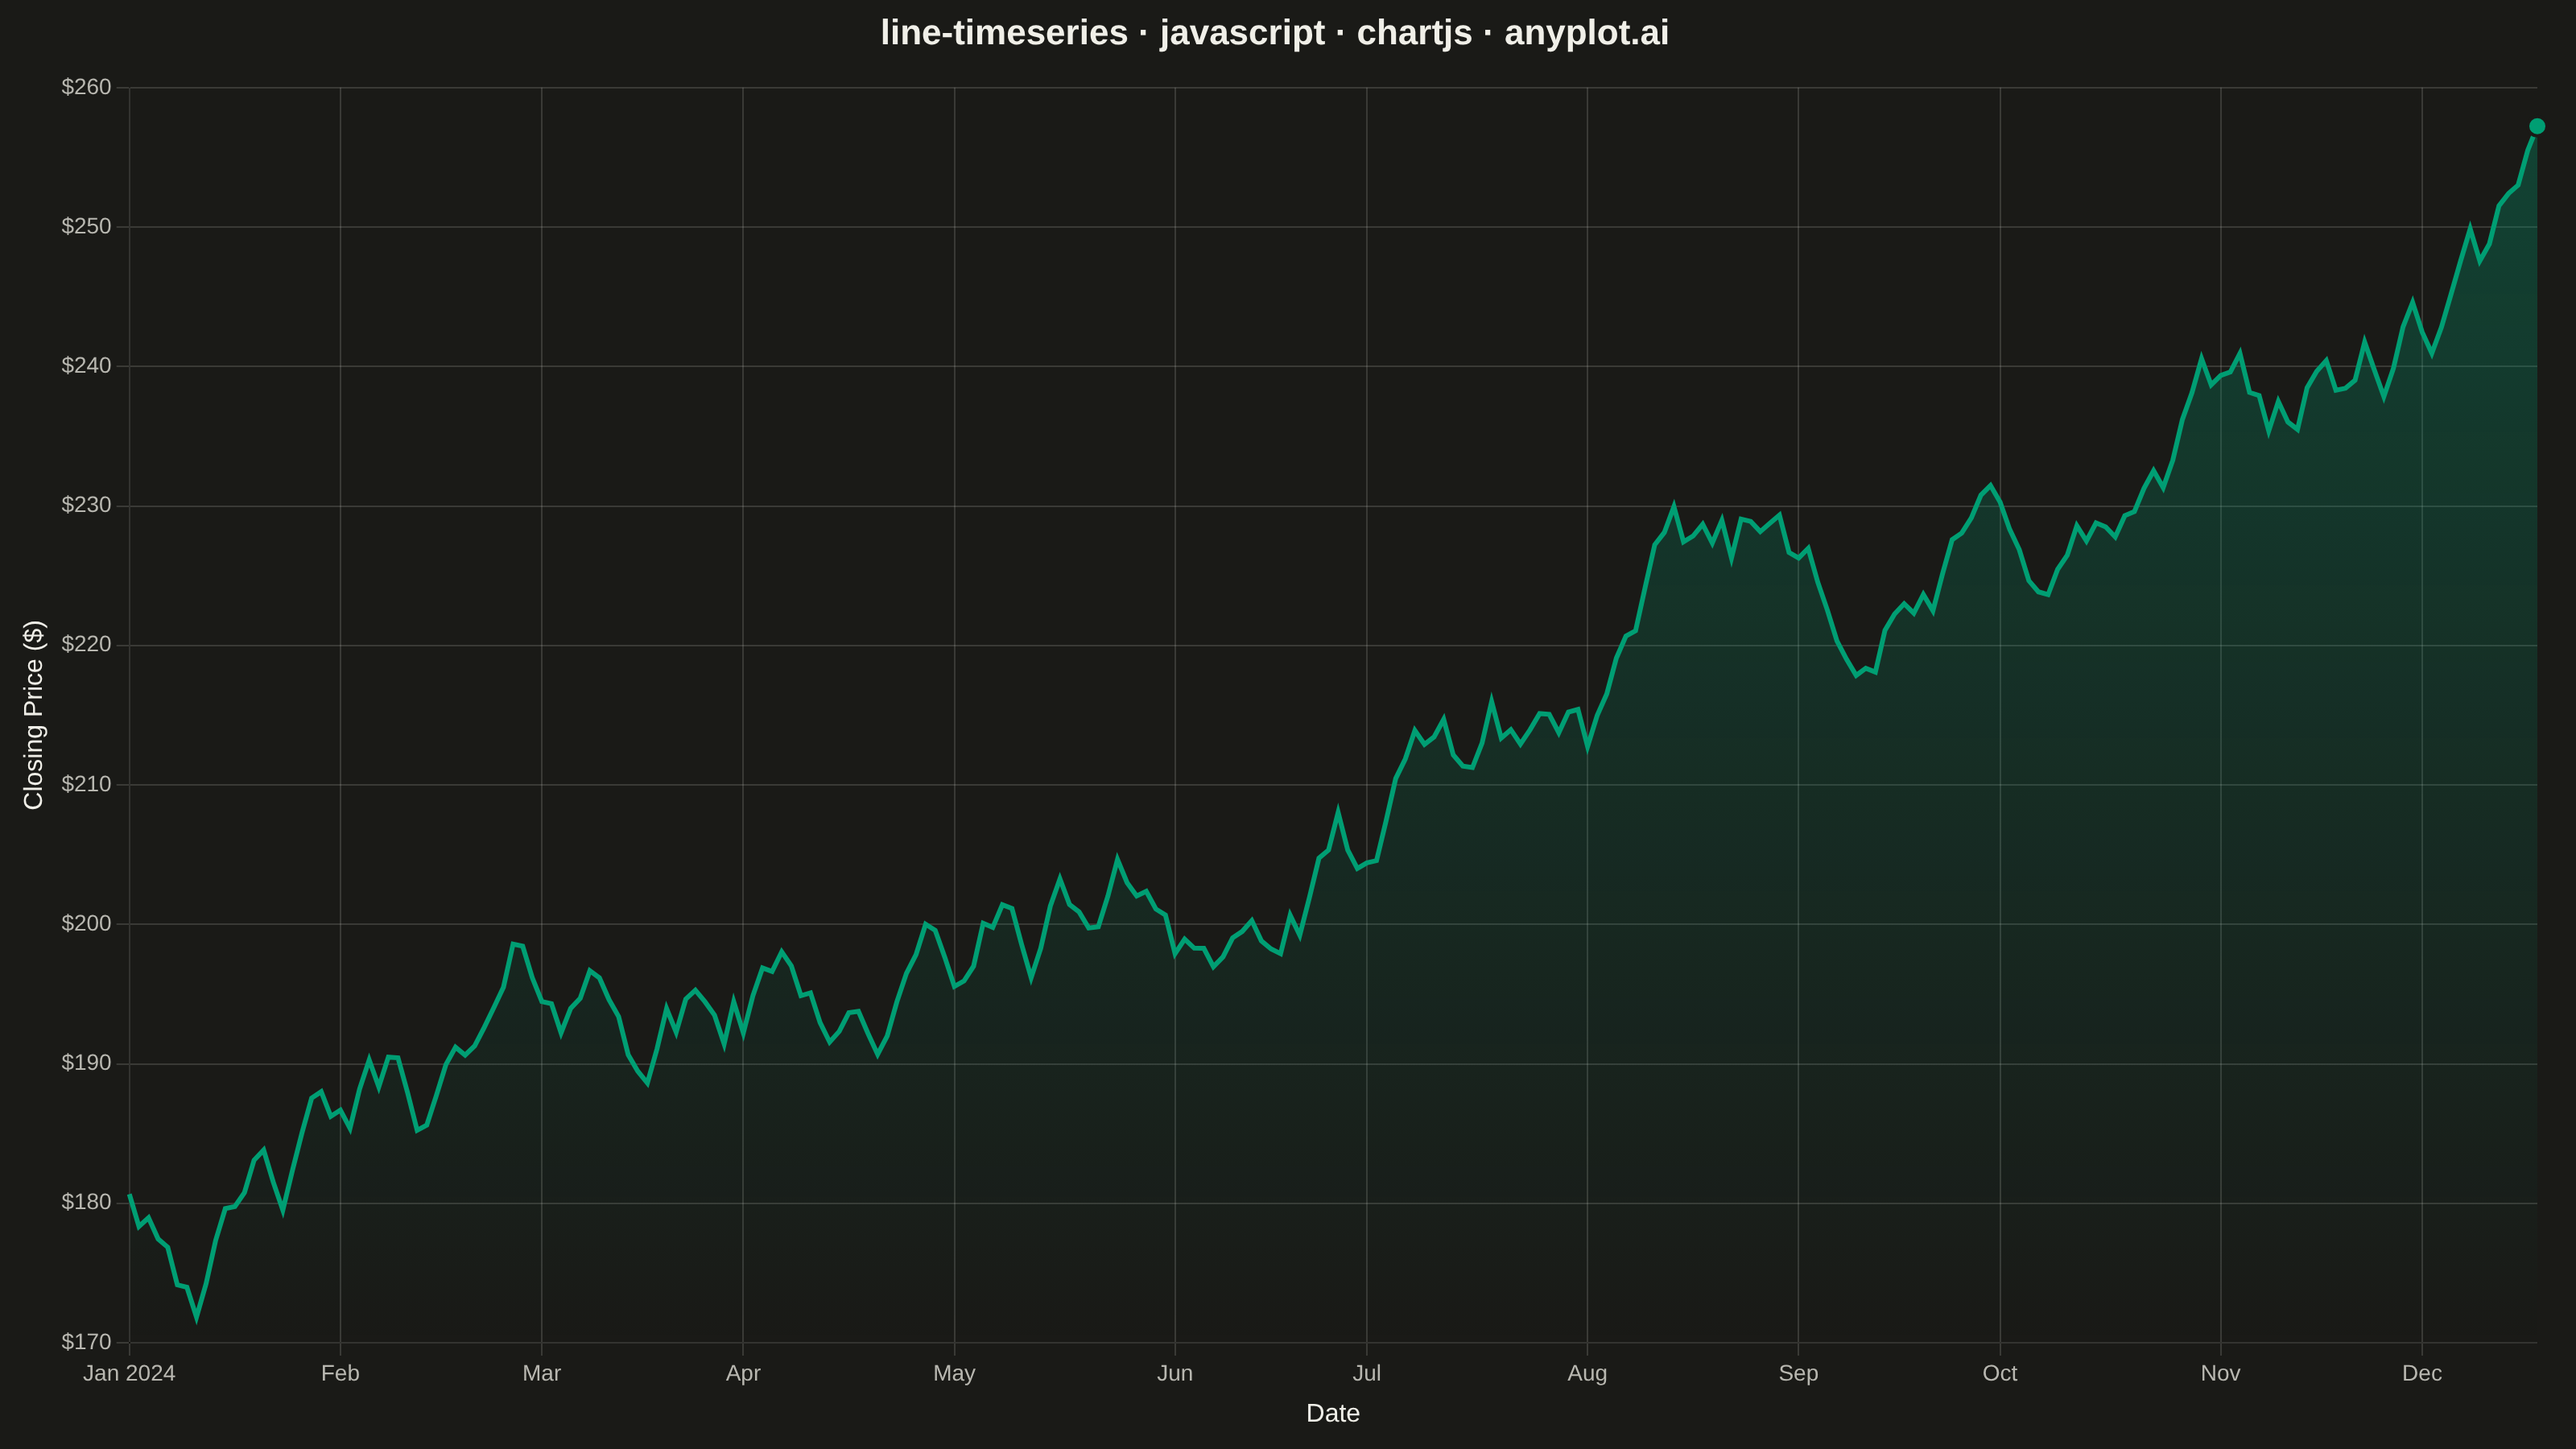
The same plot in 14 other libraries — JavaScript: D3.js, Apache ECharts, Highcharts, MUI X Charts; Python: Altair, Bokeh, lets-plot, Matplotlib, Plotly, plotnine, Pygal, Seaborn; R: ggplot2; Julia: Makie.jl. Compare all 15 side by side: Time Series Line Plot in Python, R, Julia and JavaScript.
A time series line plot displays data points connected by lines over a datetime x-axis, with smart date formatting that automatically adjusts tick labels based on the time scale (days, months, years). This plot type is essential for temporal data analysis where proper date formatting and readability are critical. Unlike basic line plots, time series plots handle datetime parsing, timezone awareness, and intelligent tick label formatting.
// anyplot.ai
// line-timeseries: Time Series Line Plot
// Library: chartjs 4.4.7 | JavaScript 22.23.2
// Quality: 92/100 | Created: 2026-09-05

const t = window.ANYPLOT_TOKENS;

// --- Data (in-memory, deterministic) ----------------------------------------
// Daily closing price of a fictional tech stock across trading days of 2024.
// A tiny fixed-seed LCG stands in for a seeded RNG (the browser has none).
function makeLcg(seed) {
  let state = seed >>> 0;
  return () => {
    state = (state * 1664525 + 1013904223) >>> 0;
    return state / 4294967296;
  };
}
const rand = makeLcg(42);

const dates = [];
const prices = [];
let price = 182;
const cursor = new Date(2024, 0, 2);
while (dates.length < 252) {
  const weekday = cursor.getDay();
  if (weekday !== 0 && weekday !== 6) {
    dates.push(new Date(cursor));
    const shock = (rand() - 0.5) * 6;
    const drift = 0.15;
    price = Math.max(20, price + drift + shock);
    prices.push(Math.round(price * 100) / 100);
  }
  cursor.setDate(cursor.getDate() + 1);
}

const dateLabels = dates.map((d) =>
  d.toLocaleDateString("en-US", { year: "numeric", month: "short", day: "numeric" })
);

// Highlight the year's peak close — a focal point for an otherwise flat line.
const peakIndex = prices.indexOf(Math.max(...prices));

// Brand-green fill fading to transparent, built from the chart's own canvas
// context so it scales with the actual plot area (Chart.js scriptable option).
function hexToRgba(hex, alpha) {
  const n = parseInt(hex.slice(1), 16);
  return `rgba(${(n >> 16) & 255}, ${(n >> 8) & 255}, ${n & 255}, ${alpha})`;
}
function areaGradient({ chart }) {
  const { ctx, chartArea } = chart;
  if (!chartArea) return hexToRgba(t.palette[0], 0);
  const gradient = ctx.createLinearGradient(0, chartArea.top, 0, chartArea.bottom);
  gradient.addColorStop(0, hexToRgba(t.palette[0], 0.32));
  gradient.addColorStop(1, hexToRgba(t.palette[0], 0));
  return gradient;
}

// Smart tick selection: one tick per calendar month, label carries the year
// only at a year boundary (or the very first tick) — Chart.js has no bundled
// date adapter, so the "smart formatting" happens here rather than via a
// `type: 'time'` scale.
const monthTickIndices = new Set();
dates.forEach((d, i) => {
  if (i === 0 || d.getMonth() !== dates[i - 1].getMonth()) monthTickIndices.add(i);
});

// --- Mount -------------------------------------------------------------------
const canvas = document.createElement("canvas");
document.getElementById("container").appendChild(canvas);

// --- Chart ---------------------------------------------------------------
new Chart(canvas, {
  type: "line",
  data: {
    labels: dateLabels,
    datasets: [
      {
        label: "Closing Price ($)",
        data: prices,
        borderColor: t.palette[0],
        backgroundColor: areaGradient,
        borderWidth: 3,
        pointRadius: (ctx) => (ctx.dataIndex === peakIndex ? 6 : 0),
        pointHoverRadius: 4,
        pointBackgroundColor: t.palette[0],
        pointBorderColor: t.pageBg,
        pointBorderWidth: 2,
        fill: true,
        tension: 0,
      },
    ],
  },
  options: {
    responsive: true,
    maintainAspectRatio: false,
    animation: false,
    layout: { padding: { top: 8, right: 24, bottom: 8, left: 8 } },
    plugins: {
      title: {
        display: true,
        text: "line-timeseries · javascript · chartjs · anyplot.ai",
        color: t.ink,
        font: { size: 22 },
        padding: { bottom: 20 },
      },
      legend: { display: false },
      tooltip: {
        callbacks: {
          title: (items) => dateLabels[items[0].dataIndex],
          label: (item) =>
            item.dataIndex === peakIndex
              ? `Closing Price: $${item.parsed.y.toFixed(2)} (year high)`
              : `Closing Price: $${item.parsed.y.toFixed(2)}`,
        },
      },
    },
    scales: {
      x: {
        type: "category",
        afterBuildTicks: (axis) => {
          axis.ticks = axis.ticks.filter((tick) => monthTickIndices.has(tick.value));
        },
        ticks: {
          color: t.inkSoft,
          font: { size: 14 },
          callback: (value) => {
            const d = dates[value];
            const isYearStart = value === 0 || d.getMonth() === 0;
            return isYearStart
              ? d.toLocaleDateString("en-US", { month: "short", year: "numeric" })
              : d.toLocaleDateString("en-US", { month: "short" });
          },
        },
        grid: { color: t.grid },
        title: { display: true, text: "Date", color: t.ink, font: { size: 16 } },
      },
      y: {
        ticks: {
          color: t.inkSoft,
          font: { size: 14 },
          callback: (value) => `$${value}`,
        },
        grid: { color: t.grid },
        title: { display: true, text: "Closing Price ($)", color: t.ink, font: { size: 16 } },
      },
    },
  },
});
Runnable source as JSON, for any HTTP client: https://api.anyplot.ai/specs/line-timeseries/chartjs/code. Any spec id and library id listed in llms-full.txt fit the same URL shape; every URL below is complete and callable.
{
  "spec_id": "line-timeseries",
  "language": "javascript",
  "library": "chartjs",
  "page": "https://anyplot.ai/line-timeseries/javascript/chartjs",
  "hub": "https://anyplot.ai/line-timeseries",
  "code_json": "https://api.anyplot.ai/specs/line-timeseries/chartjs/code",
  "spec_json": "https://api.anyplot.ai/specs/line-timeseries",
  "render_light_png": "https://storage.googleapis.com/anyplot-images/plots/line-timeseries/javascript/chartjs/plot-light.png",
  "render_dark_png": "https://storage.googleapis.com/anyplot-images/plots/line-timeseries/javascript/chartjs/plot-dark.png",
  "interactive_light_html": "https://storage.googleapis.com/anyplot-images/plots/line-timeseries/javascript/chartjs/plot-light.html",
  "interactive_dark_html": "https://storage.googleapis.com/anyplot-images/plots/line-timeseries/javascript/chartjs/plot-dark.html",
  "quality_score": 92.0,
  "license": "MIT",
  "guide": "https://anyplot.ai/llms.txt"
}
Part of Time Series Line Plot on anyplot.ai.