The same plot in 14 other libraries — JavaScript: Chart.js, D3.js, Apache ECharts, MUI X Charts; Python: Altair, Bokeh, lets-plot, Matplotlib, Plotly, plotnine, Pygal, Seaborn; R: ggplot2; Julia: Makie.jl. Compare all 15 side by side: Time Series Line Plot in Python, R, Julia and JavaScript.
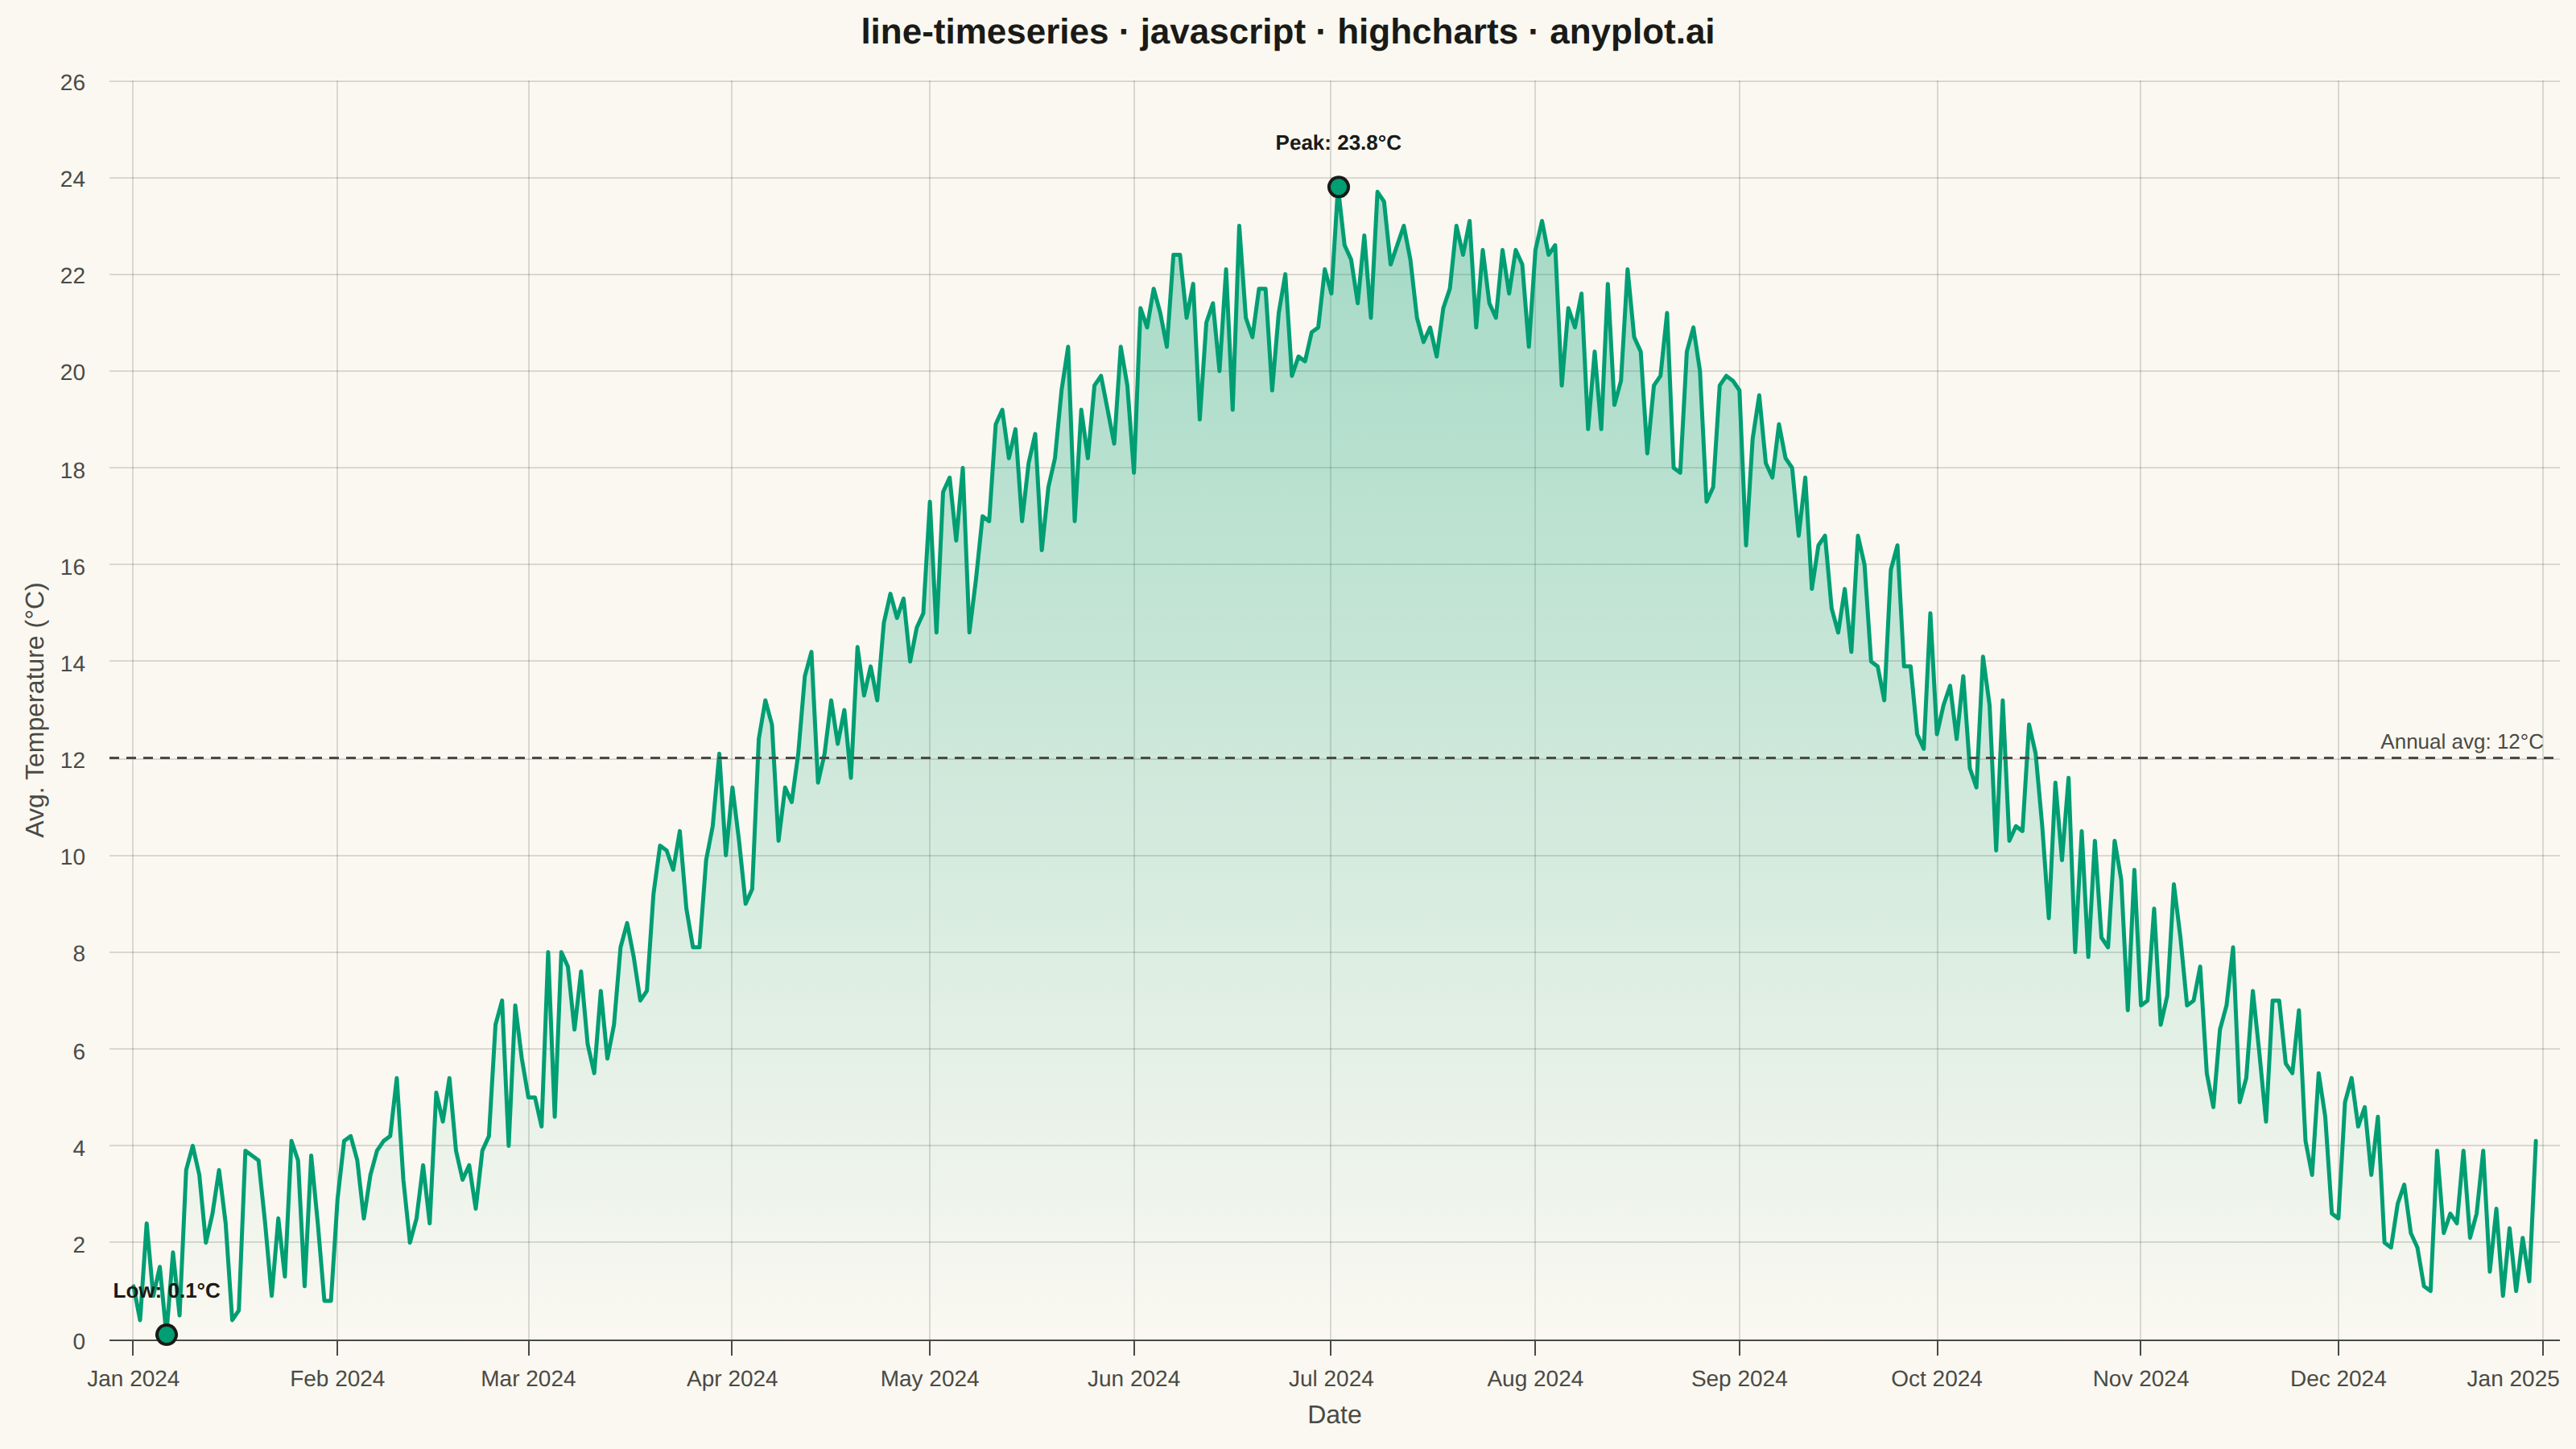
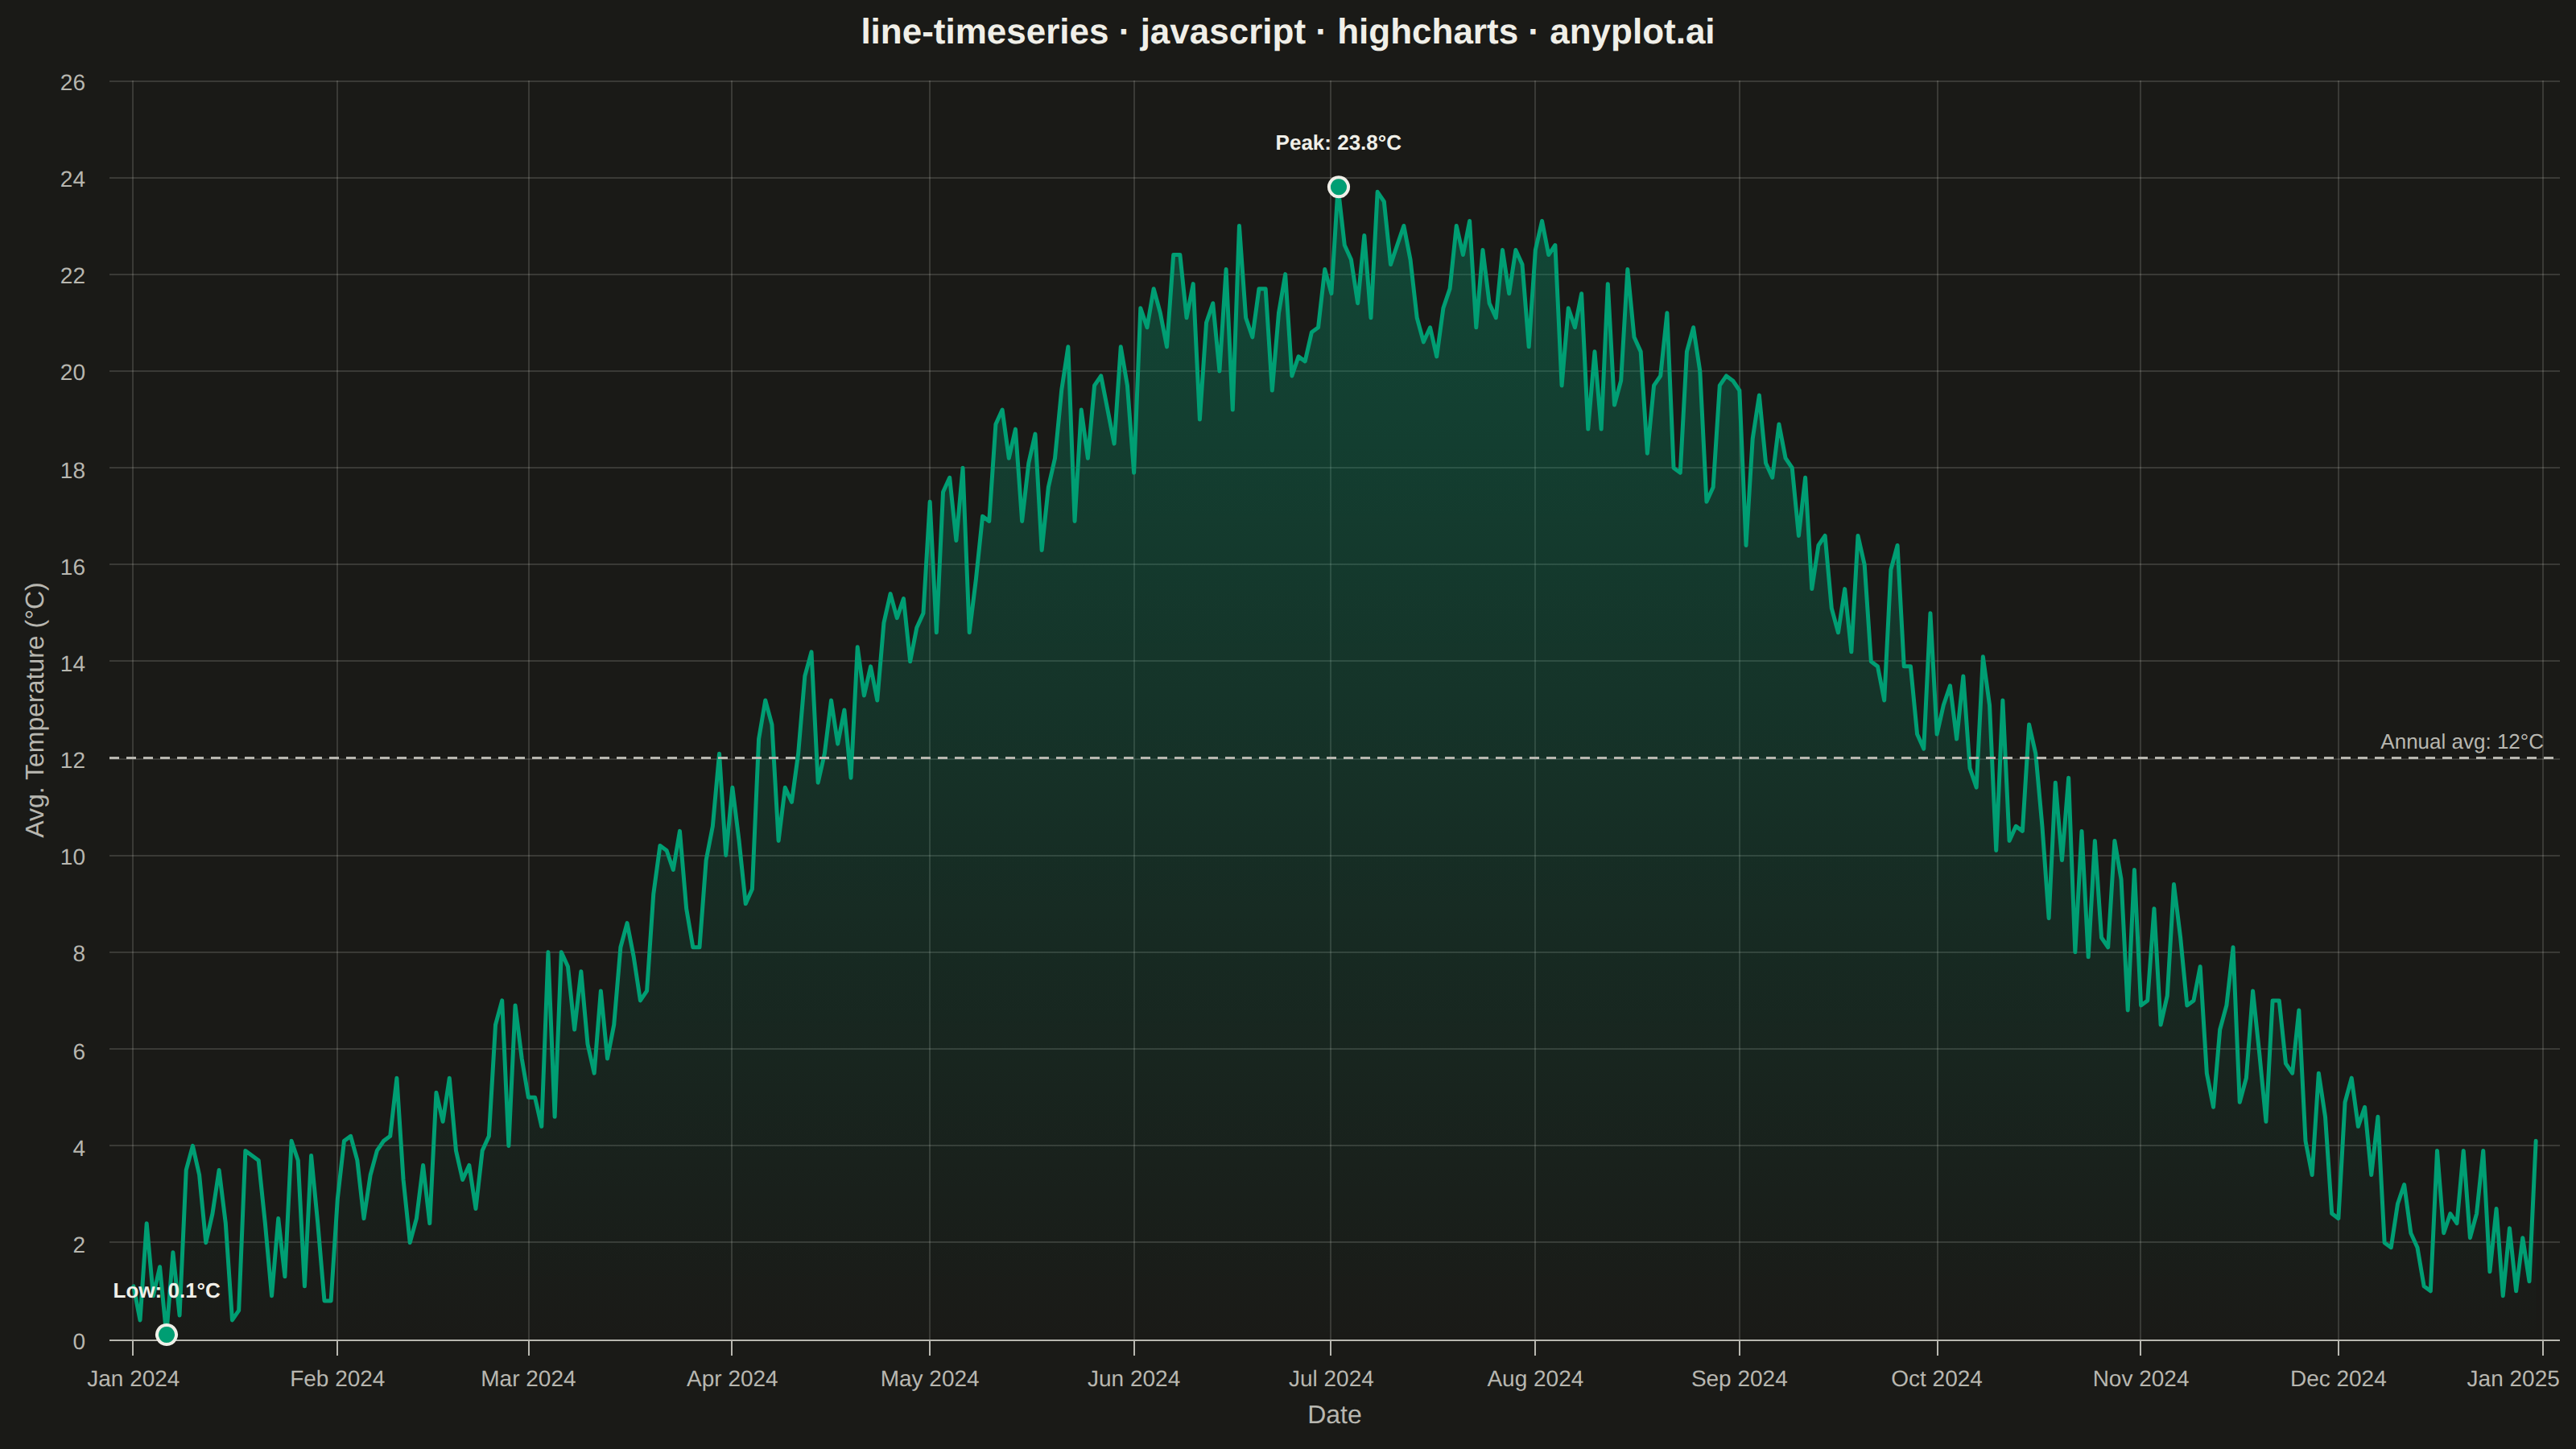
A time series line plot displays data points connected by lines over a datetime x-axis, with smart date formatting that automatically adjusts tick labels based on the time scale (days, months, years). This plot type is essential for temporal data analysis where proper date formatting and readability are critical. Unlike basic line plots, time series plots handle datetime parsing, timezone awareness, and intelligent tick label formatting.
// anyplot.ai
// line-timeseries: Time Series Line Plot
// Library: highcharts 12.6.0 | JavaScript 22.23.2
// Quality: 87/100 | Created: 2026-09-05
//# anyplot-orientation: landscape

const t = window.ANYPLOT_TOKENS;

// --- Data (in-memory, deterministic) ----------------------------------------
// Daily average temperature readings (°C) across 2024 (leap year), with a
// seasonal cycle plus noise from a tiny fixed-seed LCG (no seeded RNG in-browser).
let seed = 42;
function nextRandom() {
  seed = (seed * 1664525 + 1013904223) % 4294967296;
  return seed / 4294967296;
}

const startDate = Date.UTC(2024, 0, 1);
const dayMs = 24 * 3600 * 1000;
const daysInYear = 366;
const temperatures = [];
for (let day = 0; day < daysInYear; day++) {
  const seasonal = 12 + 10 * Math.sin(((day - 100) / 365) * 2 * Math.PI);
  const noise = (nextRandom() - 0.5) * 4;
  const value = Math.round((seasonal + noise) * 10) / 10;
  temperatures.push([startDate + day * dayMs, value]);
}

// Annual mean plus the seasonal peak/trough — called out below as a
// dashed reference line and two flagged points, so the shape isn't just
// implied by the curve.
let sum = 0;
let peak = temperatures[0];
let trough = temperatures[0];
for (const point of temperatures) {
  sum += point[1];
  if (point[1] > peak[1]) peak = point;
  if (point[1] < trough[1]) trough = point;
}
const average = Math.round((sum / temperatures.length) * 10) / 10;

const calloutMarker = {
  enabled: true,
  radius: 6,
  fillColor: t.palette[0],
  lineWidth: 2,
  lineColor: t.ink,
};
const data = temperatures.map((point) => {
  if (point === peak) {
    return {
      x: point[0],
      y: point[1],
      marker: calloutMarker,
      dataLabels: {
        enabled: true,
        format: "Peak: {y}°C",
        y: -16,
        style: { color: t.ink, fontSize: "13px", fontWeight: "600", textOutline: "none" },
      },
    };
  }
  if (point === trough) {
    return {
      x: point[0],
      y: point[1],
      marker: calloutMarker,
      dataLabels: {
        enabled: true,
        format: "Low: {y}°C",
        y: -16,
        style: { color: t.ink, fontSize: "13px", fontWeight: "600", textOutline: "none" },
      },
    };
  }
  return point;
});

// --- Chart -------------------------------------------------------------------
Highcharts.chart("container", {
  chart: {
    type: "area",
    backgroundColor: "transparent",
    animation: false,
    style: { fontFamily: "inherit" },
  },
  credits: { enabled: false },
  colors: t.palette,
  title: {
    text: "line-timeseries · javascript · highcharts · anyplot.ai",
    style: { color: t.ink, fontSize: "22px", fontWeight: "600" },
  },
  xAxis: {
    type: "datetime",
    lineColor: t.inkSoft,
    tickColor: t.inkSoft,
    gridLineColor: t.grid,
    gridLineWidth: 1,
    labels: { style: { color: t.inkSoft, fontSize: "14px" } },
    title: { text: "Date", style: { color: t.inkSoft, fontSize: "16px" } },
  },
  yAxis: {
    title: {
      text: "Avg. Temperature (°C)",
      style: { color: t.inkSoft, fontSize: "16px" },
    },
    gridLineColor: t.grid,
    gridLineWidth: 1,
    labels: { style: { color: t.inkSoft, fontSize: "14px" } },
    plotLines: [
      {
        value: average,
        color: t.inkSoft,
        dashStyle: "Dash",
        width: 1.5,
        zIndex: 5,
        label: {
          text: `Annual avg: ${average}°C`,
          align: "right",
          x: -10,
          y: -6,
          style: { color: t.inkSoft, fontSize: "13px" },
        },
      },
    ],
  },
  legend: { enabled: false },
  plotOptions: {
    series: { animation: false },
    area: {
      lineWidth: 2.5,
      marker: { enabled: false },
      dataLabels: { enabled: false },
      fillColor: {
        linearGradient: { x1: 0, y1: 0, x2: 0, y2: 1 },
        stops: [
          [0, Highcharts.color(t.palette[0]).setOpacity(0.35).get("rgba")],
          [1, Highcharts.color(t.palette[0]).setOpacity(0).get("rgba")],
        ],
      },
    },
  },
  series: [
    {
      name: "Avg. Temperature",
      data,
    },
  ],
});
Runnable source as JSON, for any HTTP client: https://api.anyplot.ai/specs/line-timeseries/highcharts/code. Any spec id and library id listed in llms-full.txt fit the same URL shape; every URL below is complete and callable.
{
  "spec_id": "line-timeseries",
  "language": "javascript",
  "library": "highcharts",
  "page": "https://anyplot.ai/line-timeseries/javascript/highcharts",
  "hub": "https://anyplot.ai/line-timeseries",
  "code_json": "https://api.anyplot.ai/specs/line-timeseries/highcharts/code",
  "spec_json": "https://api.anyplot.ai/specs/line-timeseries",
  "render_light_png": "https://storage.googleapis.com/anyplot-images/plots/line-timeseries/javascript/highcharts/plot-light.png",
  "render_dark_png": "https://storage.googleapis.com/anyplot-images/plots/line-timeseries/javascript/highcharts/plot-dark.png",
  "interactive_light_html": "https://storage.googleapis.com/anyplot-images/plots/line-timeseries/javascript/highcharts/plot-light.html",
  "interactive_dark_html": "https://storage.googleapis.com/anyplot-images/plots/line-timeseries/javascript/highcharts/plot-dark.html",
  "quality_score": 87.0,
  "license": "MIT",
  "guide": "https://anyplot.ai/llms.txt"
}
Part of Time Series Line Plot on anyplot.ai.