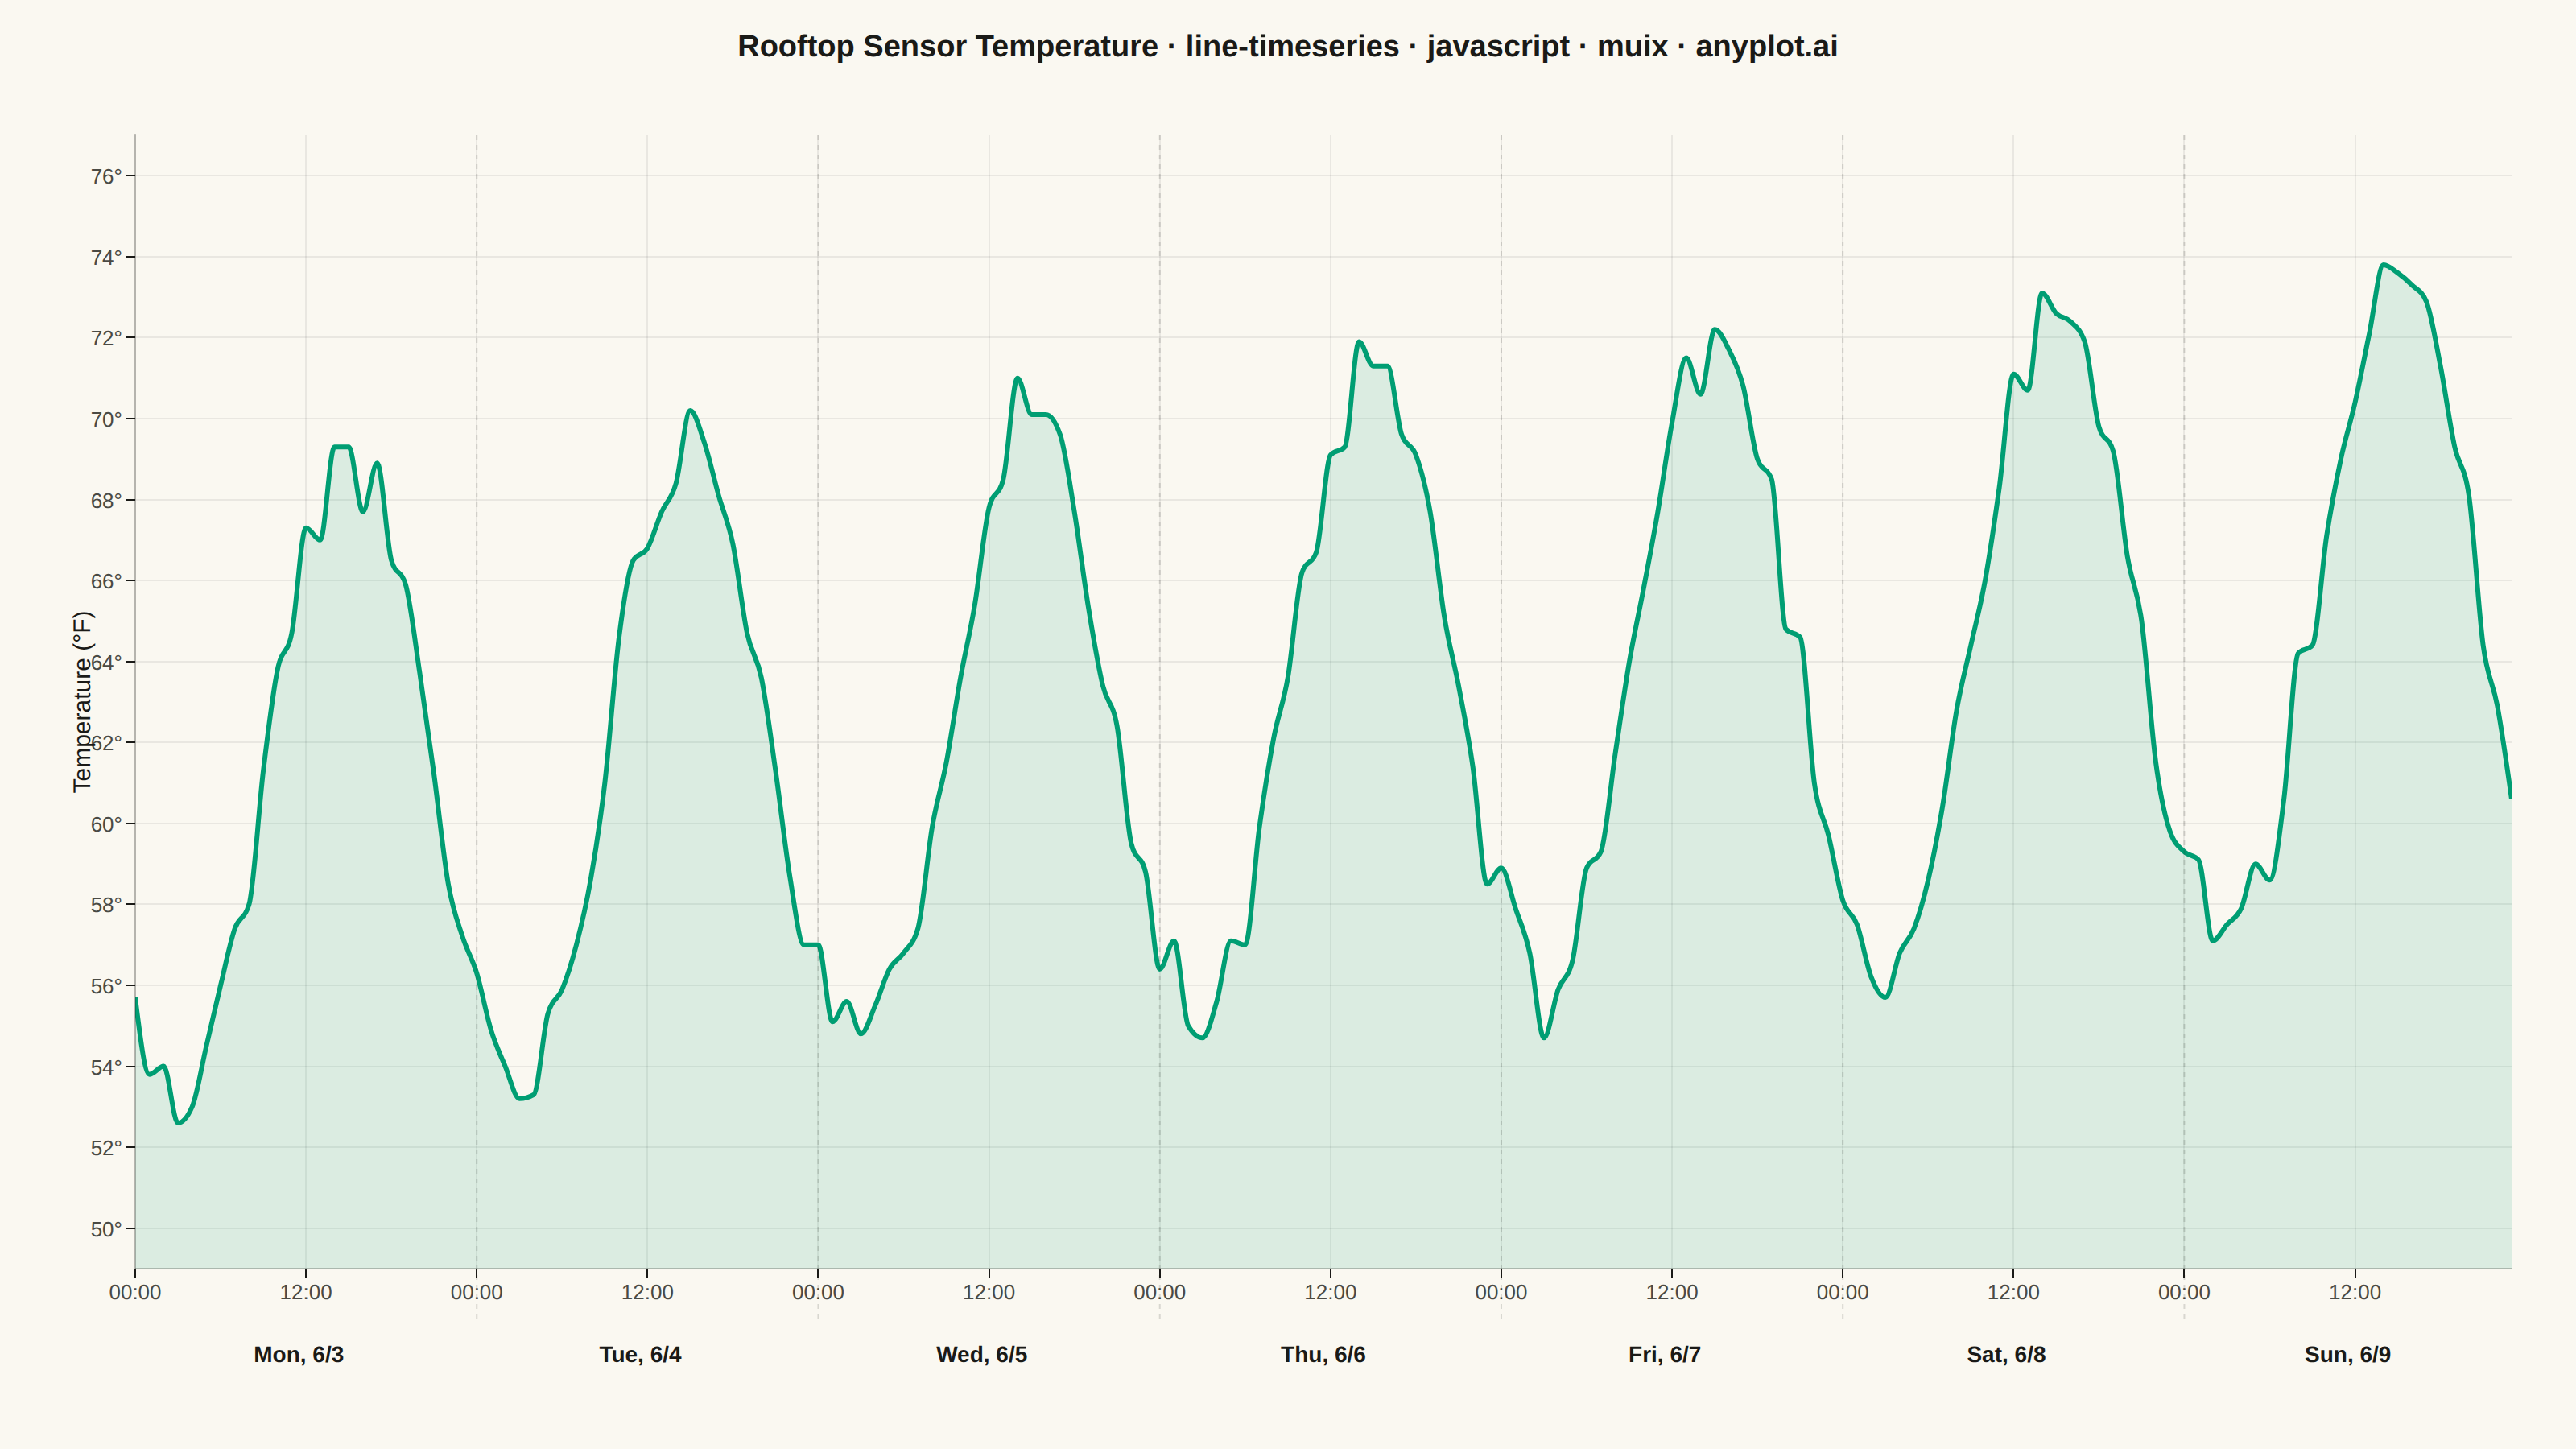
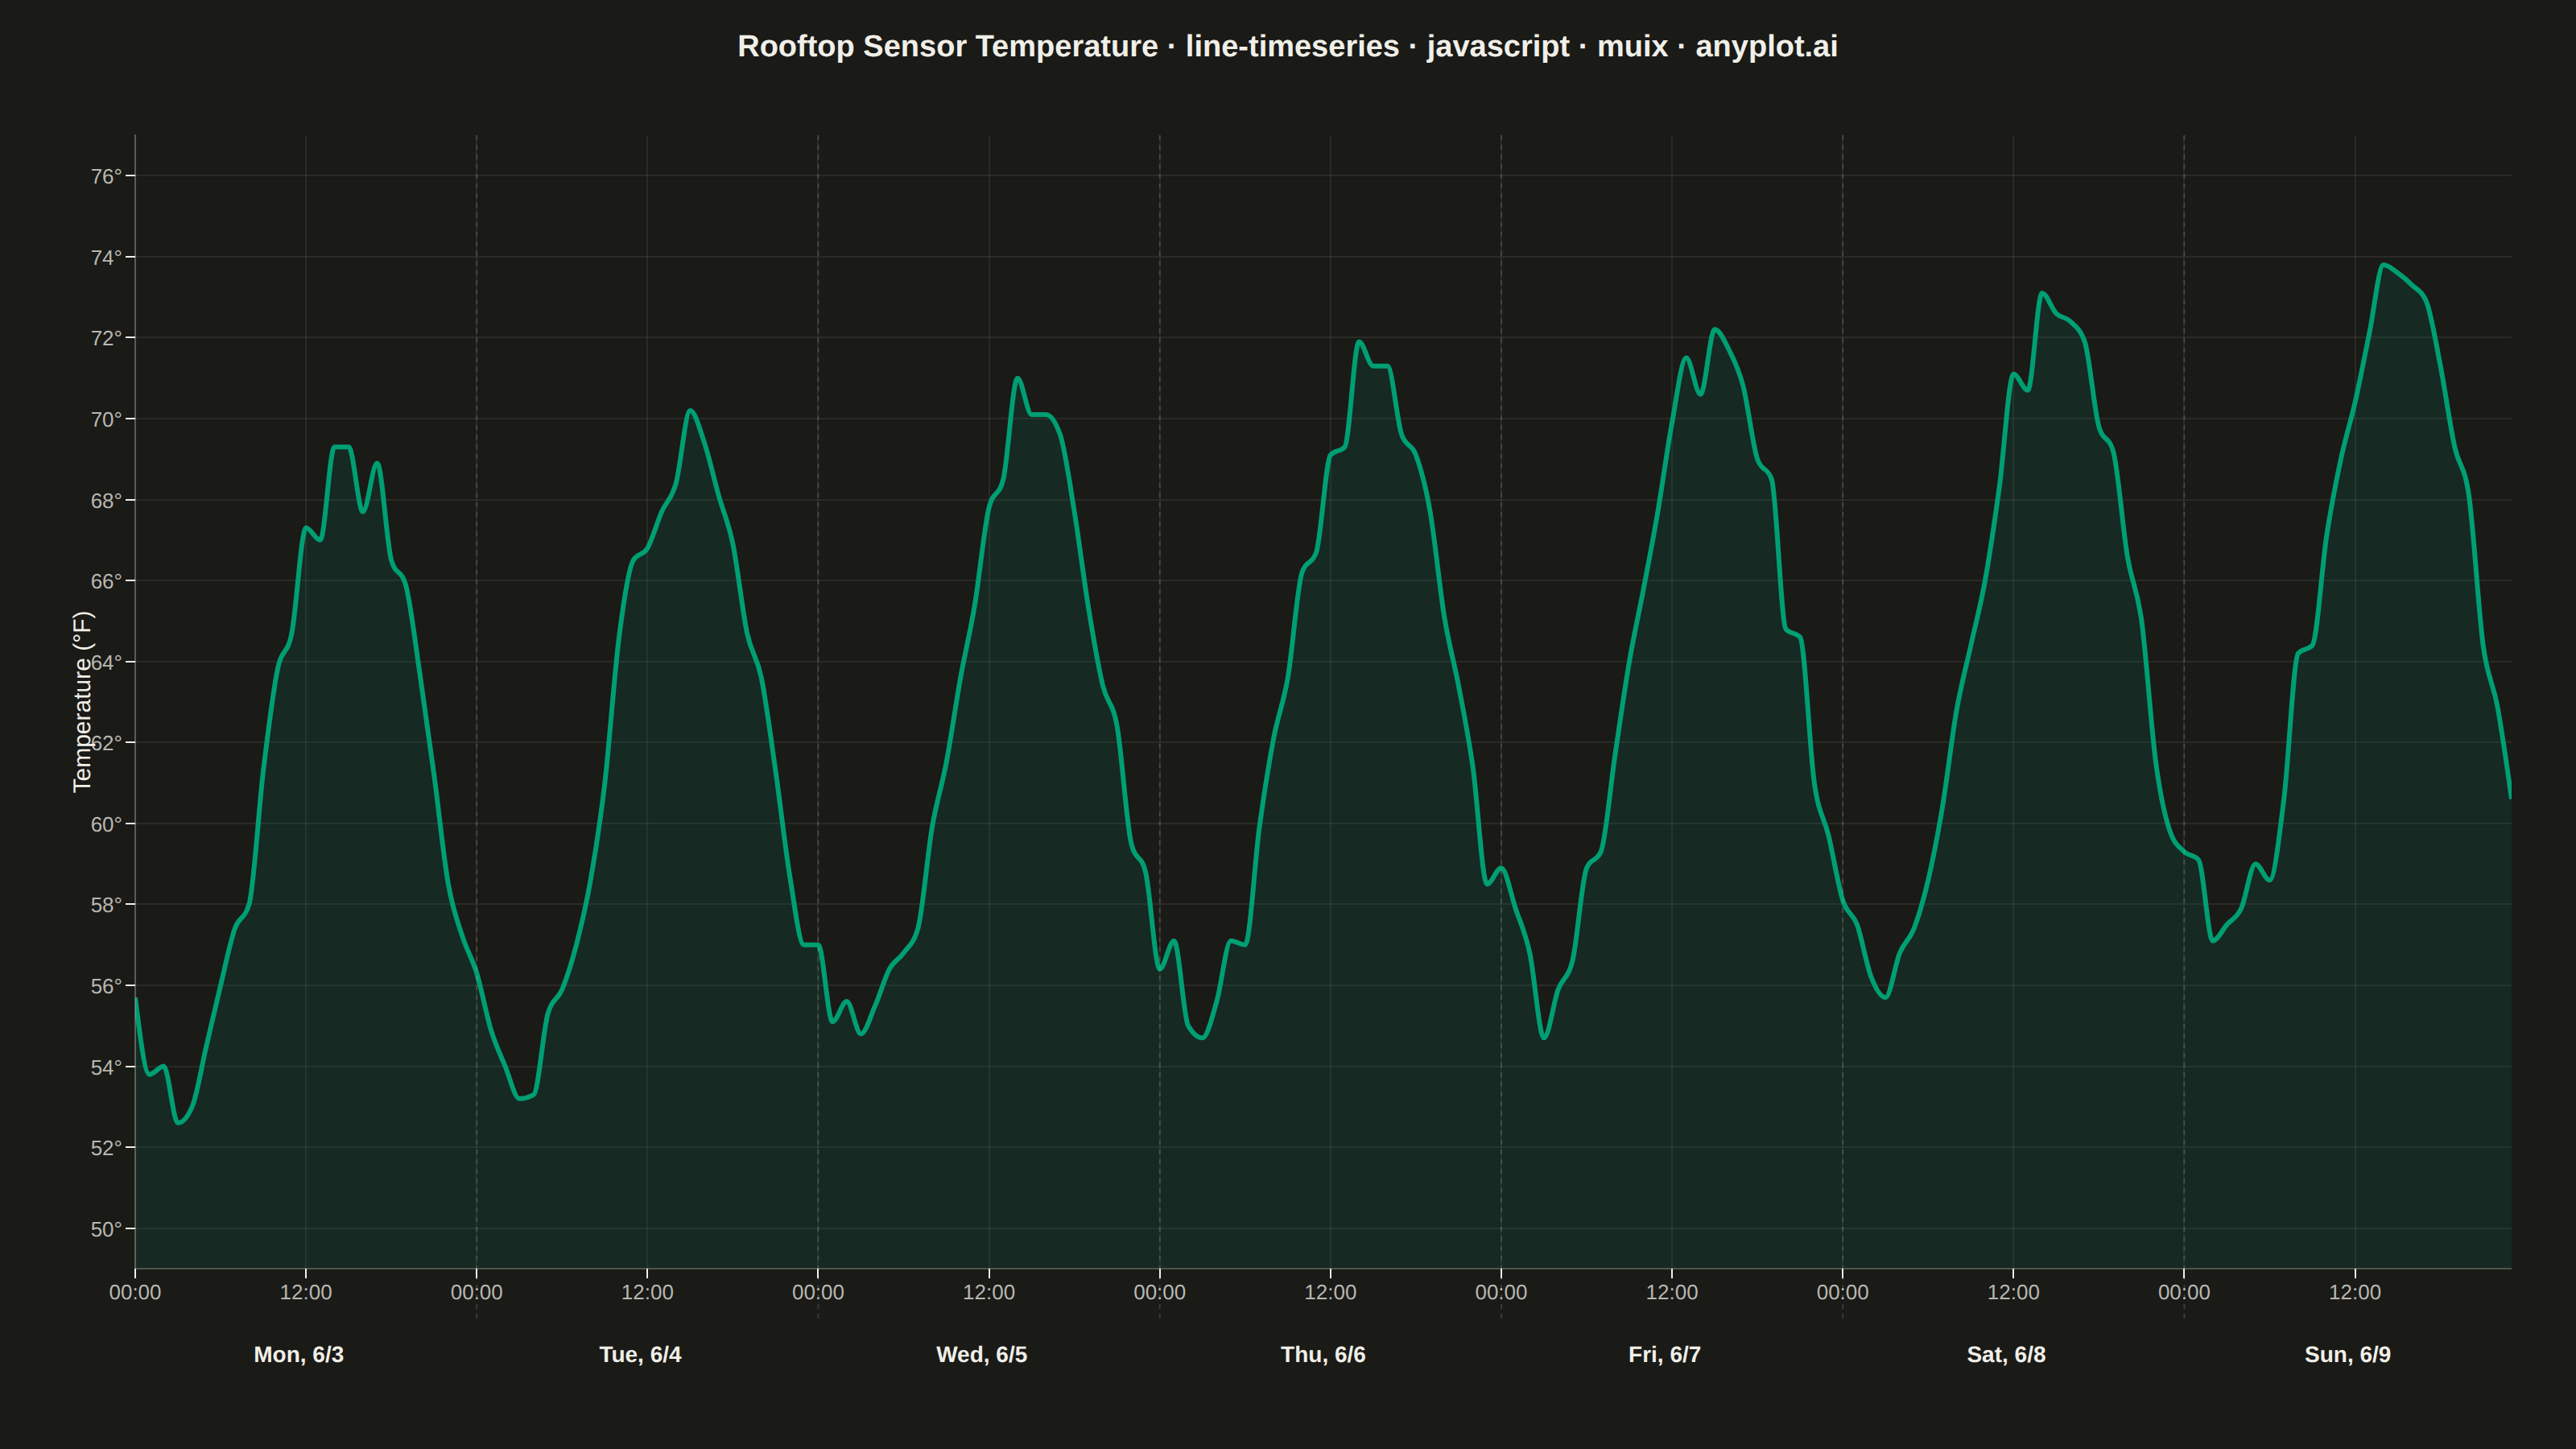
The same plot in 14 other libraries — JavaScript: Chart.js, D3.js, Apache ECharts, Highcharts; Python: Altair, Bokeh, lets-plot, Matplotlib, Plotly, plotnine, Pygal, Seaborn; R: ggplot2; Julia: Makie.jl. Compare all 15 side by side: Time Series Line Plot in Python, R, Julia and JavaScript.
A time series line plot displays data points connected by lines over a datetime x-axis, with smart date formatting that automatically adjusts tick labels based on the time scale (days, months, years). This plot type is essential for temporal data analysis where proper date formatting and readability are critical. Unlike basic line plots, time series plots handle datetime parsing, timezone awareness, and intelligent tick label formatting.
// anyplot.ai
// line-timeseries: Time Series Line Plot
// Library: muix 7.29.1 | JavaScript 22.23.2
// Quality: 89/100 | Created: 2026-09-05

import { LineChart } from "@mui/x-charts/LineChart";
import { useXScale, useDrawingArea } from "@mui/x-charts/hooks";
import Box from "@mui/material/Box";
import Typography from "@mui/material/Typography";

const t = window.ANYPLOT_TOKENS;

// --- Data (in-memory, deterministic LCG PRNG — no fetch, no Math.random) ----
let seed = 11;
function rand() {
  seed = (seed * 1103515245 + 12345) & 0x7fffffff;
  return seed / 0x7fffffff;
}

const DAYS = 7;
const HOURS = DAYS * 24; // hourly rooftop sensor readings for one week
const timestamps: Date[] = [];
const start = new Date(2024, 5, 3, 0, 0); // Mon Jun 3, 2024, 00:00
for (let i = 0; i < HOURS; i++) {
  timestamps.push(new Date(start.getTime() + i * 3_600_000));
}

// Diurnal cycle (peak mid-afternoon, trough before dawn) plus a gentle
// week-long warm-up and hour-to-hour sensor noise.
const temperatures: number[] = [];
for (let i = 0; i < HOURS; i++) {
  const hourOfDay = i % 24;
  const dayIndex = Math.floor(i / 24);
  const diurnal = 8 * Math.sin(((hourOfDay - 9) / 24) * 2 * Math.PI);
  const weekWarmup = dayIndex * 0.7;
  const noise = (rand() - 0.5) * 2.2;
  temperatures.push(Math.round((61 + diurnal + weekWarmup + noise) * 10) / 10);
}

const minTemp = Math.min(...temperatures);
const maxTemp = Math.max(...temperatures);
const tempRange = maxTemp - minTemp;
const Y_MIN = Math.floor(minTemp - tempRange * 0.15);
const Y_MAX = Math.ceil(maxTemp + tempRange * 0.15);

// Midnight and noon get a fine "%H:%M" tick — enough to anchor the diurnal
// shape without the row collapsing into an unreadable smear once the PNG is
// downscaled for mobile/thumbnail previews.
const HOUR_TICK_STEP = 12;

// Day-boundary indices anchor the coarser weekday row drawn below the axis.
const dayStartIndices = timestamps.map((_, i) => i).filter((i) => i % 24 === 0);

// Two-tier date axis: MUI X community has no built-in multi-scale date
// formatter (the kind d3-time-format's `multiFormat` gives you), so the
// intelligent adaptation the spec calls for — fine "%H:%M" ticks nested
// under a coarser weekday/date row — is composed by hand against the shared
// xAxis scale via useXScale/useDrawingArea, the documented ChartContainer
// composition pattern for marks outside the community surface.
function DayBoundaries() {
  const xScale = useXScale() as any;
  const drawingArea = useDrawingArea();
  if (!xScale) return null;

  const bottom = drawingArea.top + drawingArea.height;

  return (
    <g>
      {dayStartIndices.map((dayStart) => {
        const dayEnd = Math.min(dayStart + 23, HOURS - 1);
        const xStart = xScale(timestamps[dayStart]);
        const xEnd = xScale(timestamps[dayEnd]);
        const label = timestamps[dayStart].toLocaleDateString("en-US", {
          weekday: "short",
          month: "numeric",
          day: "numeric",
        });

        return (
          <g key={dayStart}>
            {dayStart > 0 && (
              <line
                x1={xStart}
                y1={drawingArea.top}
                x2={xStart}
                y2={bottom + 34}
                stroke={t.grid}
                strokeWidth={1}
                strokeDasharray="3 3"
              />
            )}
            <text
              x={(xStart + xEnd) / 2}
              y={bottom + 58}
              textAnchor="middle"
              fontSize={14}
              fontWeight={600}
              fill={t.ink}
            >
              {label}
            </text>
          </g>
        );
      })}
    </g>
  );
}

const TITLE =
  "Rooftop Sensor Temperature · line-timeseries · javascript · muix · anyplot.ai";

// --- Chart (default-exported component — the harness mounts it) -----------
export default function Chart() {
  const W = window.ANYPLOT_SIZE.width;
  const H = window.ANYPLOT_SIZE.height;
  const titleSize =
    TITLE.length > 67 ? Math.max(14, Math.round((22 * 67) / TITLE.length)) : 22;

  const TITLE_H = 60;
  const chartH = H - TITLE_H;

  return (
    <Box
      sx={{
        width: W,
        height: H,
        bgcolor: t.pageBg,
        display: "flex",
        flexDirection: "column",
        fontFamily: "'Roboto', 'Helvetica Neue', Arial, sans-serif",
        boxSizing: "border-box",
      }}
    >
      <Box
        sx={{
          height: TITLE_H,
          display: "flex",
          alignItems: "center",
          justifyContent: "center",
        }}
      >
        <Typography sx={{ color: t.ink, fontSize: titleSize, fontWeight: 600 }}>
          {TITLE}
        </Typography>
      </Box>

      <LineChart
        width={W}
        height={chartH}
        skipAnimation
        series={[
          {
            id: "temperature",
            data: temperatures,
            showMark: false,
            area: true,
            color: t.palette[0],
            valueFormatter: (v: number | null) =>
              v == null ? "" : `${v.toFixed(1)}°F`,
          },
        ]}
        xAxis={[
          {
            data: timestamps,
            scaleType: "point",
            valueFormatter: (d: Date) =>
              d.toLocaleTimeString("en-GB", {
                hour: "2-digit",
                minute: "2-digit",
              }),
            tickInterval: (_value: Date, index: number) =>
              index % HOUR_TICK_STEP === 0,
            tickLabelStyle: { fontSize: 13, fill: t.inkSoft },
          },
        ]}
        yAxis={[
          {
            label: "Temperature (°F)",
            min: Y_MIN,
            max: Y_MAX,
            valueFormatter: (v: number) => `${Math.round(v)}°`,
            labelStyle: { fontSize: 15, fill: t.ink },
            tickLabelStyle: { fontSize: 13, fill: t.inkSoft },
          },
        ]}
        grid={{ horizontal: true, vertical: true }}
        slotProps={{ legend: { hidden: true } }}
        margin={{ top: 24, right: 40, bottom: 112, left: 84 }}
        sx={{
          "& .MuiLineElement-root": { strokeWidth: 3 },
          "& .MuiAreaElement-root": { fill: t.palette[0], fillOpacity: 0.12 },
          "& .MuiChartsAxis-line": { stroke: t.inkSoft, strokeOpacity: 0.25 },
          "& .MuiChartsGrid-line": { stroke: t.grid, strokeOpacity: 0.5 },
        }}
      >
        <DayBoundaries />
      </LineChart>
    </Box>
  );
}
Runnable source as JSON, for any HTTP client: https://api.anyplot.ai/specs/line-timeseries/muix/code. Any spec id and library id listed in llms-full.txt fit the same URL shape; every URL below is complete and callable.
{
  "spec_id": "line-timeseries",
  "language": "javascript",
  "library": "muix",
  "page": "https://anyplot.ai/line-timeseries/javascript/muix",
  "hub": "https://anyplot.ai/line-timeseries",
  "code_json": "https://api.anyplot.ai/specs/line-timeseries/muix/code",
  "spec_json": "https://api.anyplot.ai/specs/line-timeseries",
  "render_light_png": "https://storage.googleapis.com/anyplot-images/plots/line-timeseries/javascript/muix/plot-light.png",
  "render_dark_png": "https://storage.googleapis.com/anyplot-images/plots/line-timeseries/javascript/muix/plot-dark.png",
  "interactive_light_html": "https://storage.googleapis.com/anyplot-images/plots/line-timeseries/javascript/muix/plot-light.html",
  "interactive_dark_html": "https://storage.googleapis.com/anyplot-images/plots/line-timeseries/javascript/muix/plot-dark.html",
  "quality_score": 89.0,
  "license": "MIT",
  "guide": "https://anyplot.ai/llms.txt"
}
Part of Time Series Line Plot on anyplot.ai.